Abstract
The fluoroquinolone antimicrobial drug danofloxacin was administered to sheep intravenously (i.v.) and intramuscularly (i.m.) at a dose of 1.25 mg/kg of body weight in a two-period crossover study. The pharmacokinetic properties of danofloxacin in serum, inflamed tissue cage fluid (exudate), and noninflamed tissue cage fluid (transudate) were established by using a tissue cage model. The in vitro and ex vivo activities of danofloxacin in serum, exudate, and transudate against a pathogenic strain of Mannheimia haemolytica were established. Integration of in vivo pharmacokinetic data with the in vitro MIC provided mean values for the area under the curve (AUC)/MIC for serum, exudate, and transudate of 60.5, 85.6, and 45.7 h, respectively, after i.v. dosing and 55.9, 77.9, and 49.1 h, respectively, after i.m. dosing. After i.m. dosing, the maximum concentration/MIC ratios for serum, exudate, and transudate were 10.8, 3.0, and 1.6, respectively. The ex vivo growth inhibition data after i.m. dosing were fitted to the inhibitory sigmoid Emax equation to provide the values of AUC/MIC required to produce bacteriostasis, bactericidal activity, and elimination of bacteria. The respective values for serum were 17.8, 20.2, and 28.7 h, and slightly higher values were obtained for transudate and exudate. It is proposed that use of these data might provide a novel approach to the rational design of dosage schedules.
Danofloxacin is an antibacterial drug of the fluoroquinolone group developed for use in veterinary medicine. It achieves high concentrations in several tissues, including the lung (11, 22, 23, 33). Moreover, studies in our laboratory have demonstrated that the volume of distribution exceeds 3 liters/kg in four ruminant species after intravenous (i.v.) dosing (28). However, only one previous publication has described the pharmacokinetics (PK) of danofloxacin in sheep (22).
The spectrum of antimicrobial activity of danofloxacin is wide and includes most gram-negative bacteria and some gram-positive bacteria, mycoplasmas, and intracellular pathogens, such as Brucella and Chlamydia species; but it has poor activity against anaerobes (1, 13, 25, 32). Detailed studies of its spectrum of activity against sheep pathogens have not been described, but MICs at which 90% of strains are inhibited (MIC90s) of ≤0.25 μg/ml for the cattle pathogens Mannheimia haemolytica, Pasteurella multocida, Haemophilus somnus, Mycoplasma bovis, and Mycoplasma dispar have been reported (3, 10, 12, 21).
Bacterial diseases in sheep cause morbidity, mortality, suffering, and significant economic losses. Antibacterial drugs are therefore used in both treatment and prevention programs. However, there are only limited data on the pharmacology of antibacterial drugs in sheep. Such data are required for the design of rational dosage schedules for clinical use. In addition, the sheep is a suitable species for use in models of disease and inflammation because of its size, temperament, and the ease of repeated samplings of blood and other body fluids.
The design of effective dosage schedules is dependent on (i) the linkage of PK data to ex vivo or in vivo pharmacodynamic (PD) data generated in animal models or in clinical trials and (ii) the fact that fluoroquinolones such as danofloxacin act by a concentration-dependent killing mechanism. A successful treatment outcome is therefore related to the integrated PK-PD parameters maximum concentration of drug (Cmax)/MIC and the area and the curve (AUC)/MIC (2, 5, 6, 7, 8, 14, 15, 16, 19, 20, 26, 27, 31).
The aims of this study were (i) to establish PK data for danofloxacin in sheep after i.v. and intramuscular (i.m.) dosing; (ii) to characterize the rate and extent of danofloxacin penetration into inflamed and noninflamed tissues by determining the distribution into carrageenan-inflamed tissue cage fluid (exudate) and noninflamed tissue cage fluid (transudate); (iii) to determine integrated PK-PD parameters (time greater than the MIC [T > MIC], Cmax/MIC, and AUC/MIC) for danofloxacin in vivo; and (iv) to establish, by using the inhibitory sigmoid Emax equation, the AUC/MICs ex vivo that produce bacteriostasis, bactericidal action, and elimination of bacteria. It is proposed that these parameters be used to provide a rational basis for designing dosage schedules, which will provide maximal efficacy and minimal opportunity for the emergence of resistant microorganisms (17, 18, 30).
MATERIALS AND METHODS
Animals and experimental design.
A two-period crossover study was undertaken with six healthy sheep (Dorset cross; age, approximately 1 year; mean weight, 52.2 ± 3.6 kg). Each sheep received danofloxacin (Advocin injectable solution; Pfizer Animal Health, Sandwich, United Kingdom) at a dose of 1.25 mg/kg of body weight by i.v. and i.m. injection. To maintain social contact, each sheep was housed in an individual pen and separated from the other sheep by wire-mesh barriers. Hay and water were provided ad libitum.
In period 1, three sheep received at zero time danofloxacin i.v. in the right jugular vein and three sheep received the drug in the thigh muscle. In period 2, treatments were reversed, so that each animal received danofloxacin by both routes. An interval of 14 days was allowed between each period.
To investigate the penetration of danofloxacin into tissue fluids, the danofloxacin concentrations in carrageenan-inflamed tissue cage fluid (exudate) and noninflamed tissue cage fluid (transudate) were determined (see below). The ex vivo antibacterial activities of danofloxacin in serum, exudate, and transudate against M. haemolytica (one of the major causative organisms of sheep pneumonia) were studied. In addition, the in vitro danofloxacin MICs for M. haemolytica in serum, exudate, and transudate were determined.
Insertion of tissue cages and sampling procedures.
Four tissue cages, two on each side of the neck approximately equidistant from the jugular vein and spinal cord, were inserted surgically in each animal while the animal was under general anesthesia. The tissue cages comprised hollow polypropylene balls (internal diameter, 27 mm; external diameter, 29 mm; internal volume, 10.5 ml; each ball also had 10 equidistant holes each of 4.8 mm in diameter). The animals were allowed to recover from surgery for 5 to 6 weeks to permit wound healing and the growth of granulation tissue into the cages.
To generate exudate, 0.5 ml of a 1% sterile lambda carrageenan solution (Marine Colloids, Springfield, N.J.) was injected into one tissue cage in each animal at zero time. A noninjected cage was used to collect transudate. In period 2, the tissue cages not used in period 1 were used to collect exudate and transudate.
Blood samples (5 ml) for determination of the danofloxacin concentration in serum were collected without anticoagulant in monovettes (Sarstedt, Leicester, United Kingdom) prior to danofloxacin administration and at 0.083, 0.167, 0.25, 0.33, 0.50, 0.67, 1, 1.5, 2, 3, 4, 6, 9, 12, 24, 30, 36, and 48 h after danofloxacin administration. Serum samples were protected from light and stored at −20°C prior to analysis.
Transudate and exudate were collected in disposable syringes (1.0 ml of each fluid) at 1, 3, 6, 9, 12, 24, 30, 36, and 48 h after drug administration and were protected from light. To remove cells, the samples were centrifuged at 2,000 × g and 4°C for 10 min. The supernatant was divided into two aliquots, each of which was stored at −20°C, prior to determination of the danofloxacin concentration and ex vivo antibacterial activity.
Determination of MIC and MBC for M. haemolytica.
M. haemolytica W629 (an United Kingdom sheep isolate of stereotype A1) was grown freshly from beads, previously stored at −70°C, on tryptone soy blood agar (TSA; Oxoid, Basingstoke, United Kingdom). Ten to 12 colonies were used to inoculate 30 ml of Mueller-Hinton broth (MHB), followed by incubation at 35°C on a shaking incubator (220 rpm) for 3 h (final concentration, ∼108 CFU/ml). Danofloxacin solution (0.5 ml; made up in each fluid) at twice the required final maximum concentration was added to 0.25 ml of MHB, serum, exudate, or transudate. Doubling dilutions from this solution were prepared in each fluid. The percentage of water in each final dilution ranged from 0.01 to 0.16%. The following overlapping sets of doubling dilutions were used to improve the accuracy of the MIC determinations: 0.015 to 0.240, 0.020 to 0.320, 0.0225 to 0.360, 0.025 to 0.400, and 0.0275 to 0.440 μg/ml. The concentrations used to determine the MICs were therefore 0.015, 0.020, 0.0225, 0.025, 0.0275 . . . 0.240, 0.320, 0.360, 0.400, and 0.440 μg/ml. Dilutions were prepared in sterile Macrowell tube strips (Skatron, Newmarket, United Kingdom).
Tubes were inoculated with 0.25 ml of culture to give a final concentration of approximately 5 × 10⁵ CFU/ml. Inocula were prepared in each fluid at 106 CFU/ml. After the danofloxacin-inoculum mixture was mixed with 0.25 ml of fluid in each tube, the mixture was diluted with 0.5 ml of MHB in 9 ml of saline to give a count of 107 CFU/ml. Further 0.5-ml volumes were diluted in 4.5 ml of each fluid to give a count of 106 CFU/ml. Tubes were incubated at 35°C for 18 h and then shaken to mix the contents.
An aliquot of 100 μl from each tube was placed in 0.9 ml of saline (1/10 dilution, 10−1). Of this, 0.5-ml volumes were serially diluted in 4.5 ml to give dilutions of 10−2, 10−3, 10−4, and 10−5. Controls were further diluted to 10−6. Five 20-μl volumes of each dilution were dropped onto TSA, and the plates were incubated at 35°C overnight prior to counting of the colonies. The limit of detection was 10 CFU/ml. MICs were considered the lowest concentration at which bacterial numbers remained below the original inoculum level, and the minimum bactericidal concentration (MBC) was the concentration that produced a 99.9% reduction in the bacterial count.
Ex vivo antimicrobial activity of danofloxacin.
M. haemolytica W629 (a United Kingdom sheep isolate of serotype A1) was grown freshly from beads that had previously been stored on TSA at −70°C. Eight to 10 colonies were used to inoculate 9 ml of MHB, and the colonies were allowed to grow overnight at 35°C.
Serum, exudate, and transudate samples from sheep which had received danofloxacin i.m. were collected at 0, 1, 3, 6, 9, 12, 24, 30, 36, and 48 h. A total of 10 μl of stationary-phase bacterial culture was added to 1 ml of serum to give a final concentration of approximately 3 × 10⁷ CFU/ml. Five microliters of stationary-phase culture was added to 0.35 ml of tissue cage fluids to give a final concentration of approximately 3 × 10⁵ CFU/ml. To determine viable counts, 100 μl of serum was added to 9.9 ml of saline (dilution, 10−2). A total of 100 μl of this mixture was further diluted in 9.9 ml of saline (total dilution, 10−4). For tissue cage fluids, 50 μl was added to 4.95 ml of saline (dilution, 10−2). A total of 50 μl of this mixture was diluted in 4.95 ml (total dilution, 10−4). Controls were further diluted to 10−6. At 3, 6, and 24 h, samples were plated out undiluted as well as at dilutions of 10−2 and 10−4. Five 20-μl drops of each dilution were dropped onto TSA plates. The plates were incubated at 35°C for at least 16 h. The results were expressed as counts per milliliter. The limit of detection was 10 CFU/ml.
HPLC analysis of danofloxacin in serum and tissue cage fluids.
Danofloxacin concentrations in serum, exudate, and transudate were measured by a high-pressure liquid chromatography (HPLC) method with fluorescence detection, modified from the method of Friis (9). Briefly, 0.3 ml of acetonitrile containing an internal standard at a concentration of 1 μg/ml was added to 0.2 ml of sample. The contents of the tube were mixed and then centrifuged at 200 × g and 4°C for 10 min. A volume of 0.15 ml of supernatant was diluted with 0.3 ml of HPLC-grade water, and a 50-μl aliquot was injected onto an HPLC system comprising a 600E solvent delivery system (Millipore Waters Ltd., Watford, United Kingdom), a 474 fluorescence detector (Millipore Waters), and an SCL 6A/SIL6A autoinjector and controller (Shimadzu, Milton Keynes, United Kingdom). The chromatograph consisted of a 15-cm, 5-μm Novapak C18 column (Millipore Waters) equipped with a Novapak C18 guard column (Millipore Waters). The mobile phase was 7% acetonitrile-93% buffer (pH 3.0; 0.01 M phosphate buffer containing 0.008 M tetrabutylammonium sulfate and 0.005 M dibutylamine). The flow rate was 1.0 ml/min. The excitation and emission wavelengths were 280 and 440 nm, respectively, and the limit of quantitation was 0.005 μg/ml. All chemicals were supplied by Fisons Ltd. (Loughborough, United Kingdom). The limit of quantification was 0.005 μg/ml. Within the concentration range of 1 to 10 μg/ml, the accuracy (percent coefficient of variation) was −40 to +20 and the precision was less than 30%.
PK analysis.
PK parameters for danofloxacin concentration-time data for serum, exudate, and transudate were calculated by using the PCNONLIN program (SCI software; Statistical Consultants Inc., Lexington, Ky.). Minimum Akaike Information Criterion Estimates (MAICE) were applied to discriminate the model with the best fit: MAICE = AIC + 2 P.P., where AIC is the Akaike Information Criterion and P.P. is the number of primary parameters.
PD analysis.
By using in vitro MIC data and in vivo PK parameters, the surrogate markers of antimicrobial activity, Cmax/MIC, AUC/MIC, and T > MIC, were determined for serum, exudate, and transudate after both i.v. and i.m. dosing of danofloxacin.
The relationship between the ex vivo AUC at 24 h (AUC24)/MIC ratio and the log10 difference between the initial bacterial count (in number of CFU per milliliter) and the bacterial count after 24 h of incubation was established for serum, exudate, and transudate by using the sigmoid inhibitory Emax model. This model is described by the following equation: E = E0 + [(Emax · CeN)/(EC50N + CeN)], where E is the antibacterial effect measured as the change in the bacterial count (in log10 CFU per milliliter) in the serum, exudate, or transudate sample after 24 h of incubation compared to the initial log10 CFU per milliliter; Emax is the log10 difference in bacterial count between 0 and 24 h in the control sample; E0 is the log10 difference in bacterial count in the test sample containing danofloxacin after 24 h of incubation when the limit of detection of 10 CFU/ml is reached; EC50 is the AUC24/MIC producing 50% of the maximal antibacterial effect; Ce is the AUC24/MIC in the effect compartment (the ex vivo site, that is, serum, exudate, or transudate); and N is the Hill coefficient, which describes the steepness of the (AUC24/MIC)-effect curve. In this investigation, because the drug is inhibitory to bacterial growth, Emax represents the baseline bacterial count and E0 is the maximal effect. This is in contrast to the usual convention that E0 is the baseline value and Emax represents the maximum change from the baseline value. These PD parameters were calculated by using the WINNONLIN nonlinear regression program (SCI software).
Four levels of antibacterial effect of danofloxacin were quantified from the sigmoid Emax equation by determining AUC24/MICs required for bacteriostatic action (no change in bacterial count after 24 h of incubation), a 50% reduction in the bacterial count, bactericidal action (a 99.9% decrease in the bacterial count), and bacterial elimination (the lowest AUC24/MIC that produced a reduction in the count to 10 CFU/ml) in each of the fluids (serum, exudate, and transudate).
The AUC24/MICs required for bacteriostatic and bactericidal activities were determined by using a model written in the laboratory of the Department of Veterinary Basic Sciences, The Royal Veterinary College, by using the WINNONLIN program, while elimination values were obtained from the (AUC24/MIC)-effect curve when the lines for the observed and the predicted values were matched.
Statistical analyses.
Statistical analyses were undertaken by analysis of variance, and significant differences, when they occurred, were examined by using Bonferroni's correction for intergroup comparisons. Differences were accepted as significant for P values <0.05.
RESULTS
Danofloxacin MICs and MBCs.
The MICs and MBCs of danofloxacin in MHB and undiluted serum, exudate, and transudate were determined. The MICs were 0.03 μg/ml in broth, serum, and exudate and 0.035 μg/ml in transudate. The MBCs were 0.040 μg/ml in serum and 0.045 μg/ml in broth, exudate, and transudate.
i.v. administration of danofloxacin. (i) Danofloxacin concentrations in serum, exudate, and transudate.
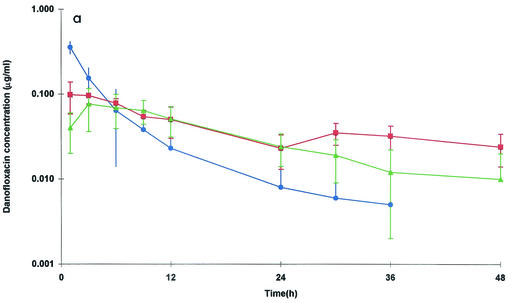
The mean ± standard deviation (SD) concentrations of danofloxacin in serum, exudate, and transudate are presented in Fig. 1a. The data for serum were best fitted to a two-compartmental model for all six sheep (Table 1).
FIG. 1.
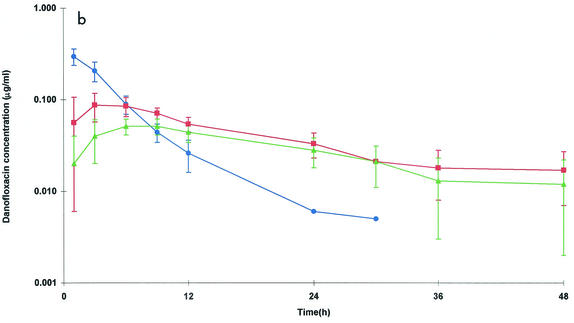
(a) Semilogarithmic plots of the concentrations of danofloxacin in serum (•), exudate (▪), and transudate (▴) after i.v. (a) and i.m. (b) administration at a dose of 1.25 mg/kg. Values are means ± SDs (n = 6).
TABLE 1.
PK parameters for danofloxacin in serum after i.v. administrationa
| Pharmacokinetic parameterb | Mean | SD |
|---|---|---|
| A (μg/ml) | 0.80 | 0.23 |
| B (μg/ml) | 0.30 | 0.04 |
| α (h−1) | 2.50 | 0.94 |
| β (h−1) | 0.21 | 0.04 |
| t1/2α (h) | 0.37 | 0.29 |
| t1/2β (h) | 3.39 | 0.75 |
| MRT (h) | 3.97 | 0.56 |
| k10 (/h) | 0.62 | 0.16 |
| k12 (/h) | 1.24 | 0.57 |
| k21 (/h) | 0.86 | 0.33 |
| k12:k21 | 1.40 | 0.48 |
| AUC (μg · h/ml) | 1.81 | 0.33 |
| AUMC (μg · h2/ml) | 7.35 | 2.48 |
| Cpo (μg/ml) | 1.09 | 0.25 |
| CL (liter/kg/h) | 0.71 | 0.13 |
| Vc (liter/kg) | 1.20 | 0.27 |
| V (liter/kg) | 3.37 | 0.23 |
| Vss (liter/kg) | 2.76 | 0.17 |
The values are means and SDs for six sheep.
A and B, Y-axis intercept terms; α, distribution rate constant; β, elimination rate constant; t1/2α, distribution half-life; t1/2β, elimination half-life; MRT, mean residence time; k10, central compartment elimination rate constant; k12, rate constant from central to peripheral compartment; k21, rate constant from peripheral to central compartment; AUC, area under the concentration-versus-time curve; AUMC, area under the first-moment curve; Cpo, drug concentration at zero time; CL, body clearance; Vc, volume of distribution in the central compartment; V, volume of distribution; Vss, volume of distribution at steady state.
Danofloxacin penetration into carrageenan-inflamed tissue cage fluid was more rapid than that into transudate. Mean penetration half-lives (t1/2 pens) were 0.46 and 1.96 h, respectively (P < 0.05) (Table 2). By 6 h and subsequently up to the last sampling time (48 h), the danofloxacin concentrations in both exudate and transudate were higher than the concentrations in serum (Fig. 1a). The mean Cmax of 0.100 μg/ml in exudate was achieved at 2.19 h. The corresponding data for transudate were 0.079 μg/ml at a later time of 5.18 h (P < 0.05 for the time to Cmax) (Table 2). The elimination half-lives (t1/2βs) in both tissue cage fluids (17.6 h for exudate [P < 0.05] and 10.5 h for transudate [P < 0.05]) were longer than those in serum.
TABLE 2.
PK parameters for danofloxacin in exudate and transudate after i.v. administrationa
| Fluid | kpen (h−1) | t1/2 pen (h) | kel (h−1) | t1/2β (h) | AUC (μg · h/ml) | Tmax (h) | Cmax (μg/ml) |
|---|---|---|---|---|---|---|---|
| Exudate | 2.50 ± 2.14 | 0.46 ± 0.25 | 0.06 ± 0.05 | 17.60 ± 11.67 | 2.57 ± 1.30 | 2.19 ± 1.11 | 0.100 ± 0.020 |
| Transudate | 0.51 ± 0.21b | 1.96 ± 1.79b | 0.08 ± 0.04 | 10.45 ± 4.88 | 1.60 ± 0.67 | 5.18 ± 2.56b | 0.079 ± 0.030 |
The values are means ± SDs (n = 6). kpen, rate constant from central compartment to tissue fluid; t1/2 pen, penetration half-life; kel, tissue fluid elimination rate constant; t1/2β, tissue fluid elimination half-life; Tmax, time to Cmax; Cmax, maximum drug concentration.
P < 0.05 for comparison of exudate and transudate.
(ii) PK-PD integration for danofloxacin in serum, exudate, and transudate.
The PK-PD integration parameters for the in vivo PK data and the MICs measured in vitro for serum, exudate, and transudate are presented in Table 3. i.v. administration of danofloxacin (1.25 mg/kg) provided an AUC/MIC of 60.5 h for M. haemolytica W629 in serum. The time for which the concentration in serum exceeded the MIC was 10.9 h. Hence, the concentration of drug in serum remained above the MIC for almost half of the recommended dosage interval of 24 h.
TABLE 3.
In vivo PK-PD integration parameters for danofloxacin after i.v. and i.m. administration at a dose of 1.25 mg/kga
| Route of administration and fluid | AUC/MIC (h) | Cmax/MIC | T > MIC (h) |
|---|---|---|---|
| i.v. | |||
| Serum | 60.5 ± 11.1 | NAb | 10.9 ± 2.1 |
| Exudate | 85.6 ± 43.2 | 3.35 ± 0.81 | 27.2 ± 17.7 |
| Transudate | 45.7 ± 19.2 | 2.25 ± 0.86c | 16.3 ± 7.3 |
| i.m. | |||
| Serum | 55.9 ± 39.4 | 10.79 ± 0.86 | 12.1 ± 2.5 |
| Exudate | 77.9 ± 19.8 | 3.03 ± 1.13d | 27.0 ± 8.1d |
| Transudate | 49.1 ± 17.1c | 1.57 ± 0.44c,d | 16.6 ± 5.3c |
The values are means ± SDs (n = 6).
NA, not applicable.
P < 0.05 for comparison of exudate and transudate.
P < 0.01 for comparison of serum and exudate or transudate.
The AUC/MIC was 85.6 h for M. haemolytica W629 in exudate. The corresponding value in transudate was 45.7 h, but this value was not significantly different from that obtained in exudate. The Cmax/MIC was 3.35 for exudate. A lower value of 2.25 was obtained for transudate (P < 0.05).
The T > MIC for danofloxacin in exudate was 27.2 h. Therefore, the concentrations in exudate remain above the MIC longer than the recommended dosage interval (24 h), although the AUC/MIC of 85.6 h is below what might be the optimal level. The T > MIC for danofloxacin in transudate was not significantly different from the T > MIC in exudate.
i.m. administration of danofloxacin. (i) Danofloxacin concentrations in serum, exudate, and transudate.
The mean ± SD serum danofloxacin concentrations after i.m. administration at a dose of 1.25 mg/kg are presented in Fig. 1b. Data for serum were best fitted to a monocompartmental model for all animals except one (sheep 4), for which the danofloxacin concentrations were best described by a two-compartmental model. Absorption was rapid after i.m. dosing; the mean absorption half-life (t1/2α) was 0.17 h (Table 4). The mean danofloxacin Cmax of 0.324 μg/ml was achieved in 0.70 h. Danofloxacin bioavailability was complete (98.5%). The t1/2β was 3.17 h, and this value was similar to that achieved after i.v. dosing.
TABLE 4.
PK parameters for danofloxacin after i.m. administrationa
| Fluid | kabs (h−1) | t1/2α (h) | tlag (h) | kel (h−1) | t1/2β (h) | AUC (μg · h/ml) | Tmax (h) | Cmax (μg/ml) | F (%) |
|---|---|---|---|---|---|---|---|---|---|
| Serum | 6.17 ± 4.53 | 0.17 ± 0.10 | NA | 0.22 ± 0.01 | 3.17 ± 0.17 | 1.68 ± 0.27 | 0.70 ± 0.37 | 0.324 ± 0.024 | 98.5 ± 17.4 |
| Exudate | 1.05 ± 1.00 | 1.13 ± 0.64 | 0.64b | 0.06 ± 0.05 | 17.13 ± 9.53 | 2.34 ± 0.59 | 4.46 ± 0.20 | 0.091 ± 0.023 | NA |
| Transudate | 0.56 ± 0.59 | 2.00 ± 1.00 | 0.58 ± 0.17 | 0.05 ± 0.02 | 17.66 ± 8.06 | 1.72 ± 0.59 | 6.96 ± 3.04 | 0.055 ± 0.025c | NA |
The values are means ± SDs (n = 6 unless indicated otherwise).
n = 1. kabs, absorption rate constant for serum and penetration rate constant for exudate and transudate; t1/2α, absorption half-life for serum and penetration half-life for exudate and transudate; tlag, lag time; F, bioavailability; NA, not applicable. See footnote a of Table 2 for the definitions of the other variables.
P < 0.05 for comparison of exudate and transudate.
Danofloxacin penetration into both exudate and transudate was fairly rapid (Table 4). The Cmaxs in these fluids were 0.091 μg/ml (at 4.46 h) and 0.055 μg/ml (at 6.96 h), respectively. Cmaxs were significantly different (P < 0.05) for exudate and transudate, while the time to Cmax was not significantly different for exudate and transudate. t1/2βs were almost six times longer for both nonvascular fluids than for serum (17.13 and 17.66 h for exudate and transudate, respectively). The AUC for danofloxacin in exudate was higher than that in serum (2.34 and 1.68 μg · h/ml, respectively), but the difference was not significant. The mean AUC (1.72 μg · h/ml) in transudate was similar to that in serum. The danofloxacin concentrations in tissue cage fluids were greater than those in serum by 9 h and thereafter (Fig. 1b).
(ii) PK-PD integration for danofloxacin in serum, exudate, and transudate.
The PK-PD integration parameters for the in vivo PK data and the MIC measured in vitro are presented in Table 3. i.m. administration of danofloxacin at a dose of 1.25 mg/kg produced an in vivo AUC/MIC for M. haemolytica W629 in serum of 55.9 h. The mean T > MIC was 12.1 h, while the Cmax/MIC was 10.8. Therefore, treatment with danofloxacin at a dose of 1.25 mg/kg in sheep would be expected to be very effective against this strain of M. haemolytica.
The T > MIC was 27.0 h in exudate. The mean Cmax/MIC ratio was 3.03, and the mean AUC/MIC was 77.9 h. The AUC/MIC for M. haemolytica W629 in transudate was 49.1 h, which was less than the value in exudate (P < 0.05). The mean Cmax/MIC in transudate (1.57) was also less than that in exudate (P < 0.05). The mean T > MIC in transudate of 16.6 h was less than that in exudate (P < 0.05).
(iii) Danofloxacin ex vivo antibacterial activity in serum, exudate, and transudate.
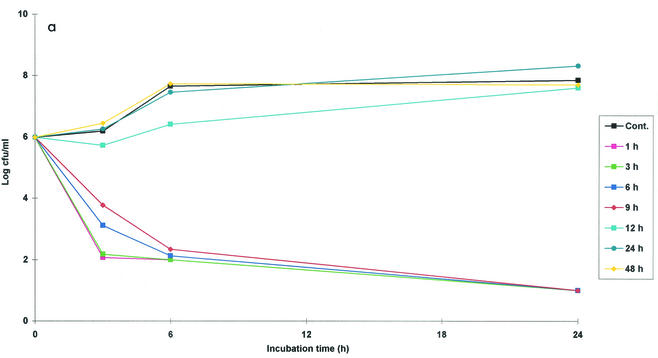
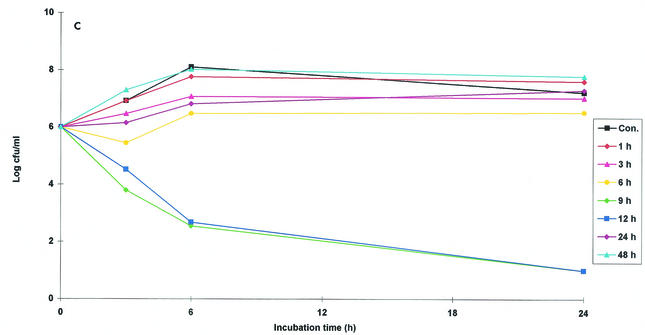
The ex vivo activity of danofloxacin against M. haemolytica W629 in serum was determined at nine time points by using samples harvested between 1 and 48 h. For all samples collected from all animals in the first 9 h, danofloxacin exerted a very good bactericidal effect after only 6 h of incubation (Fig. 2a). After 24 h of incubation almost all bacteria were killed (detection limit, 10 CFU/ml) for all samples collected between 1 and 9 h. For samples collected at 12 h, good bactericidal activity was obtained for samples from two animals after 24 h of incubation. There was inhibition of growth for samples from two additional sheep, and there was no inhibition of bacterial growth for the samples from the two remaining sheep. No bacteriostatic or bactericidal effects were obtained for serum samples collected at 24, 30, 36, and 48 h.
FIG. 2.
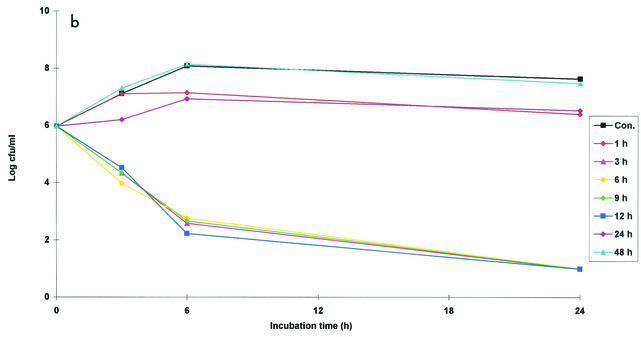
Ex vivo antibacterial activity of danofloxacin (plots of log10 CFU per milliliter versus time) against M. haemolytica W629 in serum (a), exudate (b), and transudate (c) after i.m. administration at a dose of 1.25 mg/kg. Values are means (n = 6). SD bars are excluded for clarity. Samples were harvested at predetermined times between 0 and 48 h. Data for samples collected at 30 and 36 h are not shown. Cont., control serum containing no danofloxacin.
Exudate samples collected at nine time points between 1 and 48 h were selected for study. For all samples collected between 3 and 12 h, danofloxacin exerted a good bactericidal effect after 6 h of incubation, while after 24 h of incubation, all or almost all bacteria were killed (Fig. 2b). No inhibitory effects on bacterial growth were obtained for samples collected at 30, 36, and 48 h. The arithmetic mean bacterial count was high for exudate samples collected at 1 h, indicating no apparent bactericidal effect. However, a good bactericidal effect was obtained for samples from three of four animals.
Transudate samples collected at nine time points between 1 and 48 h were selected for study. For samples selected at 3 h the arithmetic mean bacterial count remained high, indicating no apparent inhibitory effect of danofloxacin (Fig. 2c). However, good bactericidal activity was obtained for samples from two of five animals. Similarly, whenever the drug concentration was sufficiently high, there was a good bactericidal effect for samples collected at 6 h. Bactericidal activity was also exhibited for samples collected at 9 and 12 h. Neither bacteriostatic activity nor bactericidal activity was obtained for samples collected at 1, 30, 36, and 48 h.
(iv) In vivo and ex vivo AUC24/MIC of danofloxacin for M. haemolytica W629.
The in vivo and ex vivo AUC24/MIC ratios for danofloxacin in sheep fluids after i.m. administration of the drug at a dose of 1.25 mg/kg are presented in Table 5. An ex vivo AUC24/MIC of 35 h for serum samples collected at 9 h provided a good bactericidal effect, sufficient to eliminate bacteria almost completely after 24 h of incubation (Fig. 2a; Table 5). To provide rapid elimination within 3 h of incubation, an AUC24/MIC equal to or greater than 16 h was required (for samples collected at 1 and 3 h). Danofloxacin administration provided a mean in vivo AUC24/MIC of 56 h for the serum samples. This was approximately 1.5 times greater than the ex vivo AUC24/MIC for serum samples collected at 9 h, which almost completely eliminated the bacteria after 24 h of incubation.
TABLE 5.
Danofloxacin in vivo and ex vivo AUC24h/MIC after i.m. administration of danofloxacin at a dose of 1.25 mg/kga
| Fluid | Danofloxacin AUC24/MIC (h)
|
|||||||||
|---|---|---|---|---|---|---|---|---|---|---|
| In vivo | Ex vivo for samples collected at the following time after drug administration (h):
|
|||||||||
| 1 | 3 | 6 | 9 | 12 | 24 | 30 | 36 | 48 | ||
| Serum | 56.56 ± 9.45 | 237.87 ± 51.75 | 165.60 ± 37.39 | 71.20 ± 19.54 | 35.33 ± 9.48 | 20.53 ± 4.97 | 4.64 ± 0.34b | 4.00 ± 0.06c | ||
| Exudate | 45.61 ± 6.63 | 44.53 ± 40.94e | 69.28 ± 27.62e | 67.87 ± 15.87 | 56.40 ± 7.22e | 42.88 ± 8.08e | 26.13 ± 9.48e | 16.96 ± 9.09 | 14.40 ± 7.89 | 11.60 ± 10.04 |
| Transudate | 28.19 ± 16.29d,e | 13.60 ± 13.05e | 27.15 ± 13.49e | 34.63 ± 9.99e,f | 35.09 ± 8.50d | 30.45 ± 5.14f | 19.31 ± 5.24g | 14.40 ± 5.24 | 8.64 ± 3.89 | 8.46 ± 5.41 |
The values are means ± SDs (n = 6 unless indicated otherwise).
n = 5.
n = 3.
P < 0.01 for comparison of exudate and transudate.
P < 0.01 for comparison of serum and exudate or transudate.
P < 0.05 for comparison of exudate and transudate.
P < 0.05 for comparison of serum and exudate or transudate.
An ex vivo AUC24/MIC of 17 h was obtained for exudate samples collected at 30 h, and this did not affect bacterial growth (Fig. 2b; Table 5). However, an AUC24/MIC of 43 h for samples collected at 12 h was sufficient to eliminate the bacteria after incubation for 24 h (Fig. 2b). Danofloxacin administration produced an in vivo AUC24/MIC of 46 h for exudate samples, which is almost identical to the ex vivo AUC24/MIC for the samples collected at 12 h, which eliminated the bacteria.
An ex vivo AUC24/MIC of 30 h for transudate samples collected at 12 h was sufficient to eliminate the bacteria (Fig. 2c; Table 5). i.m. administration of danofloxacin provided an in vivo AUC24/MIC of 28 h, which is similar to the ex vivo values of 12 h that produced bacterial elimination. The concentrations of danofloxacin achieved in vivo in serum, exudate, and transudate should therefore be effective in curing infection with M. haemolytica W629 under clinical circumstances. Statistically significant differences between the three fluids are indicated in Table 5.
(v) Ex vivo AUC24/MIC required for bacteriostasis, bactericidal activity, and elimination of bacteria.
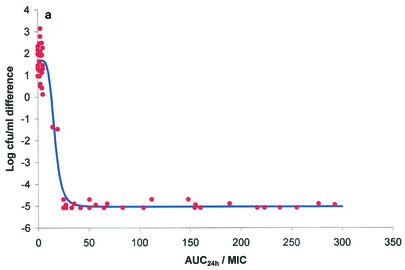
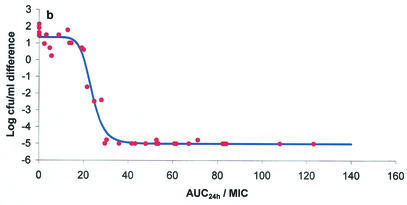
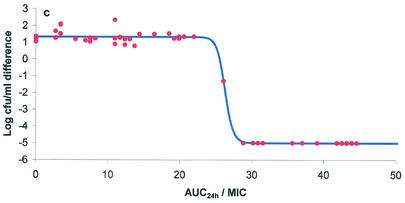
The ex vivo component of the study yielded AUC24/MICs for serum, exudate, and transudate and also provided bacterial growth inhibition curves over the 24-h incubation period. These two data sets were integrated by using the inhibitory form of the sigmoid Emax equation to provide numerical values of AUC24/MIC required for various degrees of bacterial inhibition. Graphs depicting the bacterial count and AUC24/MIC relationships for serum, exudate, and transudate are presented in Fig. 3a, b, and c, respectively. The calculated mean AUC24/MICs for serum that produced bacteriostasis (no change in the number of bacteria), bactericidal activity (a 3-log reduction in the bacterial count), and elimination of bacteria (a reduction in the bacterial count to <10 CFU/ml) were 17.79, 20.18, and 28.67 h, respectively (Table 6). Slightly higher values for each integrated variable were obtained for exudate and transudate (Table 6), but the only statistically significant difference was the higher AUC24/MIC for exudate required to eliminate bacteria in comparison with the corresponding value for serum (P < 0.05). The finding that the danofloxacin AUC24/MICs that produced bactericidal activity in all three fluids were only slightly greater than those that produced bacteriostasis is explained by the steep slope of the AUC24/MIC-versus-bacterial count relationship (Table 6).
FIG. 3.
Plots of ex vivo AUC24/MIC versus bacterial count (log10 CFU per milliliter) for M. haemolytica W629 in serum (a), exudate (b), and transudate (c). The points represent the values observed for individual animals, and the curve is the line of best fit, based on the sigmoid Emax equation.
TABLE 6.
PK-PD integration of ex vivo danofloxacin data after i.m. administration at a dose of 1.25 mg/kga
| Fluid | Log E0 (CFU/ml) | Log Emax (CFU/ml) | Log Emax − log E0 (CFU/ml) | AUC24/MIC for bacteriostati action (h) | AUC24/MIC EC50b | AUC24/MIC for bactericidal action | AUC24/MIC for bacterial elimination | Slope (n)c |
|---|---|---|---|---|---|---|---|---|
| Serum | −4.967 ± 0.149 | 1.783 ± 0.678 | 6.749 ± 0.607 | 17.79 ± 4.26 | 19.10 ± 4.34 | 20.18 ± 4.21 | 28.67 ± 4.33 | 17.04 ± 7.10 |
| Exudate | −4.982 ± 0.072 | 1.392 ± 0.442 | 6.374 ± 0.386 | 20.57 ± 2.20 | 23.38 ± 2.34 | 25.45 ± 2.94 | 41.60 ± 8.72d | 14.87 ± 10.20 |
| Transudate | −5.001 ± 0.016 | 1.226 ± 0.094 | 6.228 ± 0.082 | 20.89 ± 5.38 | 22.37 ± 4.90 | 23.17 ± 4.74 | 33.26 ± 3.08 | 36.03 ± 22.26 |
The values are means ± SDs (n = 6 for serum and n = 4 for exudate and transudate).
AUC24/MIC EC50, AUC24/MIC of drug producing 50% of the maximum antibacterial effect.
n = slope of the AUC24/MIC-response curve.
P < 0.05 for comparison of serum and exudate.
DISCUSSION
The i.v. and i.m. administration of danofloxacin at a dose of 1.25 mg/kg to sheep yielded values for PK variables which were, in most instances, similar to those obtained by McKellar et al. (22). The present study extends the findings of McKellar et al. (22), however, by demonstrating the relatively rapid penetration into the inflammatory exudate during acute inflammation and the slow elimination of danofloxacin from the inflammatory exudate during acute inflammation. The penetration of drugs into tissue cage fluids is dependent in part on the dimensions and shapes of the cages and in part on the age and extent of granulation tissue growth into the cages and the vascularity of that growth. In addition, in the present study, the acute inflammation of the tissue within the cage facilitated danofloxacin penetration. This is illustrated by the somewhat slower penetration into transudate fluids of noninflammed tissue cages. These findings may be relevant to danofloxacin penetration to sites of infection, although it should be noted that the inflammation in the present study was sterile.
Determinations of antimicrobial drug efficacy and potency have been undertaken in innumerable in vitro, ex vivo, and in vivo studies. Each approach is associated with a number of advantages and disadvantages. Thus, the most commonly used measure of in vitro potency is the MIC. Although it is simple to determine the MIC, the MIC is a relatively crude index since it is usually measured by a doubling dilution procedure. Moreover, use of an artificial medium such as broth to measure the MIC does not closely simulate in vivo conditions. Therefore, in this study MICs were determined in undiluted serum, exudate, and transudate to enable meaningful calculation of the derived variables such as AUC/MIC for each fluid. In addition, to improve accuracy, MICs were determined by using five overlapping sets of doubling dilutions.
Doses of antimicrobial agents for clinical use are generally determined by relating the PK data obtained for healthy animals either to some measure of in vitro antibacterial activity, usually the MIC, or to the outcome of treatment in a disease model or clinical subjects. To address the limitations of commonly used methods, this study has attempted to relate drug PDs to drug PKs in a novel way in an ex vivo model. The ex vivo AUC24/MIC data were integrated by using the sigmoid Emax equation with the reduction in bacterial numbers after 24 h of incubation. From these measurements, the lowest effective ex vivo AUC24/MICs required for bacteriostasis, bactericidal activity, and total killing of the bacteria were determined for each of the fluids evaluated, serum, exudate, and transudate. For serum the values were 17.8, 20.2, and 28.7 h, respectively, and slightly higher values were obtained for exudate and transudate.
By using the lowest ex vivo AUC24/MIC required to eliminate all organisms after 24 h of incubation, calculation of the optimal dosage has been undertaken by the equation x = [1.25 × (targeted AUC24/MIC ex vivo)]/[(AUC/MIC in vivo) for a dose of 1.25 mg/kg)], where x is the projected dosage. The values of x obtained for serum, exudate, and transudate were 0.641, 0.667, and 0.847 mg/kg, respectively. Assuming an MIC90 of 0.25 μg/ml, the corresponding dosages would be 5.34, 5.56, and 6.05 mg/kg. The similarity of these values for the three types of biological fluid supports use of the data obtained by this method to set provisional dosage schedules. However, because of possible in vivo and ex vivo differences in antimicrobial activity, the dosage obtained by this method might not be recommended for clinical use but might be recommended for evaluation in clinical trials. This recommended dosage would be modified if the MIC90 differed from the assumed value of 0.25 μg/ml.
It might be argued that optimization of dosage schedules by use of the principles outlined in this paper will involve the administration of amounts of drug in excess of those required to achieve clinical and bacteriological cures in the majority of animals. This may be so; indeed, it is inevitable. Nevertheless, this approach should ensure not only optimal efficacy but also minimal opportunity for the emergence of resistant organisms, a very significant consideration at present.
Previous studies have shown that for plasma fluoroquinolone Cmax/MICs greater than 3 produce 99% reductions in bacterial counts and that Cmax/MICs of 8 or greater suffice to prevent the emergence of resistant bacteria when the MICs for the subpopulation are four- to eightfold higher (2). Dudley (7) confirmed that selection of resistant bacteria may occur with a fluoroquinolone dosage regimen which produced a Cmax/MIC less than 8. A similar Cmax/MIC (greater than 8) for aminoglycosides was likewise required to prevent regrowth of the resistant subpopulation of bacteria, for which MICs were four- to eightfold higher (2, 4, 16). Other investigations have confirmed that for aminoglycosides optimal bactericidal activity was achieved with a Cmax/MIC ratio of 8 to 10 (24, 26). The mechanism underlying the association of Cmax/MIC and both treatment efficacy and reduction of the emergence of resistance is not certain. It might be explained by both the postantibiotic effect and the postantibiotic sub-MIC effect phenomena.
In summary, the PK-PD integration methods described in this paper may provide the basis for the design of a dosing schedule that will ensure bacteriological cure and minimize resistance development. The approach might be used to assist with the selection of a dosage for subsequent evaluation in clinical trials. The methods might also be used as a means of providing guidelines for registration bodies which are required to verify the efficacy claims made by pharmaceutical companies applying for marketing authorizations for human and veterinary products. However, the present approaches to PK-PD integration require further development. There is now a need to design experiments with either naturally diseased animals or disease models to establish the lowest AUC/MICs that result in the elimination of bacteria in vivo. Such experiments will further provide a rational basis for the selection of optimal dosage schedules for antimicrobial agents. Finally, we have proposed that establishment of clinical and bacteriological efficacies in vivo, which are linked to population PK data, are a necessary development for establishment of antimicrobial dosage schedules (17, 18, 29, 30).
Acknowledgments
The financial support of Pfizer Animal Health is gratefully acknowledged.
REFERENCES
- 1.Appelbaum, P. C., and P. A. Hunter. 2000. The fluoroquinolone antibacterials: past, present and future perspectives. Int. J. Antimicrob. Agents 16:5-15. [DOI] [PubMed] [Google Scholar]
- 2.Blaser, J., B. B. Stone, M. C. Groner, and S. H. Zinner. 1987. Comparative study with enoxacin and netilmicin in a pharmacodynamic model to determine importance of ratio of antibiotic peak concentration to MIC for bacterial activity and emergence of resistance. Antimicrob. Agents Chemother. 31:1054-1060. [DOI] [PMC free article] [PubMed] [Google Scholar]
- 3.Cooper, A. C., J. R. Fuller, M. K. Fuller, P. Whittlestone, and D. R. Wise. 1993. In vitro activity of danofloxacin, tylosin and oxytetracycline against mycoplasmas of veterinary importance. Res. Vet. Sci. 54:329-334. [DOI] [PubMed] [Google Scholar]
- 4.Czock, D., M., and M. Giehl. 1995. Aminoglycoside pharmacokinetics and dynamics: a nonlinear approach. Int. J. Clin. Pharmacol. Ther. 33:537-539. [PubMed] [Google Scholar]
- 5.Dalhoff, A., and U. Ullmann. 1990. Correlation between pharmacokinetics, pharmacodynamics and efficacy of antibacterial agents in animal models. Eur. J. Clin. Microbiol. Infect. Dis. 9:479-487. [DOI] [PubMed] [Google Scholar]
- 6.Drusano, G. L., D. E. Johnson, M. Rosen, and H. Standiford. 1993. Pharmacodynamics of a fluoroquinolone antimicrobial agent in a neutropenic rat model of Pseudomonas sepsis. Antimicrob. Agents Chemother. 37:483-490. [DOI] [PMC free article] [PubMed] [Google Scholar]
- 7.Dudley, M. N. 1991. Pharmacodynamics and pharmacokinetics of antibiotics with special reference to the fluoroquinolones. Am. J. Med. 91(Suppl. 6A):455-505. [DOI] [PubMed] [Google Scholar]
- 8.Forrest, A., D. E. Nix, C. H. Ballow, T. F. Goss, M. C. Birmingham, and J. J. Schentag. 1993. Pharmacodynamics of intravenous ciprofloxacin in seriously ill patients. Antimicrob. Agents Chemother. 37:1073-1081. [DOI] [PMC free article] [PubMed] [Google Scholar]
- 9.Friis, C. 1993. Penetration of danofloxacin into the respiratory tract tissues and secretion in calves. Am. J. Vet. Res. 54:1122-1127. [PubMed] [Google Scholar]
- 10.Giles, C. J. 1991. Danofloxacin. A new antimicrobial for therapy of infectious respiratory diseases in cattle and swine, p. 87-96. In Proceedings of the Royal Veterinary College/Pfizer Symposium on Respiratory Disease in Cattle and Pigs. The Royal Veterinary College, Hatfield, United Kingdom.
- 11.Giles, C. J., R. A. Magonigle, W. T. R. Grimshaw, et al. 1991. Clinical pharmacokinetics of administered danofloxacin in cattle. J. Vet. Pharmacol. Ther. 14:400-410. [DOI] [PubMed] [Google Scholar]
- 12.Grimshaw, W. T. R., C. J. Giles, A. C. Cooper, and D. J. Shanks. 1990. The efficacy of danofloxacin in the therapy of pneumonia associated with Pasteurella species in housed calves. Dtsch. Tierarztl. Wochenschr. 97:529-532. [PubMed] [Google Scholar]
- 13.Hannan, P. C. T., P. J. O'Hanlon, and N. M. Rogers. 1989. In vitro evaluation of various quinolone antibacterial agents against veterinary mycoplasmas and porcine respiratory bacterial pathogens. Res. Vet. Sci. 46:202-211. [PubMed] [Google Scholar]
- 14.Hooper, D. C., and J. S. Wolfson. 1991. Mode of action of the new quinolones: new data. Eur. J. Clin. Microbiol. Infect. Dis. 10:222-231. [DOI] [PubMed] [Google Scholar]
- 15.Hyatt, J. M., D. E. Nix, and J. J. Schentag. 1994. Pharmacokinetics and pharmacodynamics of ciprofloxacin against similar MIC strains of Streptococcus pneumoniae, Staphylococcus aureus, and Pseudomonas aeruginosa using kill curve methodology. Antimicrob. Agents Chemother. 38:2730-2737. [DOI] [PMC free article] [PubMed] [Google Scholar]
- 16.Hyatt, J. M., P. S. McKinnon, G. S. Zimmer, and J. J. Schentag. 1995. The importance of pharmacokinetic/pharmacodynamic surrogate markers to outcome, focus on antibacterial agents. Clin. Pharm. Concepts 28:143-160. [DOI] [PubMed] [Google Scholar]
- 17.Lees, P., and F. Shojaee AliAbadi. 2000. Rationalising dosage regimens of antimicrobial drugs: a pharmacological perspective. J. Med. Microbiol. 49:943-945. [DOI] [PubMed] [Google Scholar]
- 18.Lees, P., and F. Shojaee AliAbadi. 2002. Rational dosing of antimicrobial drugs: animals versus humans. Int. J. Antimicrob. Agents 19:269-284. [DOI] [PubMed] [Google Scholar]
- 19.Leggett, J. E., R. Fantin, S. Ebert, K. Totsuka, B. Vogelman, W. Calame, H. Mattie, and W. A. Craig. 1989. Comparative antibiotic dose-effect relations at several dosing intervals in murine pneumonitis and thigh infection models. J. Infect. Dis. 159:281-290. [DOI] [PubMed] [Google Scholar]
- 20.Leggett, J. E., S. Ebert, B. Fantin, and W. A. Craig. 1991. Comparative dose-effect relationships at several dosing intervals for beta-lactam, aminoglycoside and quinolone antibiotics against gram-negative bacilli in murine thigh-infection and pneumonitis models. Scand. J. Infect. Dis. 74:179-184. [PubMed] [Google Scholar]
- 21.McGuirk, P. R., M. R. Jefson, D. D. Mann, N. C. Eliott, P. Chang, E. P. Cisek, C. P. Cornell, T. D. Gootz, S. L. Haskell, M. S. Hindahl, et al. 1992. Synthesis and structure-activity relationship of 7-diazabicycloalkylquinolones, including danofloxacin, a new quinolone antibacterial agent for veterinary medicine. J. Med. Chem. 35:611-621. [DOI] [PubMed] [Google Scholar]
- 22.McKellar, Q. A., F. I. Gibson, and Z. R. McCormack. 1998. Pharmacokinetics and tissue disposition of danofloxacin in sheep. Biopharm. Drug Dispos. 19:123-129. [DOI] [PubMed] [Google Scholar]
- 23.McKellar, Q. A., F. I. Gibson, A. Monteiro, and M. Bregante. 1999. Pharmacokinetics of enrofloxacin and danofloxacin in plasma, inflammatory exudate, and bronchial secretions of calves following subcutaneous administration. Antimicrob. Agents Chemother. 43:1988-1992. [DOI] [PMC free article] [PubMed] [Google Scholar]
- 24.Moore, R. D., P. S. Lietman, and C. R. Smith. 1987. Clinical response to aminoglycoside therapy: importance of the ratio of peak concentration to minimal inhibitory concentration. J. Infect. Dis. 155:93-99. [DOI] [PubMed] [Google Scholar]
- 25.Neu, H.C. 1991. Synergy and antagonism of combinations with quinolones. Eur. J. Clin. Microbiol. Infect. Dis. 10:255-261. [DOI] [PubMed] [Google Scholar]
- 26.Nicolau, D. P., R. Quintiliani, and C. H. Nightingale. 1995. Antibiotic kinetics and dynamics for the clinician. Antimicrob. Ther. Med. Clin. N. Am. 79:477-495. [DOI] [PubMed] [Google Scholar]
- 27.Sarasola, P., P. Lees, F. AliAbadi, Q. A. McKellar, W. Donachie, K. A. Marr, S. J. Sunderland, and T. G. Rowan. 2002. Pharmacokinetic and pharmacodynamic profiles of danofloxacin administered by two dosing regimens in calves infected with Mannheimia (Pasteurella) haemolytica. Antimicrob. Agents Chemother. 46:3013-3019. [DOI] [PMC free article] [PubMed] [Google Scholar]
- 28.Shojaee AliAbadi, F. 1997. Danofloxacin pharmacodynamic and pharmacokinetic inter-relationships in ruminant species. Ph.D. thesis. University of London, London, United Kingdom.
- 29.Shojaee AliAbadi, F., and P. Lees. 1997. Pharmacodynamic and pharmacokinetic inter-relationships of antibacterial drugs. J. Vet. Pharmacol. Ther. 20:14-17. [Google Scholar]
- 30.Shojaee AliAbadi, F., and P. Lees. 2000. Antibiotic treatment for animals: effect on bacterial population and dosage regimen optimisation. Int. J. Antimicrob. Agents 14:307-313. [DOI] [PubMed] [Google Scholar]
- 31.Vogelman, B., S. Gudmundsson, J. Leggett, J. Turnidge, S. Ebert, and W. A. Craig. 1988. Correlation of antibacterial pharmacokinetic parameters with therapeutic efficacy in animal models. J. Infect. Dis. 158:831-847. [DOI] [PubMed] [Google Scholar]
- 32.Wolfson, J. S., and D. C. Hooper. 1989. Fluroquinolone antimicrobial agents. Clin. Microbiol. Rev. 2:378-424. [DOI] [PMC free article] [PubMed] [Google Scholar]
- 33.Wolfson, J. S., and D. C. Hooper. 1991. Pharmacokinetics of quinolones: newer aspects. Eur. J. Clin. Microbiol. Infect. Dis. 10:267-274. [DOI] [PubMed] [Google Scholar]


