

Abstract
Ca2+-activated Cl− channels contribute to agonist-evoked contraction and spontaneous activity in some smooth muscle preparations. Patch pipette techniques were used to study the properties of single Ca2+-activated Cl− channels in freshly dispersed rabbit pulmonary artery myocytes. In the cell-attached recording mode, two conductance states of 3.5 and 1.8 pS were recorded either spontaneously or in response to increasing [Ca2+]i. With inside-out patches, the 3.5 pS channel current predominated at 50 nm [Ca2+]i, but at 500 nm [Ca2+]i most channels opened to the 1.8 pS level and an additional 1.2 pS channel conductance was resolved. At 1 µm [Ca2+]i all of the Cl− channels opened either to the 1.8 pS or 1.2 pS level. In 0 [Ca2+]i, no channel activity was observed at −100 mV to +100 mV, but with 10–250 nm [Ca2+]i the total single channel open probability (NPo) increased with depolarisation. This voltage dependence was not seen at higher values of [Ca2+]i. The plot of NPovs.[Ca2+]i yielded Ca2+ affinity constants of 8 and 250 nm and Hill slopes of 1.3 and 2.3 at +100 and −100 mV, respectively. The distribution of open times was fitted by two exponentials of about 5 and 30 ms, which were neither voltage nor Ca2+ dependent. Replacement of external Cl− by I− shifted the reversal potential by about −30 mV and lengthened the longer of the two mean open times without significant effects on other kinetic parameters. Based on these data, a model for the activation of Ca2+-activated Cl− channels is proposed.
Ca2+-activated Cl− channels are expressed in many types of smooth muscle including vascular, respiratory, intestinal and urogenital myocytes. Since the Cl− equilibrium potential (-20 to −30 mV) in smooth muscle cells is much more positive than the resting membrane potential, Ca2+-activated Cl− currents (ICl(Ca)) represent a powerful depolarising stimulus in smooth muscle. Therefore, it has been proposed that the physiological role of ICl(Ca) is to depolarise smooth muscle and increase the opening of voltage-gated Ca2+ channels to produce contraction (Large & Wang, 1996). There is now substantial evidence in several smooth muscle preparations to show that ICl(Ca) mediates the contraction evoked by agonists that stimulate G-protein-coupled receptors by releasing Ca2+ ions from internal stores (for reviews see Large & Wang, 1996; Greenwood & Large, 1999; Large et al. 2002).
In addition, it has been proposed that ICl(Ca) may contribute to depolarising pacemaker mechanisms in spontaneously active smooth muscle preparations such as guinea-pig and sheep lymphatic smooth muscle (Van Helden, 1993; Toland et al. 2000), guinea-pig and rabbit urethra (Hashitani & Edwards, 1999; Sergeant et al. 2000) and guinea-pig antrum (Hirst et al. 2002). With regard to spontaneous activity, it is likely that the ICl(Ca) originates in specialised pacemaker cells similar to the interstitial cells of Cajal rather than smooth muscle myocytes.
Despite the prominence of this conductance, little is known about the biophysical properties of the single channel, since most of the information on ICl(Ca) has been obtained from studies on the macroscopic whole-cell current. Early work described single channel currents with a unitary conductance of 2.8 pS in freshly dispersed human mesenteric artery (Klöckner, 1993), 1.8 pS in cultured A7r5 cells (Van Renterghem & Lazdunski, 1993) and 1.8 pS in mouse and rabbit aortic myocytes (Hirakawa et al. 1999). However, our knowledge of these channels is scant, partly because of the small amplitude of these currents, but also because there was rapid ‘run-down’ of channel activity. The ‘run-down’ observed probably occurred because rather large Ca2+ concentrations (10 µm to 2 mm) were used to activate these currents. However, this problem can be overcome if smaller Ca2+ concentrations are applied to the cytoplasmic surface of the membrane, as indicated by Hirakawa et al. (1999).
In the present work we have carried out experiments to study the properties of single Ca2+-activated Cl− channels in cell-attached and excised inside-out and outside-out patches of rabbit pulmonary artery. Large Ca2+-activated Cl− channel currents can be evoked in rabbit pulmonary artery myocytes by the addition of Ca2+ to the pipette solution in the whole-cell recording configuration (Greenwood et al. 2001; Piper et al. 2002). In this preparation with physiological Ca2+ concentrations, it was possible to record channel activity for many minutes, which enabled a systematic analysis of the effects of Ca2+ concentration and voltage on the properties of these channels. A preliminary account of this work has already been presented to the Physiological Society (Piper & Large, 2001).
METHODS
Preparation of pulmonary artery smooth muscle myocytes
All experiments were performed on freshly dispersed rabbit pulmonary artery smooth muscle myocytes. New Zealand white rabbits of either gender were killed with an overdose of sodium pentobarbitone, injected via an ear vein, as approved under Schedule 1 of the UK Animals (Scientific Procedures) Act 1986, and the pulmonary artery was excised. The artery was dissected free of fat and connective tissue and single smooth muscle cells were isolated by acute or overnight treatment with papain, as described previously (Wang & Large, 1993). Briefly, strips of tissue (2–3 mm wide by 10 mm long) were placed in a solution containing (mm): NaCl 110, KCl 5, MgCl2 2, CaCl2 0.05, Hepes 5, glucose 10, NaHCO3 10, KH2 PO4 and taurine 10 (pH adjusted to 7.0 with NaOH). When cells were prepared on the same day, papain (2 mg ml−1), bovine serum albumin (5 mg ml−1) and dithiothreitol (1 mm) were added and the tissue strips were incubated at 37 °C for 15–20 min. For an overnight dissociation, papain (0.5 mg ml−1), bovine serum albumin (2 mg ml−1) and dithiothreitol (1 mm) were added and the tissue stored at 4 °C for 12–14 h. The next morning the tissue strips were incubated at 37 °C for 5–10 min. After acute or overnight enzyme treatment, single cells were isolated by trituration with a fire-polished wide-bore pipette. Drops of the resultant cell suspension were placed on glass coverslips and stored at 4 °C for up to 4–6 h prior to an experiment.
Solutions
In order to record single ICa(Cl) in the cell-attached recording mode, cells were perfused with a solution of the following composition (mm): NaCl 126, MgCl2 1.2, CaCl2 1.5, Hepes 10 and glucose 11 (pH adjusted to 7.2 with NaOH). The K+ channel blocker TEA (10 mm) and the Ca2+ channel inhibitor nicardipine (5 µm) were also added to the external solution. For cell-attached recordings carried out in the absence of external Ca2+, the solution contained (mm): NaCl 126, MgCl2 1.2, Hepes 10, EGTA 0.1 and glucose 11 (pH adjusted to 7.2 with NaOH). The pipette solution for cell-attached patches contained (mm): N-methyl-d-glucamine Cl− (NMDG Cl; prepared by equimolar addition of NMDG and HCl) 126, MgCl2 1.2, CaCl2 10 and Hepes 10 (pH adjusted to 7.2 with NMDG or HCl as appropriate). In some experiments, I− replaced Cl− in the pipette solution. As it was not possible to obtain NMDG I, this pipette solution had the following composition (mm): choline iodide 126, CaCl2 10, MgCl2 1.2 and Hepes 10. The K+ channel blockers TEA (10 mm) and 4-aminopyridine (4-AP, 10 mm) were also added to the pipette solution used for all cell-attached patches in order to block any K+ channels present. In order to determine the resting membrane potential of rabbit isolated pulmonary artery myocytes, whole-cell experiments were performed using current-clamp mode with the NaCl-based bathing solution described above and the following pipette solution (mm): KCl 126, MgCl2 1.2, Hepes 10 and EGTA 0.2 (pH adjusted to 7.2 with KOH).
For recordings from excised inside-out patches, symmetrical NMDG Cl solutions were used. The pipette solution was identical to the NMDG Cl-based pipette solution used for cell-attached patches, while the external solution contained (mm): NMDG Cl 126, MgCl2 1.2, EGTA 0.1 and MgATP 1 (pH adjusted to 7.2 with NMDG or HCl as appropriate). Both the external and pipette solutions contained TEA (10 mm) and 4-AP (10 mm). Varying amounts of CaCl2 (27, 41, 64 or 78 µm) were added to the pipette solution in order to buffer free Ca2+ to 50, 100, 250, 500 or 1 µm, respectively (calculated using Eqcal for Windows). When extremely low Ca2+ concentrations were used (≈ 1 or 10 nm), the concentration of EGTA was raised to 1 mm and the amount of CaCl2 required (65 or 256 µm) was calculated as above.
For the experiments utilising excised outside-out membrane patches to record single Ca2+-activated Cl− channel currents, the pipette solution had the following composition (mm): NMDG Cl 126, Hepes 10, MgCl2 1.2, EGTA 0.1 and Mg ATP 1 (pH adjusted to 7.2 with NMDG or HCl). CaCl2 at either 27 or 78 µm was added to the pipette solution in order to buffer free Ca2+ to either 50 or 500 nm, respectively (calculated using Eqcal for Windows). The external face of the outside-out patches was bathed with a solution containing (mm): choline chloride or choline iodide 126, CaCl2 1.5, MgCl2 1.2 and Hepes 10 (pH adjusted to 7.2 with HCl). TEA (10 mm) and 4-AP (10 mm) were also added to both the pipette and the external solution in these experiments.
Changes in liquid junction potential were minimised by the use of a 150 mm KCl-agar bridge connecting the recording chamber and a side bath containing the intracellular solution.
Papain, bovine serum albumin, dithiothreitol, Hepes, NMDG, choline chloride, choline iodide, EGTA, TEA, 4-AP and nicardipine were all supplied by Sigma Aldrich.
Electrophysiological recording
All experiments were carried out at room temperature (20–25 °C). Pipettes were pulled from borosilicate glass capillaries and then heat polished. To improve the signal to noise ratio, pipettes with a tip resistance of 15–20 MΩ were coated with Sylgard (Dow Corning, Michigan, USA) or dipped in Sigmacote (Sigma). The patch membrane potential was generated and single channel currents were recorded using a HEKA EPC8 patch-clamp amplifier (HEKA Elektronic, Lambrecht, Germany), and stored on DAT tapes.
Analysis
Current records were low-pass filtered off-line at 250–100 Hz and digitised at 1–5 kHz. For generation of all-points histograms, data were low-pass filtered at 100 Hz; data were also filtered at this frequency for the generation of figures. Analysis of channel openings and shuttings to provide a channel events list was carried out using CED analysis software (Cambridge Electronic Design, Cambridge, UK), using a 50 % threshold-crossing analysis. For this analysis, current records were filtered at 250 Hz whenever possible, to give a minimum time resolution of around 2.6 ms (twice the filter rise time, Tr). The current thresholds used for analysis were determined from Gaussian distributions fitted to the all-points histograms. In patches where the single channels exhibited a mixture of full and subconductance current levels (see later), the 50 % threshold for analysis was set for the larger conductance level. As the amplitude of subconductance current level was more than 50 % of the main level, the majority of subconductance openings were detected under these conditions. For each patch, the total single channel open probability (NPo) was calculated as follows:
where n = number of channels in the patch (1, 2, 3…), On = time spent at the open level for each channel (i.e. 1-n) and T = total recording time.
The relationship between NPo and [Ca2+]i for inside-out patches was fitted by the Hill equation:
where ymax = maximum NPo, Kd is the apparent dissociation constant and nH is the Hill coefficient.
In order to generate open time and closed time distributions, channel events were grouped into 2.5 or 5 ms bins, respectively, and the resultant distributions were fitted by exponential functions using Microcal Origin software (Microcal Software Inc., Northampton, MA, USA).
RESULTS
Properties of single Ca2+-activated Cl− channel currents recorded in cell-attached patches
In the first set of experiments we studied Cl− channels in cell-attached patches, as in these conditions the intracellular milieu is not disturbed. The resting membrane potential of rabbit pulmonary artery smooth muscle cells, determined by current-clamp recording with K+-containing solutions in the conventional whole-cell configuration (ECl = 0 mV), was −30 ± 3 mV (n = 20). Channel currents were not observed at the resting membrane potential (patch potential of 0 mV), but spontaneous channel currents were usually recorded when potentials of between −120 and +120 mV were imposed upon the patch. When spontaneous openings were not recorded (in 26 % of cell-attached patches), channel openings could also be evoked by increasing [Ca2+]i by the addition of caffeine (1–10 mm) to the bathing solution (Fig. 1A) or by raising extracellular Ca2+ to 10 mm. Also, removal of external Ca2+ by perfusion of the cells with a Ca2+-free external solution (see Methods) led to an attenuation of channel activity after a delay of 1–2 min, which was reversed when Ca2+ was reintroduced to the external solution (n = 3). These results indicate that the channels recorded in these conditions were Ca2+-activated. Channel activity was well maintained, and did not appear to run down during the period of recording (up to 60 min, mean = 29 ± 3 min, n = 17). Many patches appeared to contain more than one channel, as indicated by multiple openings at some, or all of the voltages studied (e.g. see Fig. 1A). When a Cl−-containing pipette solution was used, the I-V relationship appeared to be linear and reversed around the cell resting membrane potential (i.e. with no additional potential imposed upon the patch; for example see Fig. 1A and Fig. 2B). The mean overall unitary conductance of the spontaneously active channel currents, as estimated by the slope of the I-V curve, was 2.4 ± 0.2 pS (n = 6), although individual values ranged between 1.6 and 3.1 pS. The mean slope conductance of the single channel currents elicited by 10 mm caffeine was similar (2.3 ± 0.1 pS, n = 5).
Figure 1. Single Ca2+-activated Cl− channel currents recorded in a cell-attached patch.

A, current recorded at patch potentials between +80 mV and −80 mV at rest, and 1–5 min after caffeine (5 mm) was applied to the cell. Continuous lines represent the closed channel current level (c), while the dotted lines denote the open channel level for up to four active channels. B, trace of spontaneous single channel currents recorded from a second cell-attached patch with a patch potential of −80 mV. The continuous line represents the closed channel level (c), while the dotted lines represent a channel subconductance level (s) and full conductance level (f). In this and subsequent figures, the current traces have been reversed such that inward currents appear as a downward deflection and outward currents as an upward deflection.
Figure 2. Single Ca2+-activated Cl− channel currents recorded in a cell-attached patch in the presence of external I−.

A, currents recorded at patch potentials between +80 mV and −80 mV when I − (choline iodide) replaced Cl− in the pipette solution. Continuous lines represent the closed channel level (c), while the dotted line represents the open channel current level. B, mean single channel current-voltage (I-V) curve in the presence of external Cl− (▪; n = 6) and external I− (○n = 7). The points have been fitted by a straight line and the slope gives an estimated mean conductance of 2.4 pS with both Cl− and I − pipette solutions. Data are presented as means ± s.e.m.
A subconductance state in cell-attached patches
A notable feature was that careful inspection of individual records and all-points histograms revealed two distinct conductance levels (Fig. 1B). There was a large conductance level of 3.4 ± 0.1 pS recorded in the majority of patches (five out of six), which we have termed the full conductance state (f), and a subconductance level, s, of 1.9 ± 0.1 pS, which was significantly smaller than the full conductance state (P < 0.001). The subconductance state was present in all patches and the overall mean conductance (≈ 2–2.5 pS) resulted from a mixture of the full and subconductance states; the latter seemed to predominate in the cell-attached experiments.
Properties of single Ca2+-activated Cl− channel currents recorded in the presence of external I− ions in cell-attached patches
When Cl− was replaced by I− in the pipette solution, the reversal potential (Er) of the single channel currents was shifted and outward currents were recorded at zero patch potential (Fig. 2A). The mean Er was altered by around −30 mV (Fig. 2B) from −8 ± 1 (n = 6) to −37 ± 3 (n = 7), confirming that the single channels recorded were permeable to anions. External I− did not change the overall mean value of the unitary conductance (2.3 ± 0.3 pS, n = 7) and both full and subconductance openings were recorded with I− in the pipette solution. While the I-V curve recorded with Cl− pipette solution appeared to be linear over the entire voltage range tested, in the presence of external I−, the I-V curve showed slight inward rectification at very positive potentials (more positive than +40 mV) with a reduction of the slope conductance. This phenomenon was also noted with outside-out patches (see later), suggesting that it is a characteristic of I− ions.
Voltage dependence of single Ca2+-activated Cl− channel NPo in cell-attached patches
The NPo of spontaneously active channel currents recorded in cell-attached patches from cells bathed in 1.5 mm Ca2+-containing external solution was voltage dependent and was increased at depolarised compared to hyperpolarised patch potentials. For example, NPo at −80 mV was 0.23 ± 0.10 (n = 11) compared to 0.86 ± 0.35 at +80 mV (n = 7; P < 0.05). This resulted in an increase in the frequency of multiple channel openings (e.g. see Fig. 1A). Similar results were obtained when an I−-containing pipette solution was used (NPo at −120 mV was 0.10 ± 0.04, n = 6, compared to 0.87 ± 0.43, n = 7, at +80 mV; P < 0.05).
Properties of single Ca2+-activated Cl− channel currents recorded in inside-out patches
A problem with cell-attached recording is that [Ca2+]i is not known and, moreover, it may change throughout the recording period. Since one of the main aims of the present experiments was to study the dependence of the Cl− channel currents on [Ca2+]i, we carried out experiments with inside-out patches where [Ca2+]i is known. In this series of experiments, inside-out patches were excised directly into a single [Ca2+]i of 10 nm to 1 µm.
Data obtained from some typical experiments are shown in Fig. 3. When [Ca2+]i was ≈ 1 nm, no single channel currents could be recorded at potentials ranging from −150 to ± 150 mV (n = 4), but channel currents could be activated in these patches by increasing [Ca2+]i. With 10 nm [Ca2+]i, single channel currents were recorded only at positive membrane potentials. Assuming a linear I-V relationship that reversed at the Cl− equilibrium potential (ECl = 0 mV), the conductance of these channels was 3.7 ± 0.4 pS (n = 4). One of the four patches contained a channel that opened to a subconductance level of 2 pS in magnitude, but subconductance channel currents could not be discerned in the other patches.
Figure 3. Single Ca2+-activated Cl− channel currents recorded in inside-out patches.

A, trace of a single channel current recorded at +100 mV and −100 mV from an inside-out patch with 50 nm [Ca2+]i. The continuous line denotes the closed channel level (c), while the dotted line represents the open channel level. B, single Ca2+-activated Cl− channel currents recorded with 250 nm [Ca2+]i at +100 mV and −100 mV. As in A, the continuous line represents the closed channel level (c), while the dotted lines represent the channel subconductance and full conductance current level. C, a section of trace indicated in B is shown at a greater gain. The continuous line denotes the closed channel current level, while dotted lines through the trace show the single channel subconductance and full conductance current level (1.8 and 3.4 pS, respectively). D, single channel currents recorded at +100 and −100 mV from an inside-out patch with 1 µm [Ca2+]i. E, sections of the trace in D are shown at a greater gain. The continuous line represents the closed channel current level, while dotted lines through the trace denote the single channel subconductance level as well as a second smaller subconductance level (1.8 and 1.2 pS, respectively). F, the overall mean single channel I-V curve with 50 nm [Ca2+]i (□; n = 8), 250 nm [Ca2+]i (•; n = 10) and 1 µm [Ca2+]i (▴; n = 7). For each value of [Ca2+]i, the points were fitted by a straight line, the slope of which gives an estimated conductance of 3.0, 2.4 and 1.5 pS with 50 nm, 250 nm and 1 µm [Ca2+]i, respectively.
With 50 nm [Ca2+]i (Fig. 3A) channel activity did not run down significantly over the period of recording (11 ± 1 min; n = 8). As with cell-attached patches, when measuring all events it was found that the single channel I-V curve was linear and, as expected for a Cl− conductance, reversed around 0 mV, the ECl (Fig. 3F). The mean overall single channel conductance estimated from the slope of the I-V curve was 3.0 ± 0.3 pS (n = 8). However, it was evident that two conductance levels contributed to the overall mean value and these channel currents had a similar magnitude to the full and subconductance levels recorded in cell-attached patches (3.2 ± 0.3 pS, 1.8 ± 0.2 pS, n = 8).
When [Ca2+]i was increased, the single channel I-V curve remained linear, but the overall mean unitary conductance decreased. Figure 3B shows a trace of current recorded from an inside-out patch exposed to a solution containing 250 nm Ca2+. All single channel currents in patches exposed to this [Ca2+]i displayed openings to both sub- and full conductance levels, as indicated by the two dotted lines on the trace, and on an expanded scale in Fig. 3C. The I-V curve was linear, reversed at around 0 mV, and the overall mean single channel conductance (including full and subconductance levels) as estimated from the slope of the I-V curve, was 2.4 ± 0.2 pS (n = 10; Fig. 3F). The amplitude of the subconductance and full conductance current levels were not significantly different from those recorded in 50 nm [Ca2+]i (1.8 ± 0.04 and 3.6 ± 0.2 pA, respectively; n = 10, P > 0.05). When [Ca2+]i was 500 nm, the overall mean single channel conductance was 1.6 ± 0.2 pS (n = 10). A second subconductance level (shown in Fig. 3D) became more noticeable with 500 nm [Ca2+]i and was present in 60 % of patches. The mean amplitude of this second conductance level was 1.2 ± 0.05 pS (n = 6).
The highest [Ca2+]i applied to inside-out patches in this study was 1 µm, and Fig. 3D shows a typical trace of one such experiment. The overall single channel I-V curve under these conditions was linear, again reversing at around 0 mV. The overall mean single channel conductance was 1.5 ± 0.1 pS (n = 7; P < 0.01 when compared to 50 nm [Ca2+]i; Fig. 3F). Of the seven patches tested, four contained openings to the small amplitude current level described above for 500 nm [Ca2+]i (mean = 1.2 ± 0.1 pS, n = 4; Fig. 3E). Therefore, with 1 µm [Ca2+]i there were two conductance levels of Cl− channels, but these were the 1.8 pS and 1.2 pS states; no full conductance (i.e. ≈ 3.5 pS) channel currents were observed in 1 µm [Ca2+]i.
In general, single channel current activity was well maintained in inside-out patches. When [Ca2+]i was ≤ 250 nm, significant run-down of single channel currents did not occur for recording periods of up to 20 min (e.g. for 250 nm [Ca2+]i the mean was 14 ± 2 min; n = 10). As [Ca2+]i was raised, Ca2+-dependent run-down was more apparent, but even with 1 µm [Ca2+]i, the mean recording time before NPo was measurably reduced was 8 ± 1 min (n = 7).
Analysis of full and subconductance states
The above data show that when [Ca2+]i was increased, the mean overall unitary conductance of the channel currents decreased. However it was apparent that the Cl− channels had three subconductance states (≈ 3.5, 1.8 and 1.2 pS), and in low [Ca2+]i (≤ 250 nm), only the 3.5 and 1.8 pS levels were resolved. In high [Ca2+]i (≥ 500 nm) only the 1.8 and 1.2 pS currents were recorded. Therefore, it is possible that increasing [Ca2+]i altered the equilibrium between full and subconductance states, which resulted in differences in the mean overall conductance values obtained at different values of [Ca2+]i.
In order to test the hypothesis that raising [Ca2+]i increased the frequency of subconductance openings, a number of inside-out patches were exposed to several different values of [Ca2+]i ranging from 50 to 500 nm. For simplicity, we analysed only the 3.5 and 1.8 pS conductance states. The 1.2 pS level was present in 500 nm [Ca2+]i but was most prevalent in 1.0 µm [Ca2+]i. The results of these experiments are shown in Fig. 4. Figure 4Aa shows a trace of single channel current activated by 50 nm Ca2+ recorded from an inside-out patch held at +100 mV, where it can be seen that the channel opens primarily to a 0.27 pA level. From the amplitude histogram, it can be seen that in addition to a large peak, representing the closed state, there was a peak in observation frequency with a mean of 0.27 pA (Fig. 4Ab), which represents single channel openings to the full conductance level (≈2.8 pS) in this patch. A few channel transitions to the subconductance state were present in this patch, but there were not enough observations to give a clearly defined peak. Figure 4Ba shows a trace of single channel current recorded from the same inside-out patch at +100 mV when [Ca2+]i was raised to 500 nm, where it can be seen that the channel opened to two levels of 0.16 and 0.27 pA. The all-points histogram (Fig. 4Bb) exhibits three clear peaks, the first representing the closed channel current level, while the second peak had a mean of 0.16 pA, corresponding to a unitary conductance of 1.7 pS, which represents the subconductance level. A second peak with a mean amplitude of 0.27 pA, corresponding to the full conductance state, was observed in 500 nm [Ca2+]i (Fig. 4Bb). Therefore, an increase in [Ca2+]i produced fewer channel openings to the full conductance level, but more openings to the subconductance value. The single Ca2+-activated Cl− channels in these patches opened to a mean subconductance level of 1.8 ± 0.2 pS, while the full conductance amplitude was 3.2 ± 0.3 pS (n = 4). To test this hypothesis quantitatively, Fig. 4C shows the mean data obtained from different inside-out patches at a holding potential of +100 mV. In order to construct the bar chart shown in Fig. 4C, the number of observations within 0.05 pA either side of the peak for the mean single full or subconductance level recorded in each patch as a percentage of the total number of observations identified as single channel openings was plotted for each value of [Ca2+]i. It can be seen from Fig. 4C that with 50 nm [Ca2+]i there are significantly more openings to the full conductance than the subconductance state. However, with 250 and 500 nm [Ca2+]i, there were more openings to the subconductance than the full conductance level. In addition, the ratio of subconductance to full conductance openings, which was 2.5 at 250 nm [Ca2+]i, was significantly smaller than the ratio of 15 at 500 nm [Ca2+]i. Similar results were obtained at −100 mV (data not shown). Overall, comparing data obtained with 50 and 500 nm [Ca2+]i, there was a significant increase in the frequency of openings recorded to the subconductance state (P < 0.01) and a corresponding decrease in the frequency of openings to the full conductance level (P < 0.05).
Figure 4. Effect of [Ca2+]i on the proportion of full and subconductance openings of single Ca2+-activated Cl− channels in inside-out patches.

Aa, a trace of single channel current recorded at +100 mV with 50 nm [Ca2+]i. The continuous line represents the closed channel level (c), while the dotted line denotes the full conductance level (f). Shown in Ab is an all-points histogram taken from the current trace shown in a. The bin width is 0.01 pA and the data were fitted by the sum of two Gaussian curves, with means of 0 and 0.27 pA. Ba, a trace recorded when the same patch was exposed to 500 nm [Ca2+]i. The continuous line denotes the closed channel level (c), while the dotted lines represent the channel subconductance (s) and full conductance levels (f). Shown in Bb is an all-points histogram taken from the current trace shown in a. The data were fitted by the sum of three Gaussian curves, with means of 0, 0.16 and 0.27 pA; the bin width is 0.01 pA. C, bar chart showing the percentage of subconductance (sub) and full conductance (full) channel openings at +100 mV for [Ca2+]i between 50 nm and 500 nm. Data are presented as means ± s.e.m., n = 8-10. **P < 0.01 and ***P < 0.001, unpaired t test.
Effect of Ca2+ and voltage on NPo of single Ca2+-activated Cl−channel currents in inside-out patches
As described above with cell-attached patches, the NPo value of single Ca2+-activated Cl− channels in inside-out patches was voltage dependent and was higher at positive compared to negative membrane voltages at low [Ca2+]i. Figure 5A shows a histogram of NPo against activating Ca2+ concentration for inside-out patches at −100 and +100 mV. With 10 nm [Ca2+]i, NPo was highly voltage dependent. At −100 mV, NPo was extremely low, as no single channel currents were observed during recording periods of up to 3 min, while at +100 mV, NPo was 0.81 ± 0.20 (n = 4). At 50 nm [Ca2+]i, NPo was increased but was still voltage dependent, thus with 50 nm [Ca2+]i, NPo at −100 mV was 0.2 ± 0.03 (n = 8) compared to 1.28 ± 0.29 at +100 mV (n = 6, P < 0.01). However, as [Ca2+]i was increased to 500 nm, NPo was no longer voltage dependent (Fig. 5A). Moreover, at higher values of [Ca2+]i (1 µm Ca2+), the voltage dependence was reversed, with a NPo value at −100 mV of 1.16 ± 0.17 (n = 5) compared to 0.50 ± 0.20 at +100 mV (n = 7, P < 0.05).
Figure 5. Ca2+- and voltage dependence of Ca2+-activated Cl− channels in inside-out patches.

A, total single channel open probability (NPo) at +100 and −100 mV for values of [Ca2+]i between 10 nm and 1 µm. B, plot of NPovs.[Ca2+]i at patch potentials between +100 mV and −100 mV. Data at each voltage were fitted by the Hill equation to give the apparent dissociation constant (Kd) and the Hill coefficient (nH). C, Kd values obtained from B plotted against patch potential. D, plot of nH values from B vs. patch potential. The data points in both C and D were fitted by a straight line. Data are presented as the means ± s.e.m., n = 4-10. *P < 0.05, **P < 0.01 and ***P < 0.001; unpaired t test.
Figure 5B shows a plot of NPo against [Ca2+]i for a range of voltages from −100 to +100 mV, and for each voltage the data could be fitted by the Hill equation (see Methods). As can be seen in Fig. 5A, at +100 mV the total single channel NPo reached a maximum of around 1.3 at 250 nm [Ca2+]i, then decreased as [Ca2+]i was raised further. For the purposes of curve-fitting in Fig. 5B, at +100 mV and +50 mV, NPo values for [Ca2+]i≥ 500 nm were omitted. There was a progressive decrease in the apparent dissociation constant (Kd) for Ca2+ binding as the membrane potential became more depolarised, and this relationship could be fitted by a straight line (Fig. 5C). The Kd values were 250 and 8 nm at −100 mV and +100 mV, respectively. This indicates that the affinity of Ca2+ binding to Ca2+-activated Cl− channels was voltage dependent. The Hill coefficient was also voltage dependent and decreased in a linear manner from 2.3 at −100 mV to 1.3 at +100 mV (Fig. 5D), indicating that between one and three Ca2+ ions may bind in order to open Ca2+-activated Cl− channels.
Properties of Ca2+-activated Cl−channels recorded in outside-out membrane patches
We have shown that Ca2+-activated Cl− channels open to more than one conductance level and it was important to ascertain whether these are different states of the same channel or several different channels. To test this we measured the change in Er when replacing external Cl− with I− in outside-out patches. These experiments were carried out with 50 and 500 nm [Ca2+]i, where the proportion of 1.8 and 3.5 pS channel states varied markedly. Almost all of the patches studied at each Ca2+ concentration contained more than one channel, and indeed up to eight different current levels could be discerned in some recordings. With both 50 and 500 nm Ca2+ in the pipette solution, the single channel I-V curve was linear and reversed at around 0 mV in symmetrical Cl− concentrations (50 nm [Ca2+]i: 2 ± 2 mV, n = 6; 500 nm [Ca2+]i: 0 ± 2 mV, n = 6).
When the mean overall single channel conductance was calculated from the slope of the I-V curve, there was no significant difference in the amplitude of the overall mean conductance activated by 50 nm Ca2+ in outside-out and inside-out patches: 3.4 ± 0.8 (n = 6) and 3.0 ± 0.3 pS (n = 8, P > 0.1), respectively. When the pipette solution contained 500 nm Ca2+, the mean overall single channel amplitude was significantly less than that recorded with 50 nm Ca2+ (1.9 ± 0.1 pS, n = 6; P < 0.05), but there was no significant difference in the single channel conductance amplitude compared to inside-out patches (1.6 ± 0.2 pS, n = 10, P > 0.1). When NMDG Cl in the external solution was replaced by choline I, the reversal potential of the single channel I-V curve was shifted by −30 ± 2 mV (n = 5) with 50 nm Ca2+ and by −31 ± 4 mV (n = 5) with 500 nm Ca2+. The similar shift in Er produced by I− with 50 nm and 500 nm [Ca2+]i suggests that two conductance states of the same channel are present. As with cell-attached patches, the single channel I-V curve displayed inward rectification at positive membrane potentials in the presence of external I−. With both 50 nm and 500 nm Ca2+ in the pipette solution, the conductance of the inward current at potentials more negative than −30 mV (outward movement of Cl− ions) was significantly greater than the outward current (inward movement of I− ions; e.g. 50 nm Ca2+: inward conductance (between −30 mV and −100 mV) = 3.2 ± 0.2 pS, outward conductance (between −30 mV and +100 mV) = 1.4 ± 0.2 pS, n = 5, P < 0.05; 500 nm Ca2+: inward conductance = 1.7 ± 0.2 pS, outward conductance = 1.1 ± 0.3 pS, n = 5, P < 0.05).
Because of the large number of channels in each outside-out patch, reliable estimates of NPo were difficult to calculate. In addition, as there was a high incidence of multiple openings, analysis of channel open and closed times was not attempted with this patch configuration.
Open time distribution for Ca2+-activated Cl−channels in inside-out patches
Analyses of channel open time distributions were studied in inside-out patches containing only single openings, or at least few multiple openings that could be edited. Figure 6A and B shows open time histograms and sections of current traces from single Cl− channels activated by 50 nm Ca2+ at −100 mV and +100 mV. With 50 nm [Ca2+]i, the recordings contained a high proportion of channel openings to the full conductance level of around 3.2 pS. At both voltages, the open time distributions could be described by the sum of two exponentials with time constants of about 7 and 30 ms. Thus the mean open times at −100 mV and +100 mV were 6 ± 1 ms and 30 ± 5 ms (n = 7) and 6 ± 1 and 28 ± 5 ms (n = 5), respectively. Similar results were obtained with 500 nm [Ca2+]i; the data from one patch are shown in Fig. 6C and D. Even though the single Ca2+-activated Cl− channels in these patches with 500 nm [Ca2+]i displayed mostly openings to the subconductance current levels (around 1.8 pS), open time histograms could also be fitted by the sum of two exponential functions with similar time constants (e.g. mean open times at −100 and +100 mV were 7 ± 1 ms and 35 ± 5 ms, n = 9, and 4 ± 1 and 27 ± 4 ms, n = 6, respectively). When [Ca2+]i was raised to 1 µm, the open time distributions could again be described by the sum of two exponential functions with time constants of 4 ± 1 and 30 ± 5 ms (n = 6) at −100 mV, and 6 ± 1 and 38 ± 8 ms (n = 5) at +100 mV. Under these conditions, channel openings to the full conductance level were not recorded and only subconductance openings to either the 1.2 or 1.8 pS level were present. Therefore, the open time distribution is neither Ca2+- nor voltage dependent.
Figure 6. Open time distributions of Ca2+-activated Cl− channel currents in inside-out patches.

A and B, single channel current open time distribution recorded at −100 and +100 mV, respectively, with 50 nm [Ca2+]i. The data could be fitted by the sum of two exponential functions with time constants, t1 and t2, of about 7 and 30 ms, respectively. Inset are sections of current traces that were used to compute the open time histogram. C and D, the single channel current open time distributions from a another inside-out patch at −100 and +100 mV, respectively, with 500 nm [Ca2+]i. The data were fitted by the sum of two exponential functions with time constants, t1 and t2, of about 6 and 34–39 ms, respectively. Insets are sections of the current traces that were used to compute the open time histogram. In A-D the bin width is 2.5 ms and, for each of the current trace insets in A-D, the continuous line denotes the closed channel level (c), while the dotted lines represent the single channel subconductance and full conductance current levels.
Open time distribution of Ca2+-activated Cl−channels in cell-attached patches: effect of external I−
With cell-attached recording it was also found that the distribution of open times could be fitted by the sum of two exponential functions (Fig. 7A and B) at all voltages tested. For spontaneously active channels at a patch potential of −80 mV the mean open times were 4 ± 1 and 33 ± 10 ms (n = 8), while at +80 mV the mean open times were 7 ± 1 and 36 ± 8 ms (n = 8; P > 0.1). Comparable values for the two mean open times were obtained when channels were activated by bathing the cells in a solution containing 1–10 mm caffeine (-80 mV: mean open times were 6 ± 1 and 28 ± 3 ms, n = 6; +80 mV: mean open times were 3 ± 1 and 31 ± 9 ms, n = 7). When choline iodide replaced NMDG Cl in the pipette solution (i.e. on the external face of the channels) the distribution of channel open times could still be fitted by the sum of two exponential functions. In the presence of external I−, the longer of the two mean open times at −120 mV was significantly increased at negative patch potentials (8 ± 1 and 64 ± 2 ms, n = 4; Fig. 7C) compared to channel currents recorded with a Cl− pipette solution (P < 0.01). At positive patch potentials there was no significant difference in Cl− channel mean open time when I− replaced Cl− in the pipette solution (e.g. at +80 mV mean open times were 7 ± 2 and 26 ± 10 ms, n = 4; Fig. 7D; P > 0.05).
Figure 7. Effect of external I− on open time distributions for Ca2+-activated Cl− channel currents in cell-attached patches.
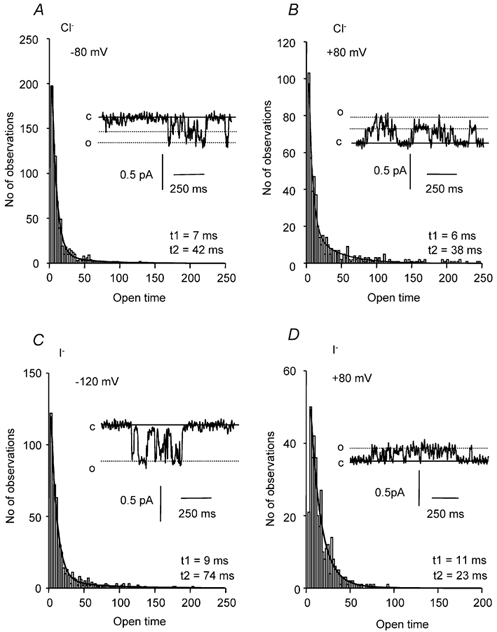
A and B, single channel current open time distribution recorded at −80 and +80 mV with a Cl−-containing pipette solution. The data could be fitted by the sum of two exponential functions with time constants, t1 and t2, of about 7 and 38–42 ms, respectively. Insets are sections of the current traces that were used to compute the open time histogram. C, the single channel current open time distribution from a cell-attached patch at −120 mV recorded with an I−-containing pipette solution. The data were fitted by the sum of two exponential functions with time constants, t1 and t2, of 9 and 74 ms, respectively. The inset is a section of the current trace that was used to compute the open time histogram. D, single channel current open time distribution from the same cell-attached patch at +80 mV. The data could be fitted by the sum of two exponential functions with time constants, t1 and t2, of 11 and 23 ms, respectively. In A-D the bin width is 2.5 ms and for each of the current trace insets in A-D, the continuous line denotes the closed channel level (c), while the dotted lines represent the open levels of the single channel subconductance and full conductance current states.
Closed time distribution of Ca2+-activated Cl−channels in inside-out patches
The closed time distribution of Ca2+-activated Cl− channels was analysed in a similar manner to the channel open times. Figure 8A and B shows closed time distributions from a single Ca2+-activated Cl− channel in one patch bathed in a solution containing 100 nm [Ca2+]i at −100 and +100 mV, which could be fitted by the sum of three exponential functions. This suggests that Ca2+-activated Cl− channels have at least three closed states. For around 30 % (17/51) of patches, the closed time distribution was fitted well by a two-component exponential function. In general, these were patches in which the Po of the Ca2+-activated Cl− channel was very high. The values of the time constants derived from the closed time distributions showed considerable scatter (e.g. with 250 nm Ca2+ the mean closed times were 6 ± 2, 19 ± 8 and 121 ± 18 ms (n = 5) at −100 mV compared to 6 ± 1, 20 ± 7 and 82 ± 12 ms (n = 6) at +100 mV).
Figure 8. Closed time distributions of Ca2+-activated Cl− channel currents in inside-out patches.

A, single channel current closed time distribution recorded at −100 mV with 100 nm [Ca2+]i. The data could be fitted by the sum of three exponential functions with time constants, t1, t2 and t3, of 3, 15 and 112 ms, respectively. B, single channel current open time distribution from the same patch as A at +100 mV. The closed times could be fitted by the sum of three exponential functions, with time constants, t1, t2 and t3, of 3, 42 and 115 ms, respectively. The bin width in both A and B is 5 ms.
In addition, [Ca2+]i did not appear to affect the length of the mean closed times; with 50 nm Ca2+ the mean closed times at −100 mV were 4 ± 1, 10 ± 3 and 89 ± 13 ms (n = 4), while with 500 nm Ca2+ the mean closed times at +100 mV were 2 ± 1, 13 ± 3 and 88 ± 20 ms (n = 5). However, as mentioned above, channels with a high Po often displayed two, not three mean closed times. This occurred more frequently when [Ca2+]i was greater than 250 nm. Since patches often contained more than one channel, the actual values of closed times should be treated with caution, especially when Po was high. Nevertheless, since in the majority of patches the distribution of closed times could be fitted by three exponentials, we believe that this reflects the presence of at least three closed states.
From the inspection of individual current traces it did appear that openings of Ca2+-activated Cl− channels tended to occur in bursts, but conventional burst duration analysis was not possible in this study because the mean closed times differed only by about one order of magnitude.
DISCUSSION
In the present work we have studied the properties of Ca2+-activated Cl− channels in cell-attached and excised inside-out and outside-out patches from freshly dispersed rabbit pulmonary artery myocytes. With this preparation it was possible to record single channel events without appreciable run-down, which enabled the systematic investigation of the effect of [Ca2+]i and membrane potential on the channel characteristics.
Multiple conductance states of Cl− channels
The experiments demonstrated clearly that the Ca2+-activated Cl− channel had three conductance states of about 3.5, 1.8 and 1.2 pS. In inside-out patches with 50 nm [Ca2+]i, channels opened mainly to the 3.5 pS level, although there was a significant number of 1.8 pS events. In 500 nm [Ca2+]i, the 1.8 pS conductance level was dominant, but the 3.5 pS and 1.2 pS states were observed. In 1 µm [Ca2+]i there were no openings to the 3.5 pS level and only 1.8 and 1.2 pS channel currents were recorded. These results show that increasing [Ca2+]i reduced the unitary conductance of the Cl− channel, and the overall mean conductance values obtained depended on the proportion of the three conductance levels. Moreover, increasing [Ca2+]i favoured channel opening to the lower conductance states.
The different states were recorded with cell-attached patch recording, indicating that the different substates were not a result of patch excision. It should be noted that there were few 1.2 pS events with cell-attached recording, presumably because the resting [Ca2+]i was low. Since the change in Er with external I− in outside-out patches was similar for both 50 nm [Ca2+]i, when the 3.5 pS conductance was dominant, and 500 nm [Ca2+]i, when most openings occurred to the 1.8 pS level, the data suggest that these are indeed different subconductances of the same channel rather than different channel proteins. Also, while clearly defined openings to either full or subconductance levels did occur, examination of individual current traces showed that when the channel was open, transitions could be made from the subconductance to the full conductance level (e.g. see Fig. 3E and Fig. 7B for examples).
In cultured A7r5 smooth muscle cells, Van Renterghem & Lazdunski (1993) reported a value for the conductance of Ca2+-activated Cl− channels of 1.8 pS, and in a small fraction of patches a channel conductance of 1.3 pS was observed. However, in that study 2 mm [Ca2+]i was used to activate the channels. In another smooth muscle preparation, human mesenteric artery, the estimated conductance of Ca2+-activated Cl− channels was 2.8 pS, but high values of [Ca2+]i of between 1 and 10 µm were used to activate the channel currents. The relatively high [Ca2+]i values that were used may explain why the 3.5 pS conductance state was not observed in these studies. However, it seems likely that the same conductance states are present in these different smooth muscle preparations.
It is possible to state more clearly that the conductance of Ca2+-activated Cl− channels in guinea-pig hepatocytes (Koumi et al. 1995) and cultured calf pulmonary artery endothelial cells (Nilius et al. 1997a) is significantly larger (7–8 pS) than that found in smooth muscle, indicating a different molecular entity. It should be noted that in mouse and canine ventricular myocytes the estimated Ca2+-activated Cl− single channel conductance was 1.0–1.3 pS but, again, high values of [Ca2+]i (1 µm-1 mm) were used to activate the currents (Collier et al. 1996; Xu et al. 2002).
Ca2+sensitivity of the Cl− channel
The Ca2+ sensitivity of the Ca2+-activated Cl− channels examined in this study was estimated by plotting NPovs.[Ca2+]i, which showed that the affinity of Ca2+ for the channels was highly voltage dependent, with Kd values of 250 and 8 nm at −100 mV and +100 mV, respectively. An increase in binding affinity for Ca2+ with depolarisation has been observed in previous studies in several preparations (Arreola et al. 1996; Nilius et al. 1997b; Kuruma & Hartzell, 2000). It is important to note that the Ca2+-activated Cl− channel cannot be opened by depolarisation when [Ca2+]i is low (i.e. binding of Ca2+ opens the channel, but the affinity of Ca2+ is increased by depolarisation). Thus the voltage dependence of Kd suggests that the binding site for Ca2+ is within the membrane electric field, presumably in the channel pore.
An interesting comparison is that in rabbit aortic myocytes, Cl− channel activity was not observed with a [Ca2+]i of 100 nm, and concentrations ≥ 200 nm were required to activate Cl− channels (Hirakawa et al. 1999). In our experiments at −50 mV, the Kd of Ca2+ ions was 100–200 nm, suggesting a much greater sensitivity in pulmonary compared to aortic smooth muscle cells. Since the resting [Ca2+]i in smooth muscle is considered to be about 100 nm, our data suggest that a significant number of Cl− channels are open at the resting membrane potential of about −50 to −60 mV in rabbit pulmonary artery (Casteels et al. 1977). This hypothesis is supported by the observation that replacement of external Cl− by the more permeant anion thiocyanate produced a significant outward current at the holding potential of −50 mV using perforated-patch recording in rabbit pulmonary artery myocytes (Hogg et al. 1994b). It has been shown in intact preparations of guinea-pig urethra (Hashitani & Edwards, 1999) and opossum lower oesophageal sphincter (Zhang et al. 2000) that the relatively selective blocker of Ca2+-activated Cl− channels niflumic acid hyperpolarises the resting membrane potential and/or reduces basal tone, suggesting that these channels contribute to the resting membrane conductance/tone in those preparations. In addition, the activation of Ca2+-activated Cl− channels is likely to be an important mediator of the depolarisation caused by agonists that increase [Ca2+]i. For example, noradrenaline produces an increase in [Ca2+]i in rat pulmonary artery myocytes (Wang et al. 1997) via the release of Ca2+ from internal stores in addition to the influx of Ca2+ through receptor-operated Ca2+ channels (Large, 2002), which will lead to activation of ICl(Ca).
The Hill slopes derived from the NPovs.[Ca2+]i plots were 2.3 and 1.3 at −100 mV and +100 mV, respectively. These data indicate that whereas binding of one Ca2+ ion can produce channel opening, especially at positive potentials and low [Ca2+]i, normally two or three Ca2+ ions are required for channel opening. Obviously this implies that the channel protein possesses at least three Ca2+ binding sites.
Kinetic properties of single Ca2+-activated Cl− channels
The distribution of open times was fitted by two exponentials with time constants of about 5 ms and 30 ms. These values were not altered by either changing [Ca2+]i between 50 nm and 1 µm or by changing the voltage between −100 mV and +100 mV. In human mesenteric artery a mean open time of 28 ms was obtained (Klöckner, 1993) and in A7r5 cultured cells two mean open times of 3.0 and 39 ms were estimated (Van Renterghem & Lazdunski, 1993). Overall these data are in fairly good agreement with the values described in this paper.
The closed time distributions were usually fitted by three exponentials with time constants of about 5, 50 and 100 ms. There was a greater variability in these latter values, and in some cells it was not always possible to distinguish clearly the 50 ms component, but nevertheless we feel that these data reflect at least three closed states of the Cl− channel. Because of the small amplitude of the single channel events, the degree of low-pass filtering was necessarily high, and transitions faster than 2–3 ms will not have been resolved. The closed times were also not affected by [Ca2+]i or voltage. Van Renterghem & Lazdunski (1993) reported two mean closed times of about 8 and 160 ms in cultured aortic cells, which are of the same order as the values obtained in the present work.
Spontaneous transient inward currents (STICs) are ICl(Ca) produced by the sporadic release of Ca2+‘sparks’ from the sarcoplasmic reticulum (Wang et al. 1992; Jaggar et al. 2000). It has been shown previously, in rabbit pulmonary myocytes, that STICs decay monoexponentially and that the time constant of decay is increased by depolarisation (Hogg et al. 1994b). It was suggested that STIC decay was determined by channel kinetics and that the decay time constant equated to the mean open time (Hogg et al. 1994a, b). The present data show that this is not the case. Whereas both the STIC decay time constant and the longer of the two mean open times were doubled by external I− (Greenwood & Large, 1999 and present work), the present results show that the channel mean open and closed times are not voltage dependent, in contrast to the STIC τ value (Hogg et al. 1994a, b). Therefore, the lengthening of the STIC decay time course produced by depolarisation is caused either by a depolarisation-induced slowing of the decay of the Ca2+‘spark’ and/or increased affinity of Ca2+ for the Cl− channel.
Scheme for activation of Cl− channels
Previously proposed models for activation of Ca2+-activated Cl− channels have been based on data obtained from macroscopic currents recorded with whole-cell configuration or from excised patches (Arreola et al. 1996; Kuruma & Hartzell, 2000). Therefore it was of interest to compare the present data on single channels with the results from the earlier studies. The model we favour is similar to that of Kuruma & Hartzell (2000), but with some important differences. The proposed scheme is:

where C and O represent closed and open states, respectively. We have identified three conductance levels, and the channel is opened by the binding of Ca2+ and not by depolarisation. Moreover, increasing [Ca2+]i reduced the unitary conductance. Therefore, it is possible that O1, O2 and O3 correspond to the 3.5, 1.8 and 1.2 pS conductance states, respectively. We have suggested there are at least three binding sites on the channel protein, and the voltage dependence of Kd indicates that these sites are in the channel pore itself within the membrane field. Therefore, binding of Ca2+ ions to its sites may impede the flow of Cl− ions through the channel, and hence as more Ca2+ ions are bound, the unitary conductance is reduced. Thus, a Cl− channel with three Ca2+ ions bound has a lower conductance than a channel with a single Ca2+ ion (e.g. 1.2 pS vs. 3.5 pS).
The results of kinetic studies have inferred the existence of three closed states, whereas four are implicated in the above scheme. However, the filtering limitations may have prevented the resolution of a fourth closed state, as channel events shorter than about 3 ms could not be accurately resolved. The distributions of open and closed times were the same with all [Ca2+]i and potentials studied. This indicates that the channel kinetics are the same (i.e. the channel can exist in two open conformations with mean lifetimes of about 5 and 30 ms) whether one or three Ca2+ ions cause opening at any potential. If this is the case, the transition rate constants (α and β) between C1, C2 and C3 and their respective open states, are similar. An essential characteristic of these channels is that once opened, the probability of opening is voltage dependent with low [Ca2+]i, and therefore it is necessary to identify the voltage-dependent rate constant(s). With 50 nm [Ca2+]i when the voltage dependence of NPo is marked, the ratio of 3.5 to 1.8 pS channels was similar at −100 mV and +100 mV, which indicates that transitions between C1 and C2 are not voltage dependent. Therefore, it can be concluded that the voltage dependence resides in the transition between C0 and C1 (i.e. K1 and/or K-1), and that depolarisation reduces the transition rate between C1 and C0 (i.e. the dissociation of Ca2+ from the channel).
Acknowledgments
This work was supported by the Wellcome Trust.
REFERENCES
- Arreola J, Melvin JE, Begenisich T. Activation of calcium-dependent chloride channels in rat parotid acinar cells. J Gen Physiol. 1996;108:35–47. doi: 10.1085/jgp.108.1.35. [DOI] [PMC free article] [PubMed] [Google Scholar]
- Casteels R, Kitamura DV, Kuriyama H, Suzuki H. The membrane properties of the smooth muscle cells of the rabbit main pulmonary artery. J Physiol. 1977;271:41–61. doi: 10.1113/jphysiol.1977.sp011989. [DOI] [PMC free article] [PubMed] [Google Scholar]
- Collier ML, Levesque PC, Kenyon JL, Hume JR. Unitary Cl− channels activated by cytoplasmic Ca2+ in canine ventricular myocytes. Circ Res. 1996;78:936–944. doi: 10.1161/01.res.78.5.936. [DOI] [PubMed] [Google Scholar]
- Greenwood IA, Large WA. Modulation of the decay of Ca2+-activated Cl− currents in rabbit portal vein smooth muscle cells by external anions. J Physiol. 1999;516:365–376. doi: 10.1111/j.1469-7793.1999.0365v.x. [DOI] [PMC free article] [PubMed] [Google Scholar]
- Greenwood IA, Ledoux J, Leblanc N. Differential regulation of Ca2+-activated Cl− currents in rabbit arterial and portal vein smooth muscle cells by Ca2+-calmodulin-dependent kinase. J Physiol. 2001;534:395–408. doi: 10.1111/j.1469-7793.2001.00395.x. [DOI] [PMC free article] [PubMed] [Google Scholar]
- Hashitani H, Edwards FR. Spontaneous and neurally activated depolarisations in smooth muscle cells of the guinea-pig urethra. J Physiol. 1999;514:459–470. doi: 10.1111/j.1469-7793.1999.459ae.x. [DOI] [PMC free article] [PubMed] [Google Scholar]
- Hirakawa Y, Gericke M, Cohen RA, Bolotina VM. Ca2+-dependent Cl− channels in mouse and rabbit aortic smooth muscle cells: regulation by intracellular Ca2+ and NO. Am J Physiol Cell Physiol. 1999;277:H1732–1744. doi: 10.1152/ajpheart.1999.277.5.H1732. [DOI] [PubMed] [Google Scholar]
- Hirst GDS, Bramich NJ, Teramoto N, Suzuki H, Edwards FR. Regenerative component of slow waves in the guinea-pig antrum involves a delayed increase in [Ca2+]i and Cl− channels. J Physiol. 2002;540:907–919. doi: 10.1113/jphysiol.2001.014803. [DOI] [PMC free article] [PubMed] [Google Scholar]
- Hogg RC, Wang Q, Large WA. Effects of Cl channel blockers on Ca-activated chloride and potassium currents in smooth muscle cells from rabbit portal vein. B J Pharmacol. 1994a;111:1333–1341. doi: 10.1111/j.1476-5381.1994.tb14891.x. [DOI] [PMC free article] [PubMed] [Google Scholar]
- Hogg RC, Wang Q, Large WA. Action of niflumic acid on evoked and spontaneous calcium-activated chloride and potassium currents in smooth muscle cells from rabbit portal vein. Br J Pharmacol. 1994b;112:977–984. doi: 10.1111/j.1476-5381.1994.tb13177.x. [DOI] [PMC free article] [PubMed] [Google Scholar]
- Jaggar JH, Porter VA, Lederer WJ, Nelson MT. Calcium sparks in smooth muscle. Am J Physiol Cell Physiol. 2000;278:C235–256. doi: 10.1152/ajpcell.2000.278.2.C235. [DOI] [PubMed] [Google Scholar]
- Klöckner U. Intracellular calcium ions activate a low-conductance chloride channel in smooth muscle cells isolated from human mesenteric artery. Pflugers Arch. 1993;424:231–237. doi: 10.1007/BF00384347. [DOI] [PubMed] [Google Scholar]
- Koumi S, Sato R, Aramaki T. Activation of the plasma membrane chloride channel by protein kinase C in isolated guinea-pig hepatocytes. J Physiol. 1995;487:379–394. doi: 10.1113/jphysiol.1995.sp020887. [DOI] [PMC free article] [PubMed] [Google Scholar]
- Kuruma A, Hartzell HC. Bimodal control of a Ca2+-activated Cl− channel by different Ca2+ signals. J Gen Physiol. 2000;115:59–80. doi: 10.1085/jgp.115.1.59. [DOI] [PMC free article] [PubMed] [Google Scholar]
- Large WA. Receptor operated Ca2+ -permeable non-selective cation channels in vascular smooth muscle: A Physiologic Perspective. J Cardiovasc Physiol. 2002;13:493–501. doi: 10.1046/j.1540-8167.2002.00493.x. [DOI] [PubMed] [Google Scholar]
- Large WA, Greenwood IA, Piper AS. Recent advances on the properties and role of Ca2+-activated chloride currents in smooth muscle. In: Fuller CM, editor. Current Topics in Membranes. Vol. 53. San Diego, CA: Academic; 2002. pp. 95–114. [Google Scholar]
- Large WA, Wang Q. Characteristics and physiological role of the Ca2+-activated Cl− conductance in smooth muscle. Am J Physiol. 1996;268:C435–454. doi: 10.1152/ajpcell.1996.271.2.C435. [DOI] [PubMed] [Google Scholar]
- Nilius B, Prenen J, Szücs G, Wei L, Tanzi F, Voëts T, Droogmans G. Calcium-activated chloride channels in bovine pulmonary artery endothelial cells. J Physiol. 1997a;498:381–396. doi: 10.1113/jphysiol.1997.sp021865. [DOI] [PMC free article] [PubMed] [Google Scholar]
- Nilius B, Prenen J, Voëts T, Van Den Bremt K, Eggermont J, Droogmans G. Kinetic and pharmacological properties of the calcium-activated chloride-current in macrovascular endothelial cells. Cell Calcium. 1997b;22:53–63. doi: 10.1016/s0143-4160(97)90089-0. [DOI] [PubMed] [Google Scholar]
- Piper AS, Greenwood IA, Large WA. Dual effect of blocking agents on Ca2+-activated Cl− currents in rabbit pulmonary artery smooth muscle cells. J Physiol. 2002;539:119–131. doi: 10.1113/jphysiol.2001.013270. [DOI] [PMC free article] [PubMed] [Google Scholar]
- Piper AS, Large WA. Single Ca2+-activated Cl− channels in rabbit isolated pulmonary artery smooth muscle cells. J Physiol. 2001;531:83P. [Google Scholar]
- Sergeant GP, Hollywood MA, McCloskey KD, Thornbury KD, McHale NG. Specialised pacemaking cells of rabbit urethra. J Physiol. 2000;526:359–366. doi: 10.1111/j.1469-7793.2000.t01-2-00359.x. [DOI] [PMC free article] [PubMed] [Google Scholar]
- Toland HM, McCloskey KD, Thornbury KD, McHale NG, Hollywood MA. Ca2+-activated Cl− current in sheep lymphatic smooth muscle. Am J Physiol Cell Physiol. 2000;279:C1327–1335. doi: 10.1152/ajpcell.2000.279.5.C1327. [DOI] [PubMed] [Google Scholar]
- Van Helden DF. Pacemaker potentials in lymphatic smooth muscle of the guinea-pig mesentery. J Physiol. 1993;471:465–479. doi: 10.1113/jphysiol.1993.sp019910. [DOI] [PMC free article] [PubMed] [Google Scholar]
- Van Renterghem C, Lazdunski M. Endothelin and vasopressin activate low conductance chloride channels in aortic smooth muscle cells. Pflugers Arch. 1993;425:156–163. doi: 10.1007/BF00374516. [DOI] [PubMed] [Google Scholar]
- Wang Q, Hogg RC, Large WA. Properties of spontaneous inward currents recorded in smooth muscle cells isolated from the rabbit portal vein. J Physiol. 1992;451:525–537. doi: 10.1113/jphysiol.1992.sp019177. [DOI] [PMC free article] [PubMed] [Google Scholar]
- Wang Q, Large WA. Action of histamine on single smooth muscle cells dispersed from the rabbit pulmonary artery. J Physiol. 1993;468:125–139. doi: 10.1113/jphysiol.1993.sp019763. [DOI] [PMC free article] [PubMed] [Google Scholar]
- Wang Q, Wang YX, Yu M, Kotlikoff MI. Ca2+-activated Cl− channels are activated by metabolic inhibition in rat pulmonary artery smooth muscle cells. Am J Physiol. 1997;273:520–530. doi: 10.1152/ajpcell.1997.273.2.C520. [DOI] [PubMed] [Google Scholar]
- Xu YM, Dong PH, Ahmmed GU, Chiamvimonvat N. Presence of a calcium-activated chloride current in mouse ventricular myocytes. Am J Physiol Heart Circ Physiol. 2002;283:H302–314. doi: 10.1152/ajpheart.00044.2002. [DOI] [PubMed] [Google Scholar]
- Zhang Y, Miller DV, Paterson WG. Opposing roles of K+ and Cl− channels in maintenance of opossum lower esophageal sphincter tone. Am J Physiol Gastrointest Liver Physiol. 2000;279:G1226–1234. doi: 10.1152/ajpgi.2000.279.6.G1226. [DOI] [PubMed] [Google Scholar]