

Abstract
Contrary to intuitive expectations, overexpression of sarco-endoplasmic reticulum (ER) Ca2+ ATPases (SERCAs) in Xenopus oocytes leads to a decrease in the period and an increase in the amplitude of intracellular Ca2+ waves. Here we examine these experimental findings by modeling Ca2+ release using a modified Othmer-Tang-model. An increase in the period and a reduction in the amplitude of Ca2+ wave activity are obtained when increases in SERCA density are simulated while keeping all other parameters of the model constant. However, Ca2+ wave period can be reduced and the wave amplitude and velocity can be significantly increased when an increase in the luminal ER Ca2+ concentration due to SERCA overexpression is incorporated into the model. Increased luminal Ca2+ occurs because increased SERCA activity lowers cytosolic Ca2+, which is partially replenished by Ca2+ influx across the plasma membrane. These simulations are supported by experimental data demonstrating higher luminal Ca2+ levels, decreased periods, increased amplitude, and increased velocity of Ca2+ waves in response to increased SERCA density.
INTRODUCTION
The nonlinear exchange of Ca2+ between the cytosol and the endoplasmic reticulum (ER) generates propagating waves of increased cytosolic Ca2+ concentration. Intracellular Ca2+ waves were first observed in medaka eggs (Ridgeway et al., 1977) and later in Xenopus oocytes (Fontanilla and Nuccitelli, 1998; Lechleiter et al., 1991), hepatocytes (Nathanson et al., 1994), articular chondrocytes (D'Andrea and Vittur, 1995), and cardiac myocytes (Hongo et al., 1995; Wussling and Salz, 1996). The excitable nature of Ca2+ wave activity was initially discovered and characterized by Lechleiter and co-workers (Jouaville et al., 1995; Lechleiter et al., 1991; Lechleiter and Clapham, 1992; Lechleiter et al., 1998). This experimental body of work has been paralleled by extensive mathematical modeling that has led to new insights into the underlying mechanisms of intracellular Ca2+ signaling (Dupont and Goldbeter, 1992, 1994; Dupont et al., 1996; Dupont, 1998; Sneyd and Sherratt, 1997; Sneyd et al., 1998, 2000; Wagner and Keizer, 1994; Wagner et al., 1998; Falcke et al., 1999a,b, 2000; Fink et al., 2000; Jafri and Keizer, 1995; Jafri, 1995).
Intracellular Ca2+ dynamics are fundamentally due to the release and uptake of Ca2+ from the ER. Ca2+ is released through two types of Ca2+ channels: the ryanodine receptor (RyR) and the inositol 1,4,5 trisphosphate receptor (IP3R) (Berridge et al., 1999; Bootman et al., 2001; Ehrlich 1995; Marks 1997; Mikoshiba, 1997). In this report, we have investigated Ca2+ release via IP3Rs, which are the only release channels expressed in Xenopus oocytes (Parys et al., 1994; Parys et al., 1992). The binding of IP3 to this channel is a prerequisite for release (Iino, 1990; Iino and Endo, 1992; Meyer et al., 1988; Parker and Ivorra, 1990; Parker and Yao, 1991; Watras et al., 1991). Released cytosolic Ca2+ exerts a rapid positive feedback on the IP3R channel by increasing the opening probability at low Ca2+ concentrations (Bezprozvanny et al., 1991; Finch et al., 1991a,b; Iino, 1990; Iino and Endo, 1992). This phenomenon is known as Ca2+ induced Ca2+ release (Fabiato and Fabiato, 1978). On the other hand, high Ca2+ concentrations slowly inhibit IP3R channel opening (Bezprozvanny et al., 1991; Finch et al., 1991a,b; Iino, 1990; Iino and Endo, 1992). Ca2+ is removed from the cytosol and returned into the ER by energy-dependent pumps known as sarco-endoplasmic reticulum ATPases (SERCAs). Mitochondrial Ca2+ handling also impacts cytosolic Ca2+ signaling (Jouaville et al., 1995). We previously incorporated mitochondrial Ca2+ signaling into an Othmer-Tang mathematical model of Ca2+ signaling and discovered an unexpected impact of mitochondrial Ca2+ efflux on Ca2+ release (Falcke et al., 1999a).
We initially investigated the importance of Ca2+ pump density by overexpressing SERCA1 and SERCA2b in Xenopus oocytes (Camacho and Lechleiter, 1993; Camacho and Lechleiter, 1995). SERCA2b has a smaller pump capacity and higher Ca2+ affinity than the other SERCA isoforms (Lytton et al., 1992). Surprisingly, increasing the Ca2+ pump density of either SERCA subtype decreased the period of IP3-mediated Ca2+ waves. Ca2+ wave amplitude was increased for both isoforms (Camacho and Lechleiter, 1993; Camacho and Lechleiter, 1995). No significant change in the velocity of Ca2+ waves was observed at low levels of SERCA1 overexpression (Camacho and Lechleiter, 1993). At high expression levels of SERCA2b, Ca2+ wave velocity was increased (Lechleiter et al., 1998). Previous mathematical models did not correctly predict the dependency of these Ca2+ wave parameters on SERCA expression levels (Jafri and Keizer, 1995; Dupont and Goldbeter, 1994). In particular, simulations indicated that wave amplitude and velocity decreased with increasing SERCA density whereas the wave period decreased only at high IP3 concentrations. In this report, we present a mathematical model that correctly predicts the experimental dependency of these Ca2+ wave parameters on the level of SERCA expression. The critical modification was to incorporate an experimental measurement of higher Ca2+ content in the ER in response to overexpression of SERCAs.
MATERIALS AND METHODS
Intracellular Ca2+ dynamics comprise exchange of cytosolic Ca2+ with the extracellular medium across the plasma membrane as well as uptake and release of Ca2+ by the ER and mitochondria. We define the total concentration of Ca2+ in the cell as CT = c + νmm + νrE. The variable c denotes the cytosolic Ca2+ concentration, m the mitochondrial concentration, and E the concentration in the ER. The parameters νm and νr are the effective volume fractions of mitochondria and ER, respectively (see Table 1). The mathematical description of intracellular Ca2+ dynamics is based on the Othmer-Tang model supplemented with an equation to describe mitochondrial dynamics (Falcke et al., 1999a; Tang et al., 1996). It consists of the following partial differential equations:
 |
(1) |
 |
(2) |
 |
(3) |
TABLE 1.
| Parameter | Value | Unit |
|---|---|---|
| Leak flux coefficient Pl | 0.00253 | s−1 |
| Channel flux coefficient Pc | 3.9637 | s−1 |
| Capacity of endogenous pumps Pmax | Varied | μM s−1 |
| Dissociation constant of endogenous pumps K | 0.08892 | μM |
| Capacity of additional pumps P1max | Varied | μM s−1 |
| Dissociation constant of additional pumps K1 | Varied | μM |
| Effective volume ratio νr = VER/Vcyt | 0.185 | |
| Effective volume ratio νm = Vm/Vcyt | 0.1 | |
| Effective diffusion coefficient D of Ca2+ | 40 | μm2 s−1 |
| Uniporter capacity Vmax(1) | 9.0 | μM s−1 |
| Uniporter half maximum value Kd | 4.5 | μM |
| Na+-Ca2+-exchanger capacity Vmax(2) | 9.0 | μM s−1 |
| Averaged total concentration of Ca2+CT | Varied | μM |
| Na+-Ca2+-exchanger half maximum value for Ca2+Km | 3.0 | μM |
| Na+-Ca2+-exchanger half maximum value for Na+KNa | 5.0 | mM |
| Cytosolic Na+ concentration Na | 10.0 | mM |
| β0(I) | 0.8 μM/I | |
| β1 | 0.36036 | μM |
| β2 | 0.29952 | μM |
| ɛ | 0.15 | s |
| Concentration of IP3I | Varied | μM |
Parameter values are listed in Table 1. The first right-hand-side term in Eq. 1 models Ca2+ diffusion in the cytosol. The second term describes Ca2+ release from the ER consisting of a part controlled by the fraction of inhibited channels (1 − n), the fraction of channels with activating Ca2+ and IP3 bound (c/(c + β1(1 + β0(I)))), and a leak flux (Pl). The Othmer-Tang-model assumes that the receptor channel has a binding site for IP3, an activating binding site for Ca2+, and an inhibiting binding site for Ca2+. The channel opens upon binding of IP3 and Ca2+ to the activating site. A second Ca2+ binding site provides for inhibition. If Ca2+ is bound to the inhibiting site, the channel remains closed. It is assumed that the dynamics of IP3 binding and dissociation and Ca2+ binding and dissociation at the activating site are much faster than processes involved in inhibition. These assumptions allow for derivation of the above expression for the fraction of channels with activating Ca2+ and IP3 bound (Tang et al, 1996).
The third and fourth terms model the uptake of Ca2+ into the ER by ATPases (see Lytton et al. (1992)). The term with Pmax describes endogenous pumps and the term with P1max describes the exogenously expressed SERCAs, which are different from endogenous pumps. Note that P1max is different from zero in the simulations presented in Fig. 6 only. The second line of Eq. 1 describes the contribution of mitochondria. The variable n is the fraction of inhibited channels. The n-dynamics are a relaxation to their equilibrium value set by cytosolic Ca2+ (Eq. 2). Equation 3 describes mitochondrial Ca2+ dynamics. Ca2+ uptake into mitochondria is due to a Ca2+ uniporter, which is given by the first term. Mitochondrial Ca2+ release is due to a Na+/Ca2+ exchanger and is described by the second term in Eq. 3. These terms are based on Gunter and Pfeiffer (1990). For further biophysical details see Falcke et al. (1999a) and Tang et al. (1996). We recently reported that Eqs. 1–3 reproduce the experimental findings for wave propagation in oocytes with energized mitochondria (Falcke et al., 1999a; Jouaville et al., 1995). Under these conditions, spiral waves cannot form whereas waves with less curvature still propagate. The surprising mathematical explanation for these wave patterns was a range of forbidden periods, which appears as a gap in the dispersion relation (Falcke et al., 2000).
FIGURE 6.

Characteristics of simulated spiral waves in dependence on pump strength of additionally expressed SERCAs with a dissociation constant K1 different from that one of the endogenous pumps. The parameter P1max indicates the degree of expression. Left panel: [IP3] = 0.3 μM and different dissociation constants K1: 0.112 μM (thick solid line); 0.136 μM (thick dashed line); 0.164 μM (thin solid line); 0.188 μM (thin dashed line). The resting level of free Ca2+ in the cytosol is 69.0 nM. Right panel: [IP3] = 0.08 μM and different dissociation constants K1: 0.112 μM (thick solid line); 0.124 μM (thick dashed line); 0.136 μM (thin solid line), 0.188 μM (thin dashed line). The resting level of free Ca2+ in the cytosol is 28.1 nM.
Overexpression of SERCAs was modeled by increasing Pmax or P1max, which are constants proportional to SERCA density. When Pmax or P1max is increased, uptake of Ca2+ by the ER increases. This raises the resting luminal content until the release from the ER balances uptake again. The resting cytosolic Ca2+ concentration was used to derive a mathematical expression to increase luminal Ca2+ content with SERCA overexpression. Resting Ca2+ concentrations are stationary solutions of the dynamics (Eqs. 1–3). In turn, these solutions can be used to determine the total concentration of Ca2+ corresponding to a certain degree of SERCA expression. Equating the right-hand-side of Eqs. 1–3 to 0 and solving for CT leads to:
 |
(4) |
with the index b indicating that the resting level values have to be used.
Xenopus oocyte protocols and confocal imaging of intracellular Ca2+
Oocytes were surgically removed from Xenopus frogs and manually defolliculated as previously described (Camacho and Lechleiter, 2000). Series of diluted synthetic SERCA2b mRNA concentrations (3.25, 6.5, 13, and 26 ng) were injected in a bolus of 50 nl. Ca2+ imaging experiments were performed at day 5 and 6 following expression. Fluorescent Ca2+ indicator, Oregon Green II (12.5 μM final) was injected half an hour before IP3. Ca2+ release was initiated by injection of IP3 (∼300 nM final). Note that during the five or six days of SERCA overexpression, oocytes were incubated in normal 1 mM extracellular Ca2+ containing media (OR-2). The oocytes were placed in zero extracellular Ca2+ only during the confocal imaging period. All images were acquired in a Nikon PCM2000 confocal microscope using a Nikon 10× objective (N.A. = 0.45) at zoom 1. Acquisition speed was 1.51 frames per second. Image resolution was 1.95 μm/pixel.
Resting cytosolic and luminal Ca2+ concentrations were determined using Fura-2 and Mag-Fura-2 AM, respectively. Oocytes were injected with H2O (control) or SERCA mRNA and allowed to express for five days. They were then injected with Fura-2 (∼10 μM final concentration) to estimate cytosolic Ca2+ or Mag-Fura-2 AM (∼10 μM final concentration) to measure the luminal ER Ca2+ concentration. Calibrations were performed in duplicate pools of 16 oocytes each for both cytosolic and luminal measurements on a spectrofluorometer (Fluoroskan Ascent FL, Labsystems, Boston, MA). Standard ratiometric calibrations were performed (Grynkiewicz et al., 1985). Kds of 0.225 μM (Molecular Probes, Eugene, OR) and 53 μM (Hofer et al., 1998) were used for Fura-2 and Mag-Fura-2, respectively.
RESULTS
The crucial assumption in modeling the experimental findings is an increase in luminal Ca2+ content due to increase in SERCA density occurring during the five days it takes SERCA mRNA to express. We measured the resting level of free Ca2+ in the oocyte cytosol and ER using the ratiometric Ca2+ indicators Fura-2 and Mag-Fura-2, respectively. Overexpression of SERCA led to an increase in the free ER luminal Ca2+ from 109 ± 32 μM to 171 ± 13 μM (n = 32). On the other hand, the resting concentration of cytosolic free Ca2+ decreased from 130 ± 9 nM to 86 ± 7 nM (n = 32). The luminal Ca2+ concentration proportionally increased by 57%, whereas the cytosolic concentration decreased by 33%. These data provided the basis for the assumption on luminal Ca2+ content made in the simulations. The resting Ca2+ concentration was not directly used in the Othmer-Tang model. However, a relative decrease in the resting cytosolic Ca2+ concentration with SERCA overexpression of 41.7% at high IP3 concentration and 32.7% at low IP3 concentration was included in our simulations.
Ca2+ wave activity was simulated with the model (Eqs. 1–3) whose parameters are presented in Table 1. To examine the dependence of Ca2+ wave patterns on SERCA density, we simulated spiral Ca2+ wave activity at increasing values of Pmax and varying resting Ca2+ concentrations (Figs. 1 and 2). Simulation results for wave velocity, amplitude, decay time, and periodicity are plotted for continually increasing SERCA densities (Pmax) in Fig. 2. Results represented by solid lines correspond to normal resting cytosolic Ca2+ and those represented by dashed lines correspond to a lower resting concentration. Specifically, increasing SERCA density experimentally corresponds to a change in parameters from a point with low Pmax and normal cytosolic Ca2+ (control oocytes) to a point with large Pmax and low cytosolic Ca2+ (SERCA overexpressing oocytes). These simulations clearly show that the period of Ca2+ waves decreases with the level of overexpression of SERCA pumps (Fig. 2). The spiral wave patterns also show a decrease in the width of individual Ca2+ waves, consistent with a faster decay of cytosolic Ca2+ (Figs. 1 and 2), whereas velocity and amplitude increase with increasing SERCA expression (Fig. 2). The same dependence of Ca2+ wave parameters on increasing Pmax was found at low and high IP3 concentrations (Fig. 2, left and right panels). The results in Fig. 2 show as well that Ca2+ wave velocity was less sensitive to changes in Pmax than period. That corresponds to a decrease in wavelength. These simulations are in agreement with data previously reported (Camacho and Lechleiter, 1993, 1995).
FIGURE 1.

Simulated spiral waves at different degrees of SERCA expression (top left: Pmax = 0.594 μMs−1; top right: Pmax = 1.194 μMs−1; bottom left: Pmax = 3.550 μMs−1; bottom right: Pmax = 5.394 μMs−1). The resting level of Ca2+ is 69.0 nM. The examples are on the solid lines in Fig. 2. The size of the area shown is 620 × 620 μm2.
FIGURE 2.

Characteristics of simulated spiral waves in dependence on pump strength Pmax. Left panel: [IP3] = 0.3 μM, resting level of free Ca2+ in the cytosol is 69.0 nM (solid line) and 40.2 nM (dashed line). Right panel: [IP3] = 0.08 μM, resting level of free Ca2+ in the cytosol is 32.4 nM (solid line) and 21.8 nM (dashed line). CT was calculated according to Eq.4. The curves in Figs. 2 and 6 are not smooth everywhere. The reason for the fluctuations is meandering of the spiral tip. Meandering is a motion of the spiral tip on a trajectory outlining a petal-like pattern and causes modulation of amplitude and period (Falcke et al., 1999b). The time T1/2 is the time for the Ca2+ concentration to decrease from the maximum to 50% of the maximum in the back of the pulse.
To experimentally examine the accuracy of our simulations, we reinvestigated Ca2+ wave activity in Xenopus oocytes at increasing levels of SERCA2b overexpression. SERCA2b mRNA was injected into Xenopus oocytes and allowed to express for five days as previously described (Camacho and Lechleiter, 2000). Injecting mRNA from 3.2 to 26 ng resulted in incremental expression levels of the pump as shown by Western blot analysis (Fig. 3). Densitometry measurements of the Western blot indicated that protein expression levels increased to ∼11.1-fold from control levels (1.0). Ca2+ wave activity was then initiated by a bolus injection of IP3 (300 nM final) and confocally imaged using the Ca2+ dye indicator Oregon Green II (Molecular Probes).
FIGURE 3.

Western blot of SERCA2b overexpressing oocytes. Oocyte lysates were prepared and run on 12% SDS PAGE. Following transfer, the membranes were probed with an anti-SERCA2 antibody (gift of J. Lytton). Lanes were loaded as follows: (a) endogenous SERCA2b (no mRNA control); (b) 3.25 ng; (c) 6.5 ng; (d) 13 ng; and (e) 26 ng. Normalizing the intensity relative to the endogenous control (0 ng mRNA) gives increases in relative protein levels of 1 (0 ng), 1.5 (3.2 ng), 6.3-fold (6.5 ng), 7.5-fold (13 ng), and 11.1-fold (26 ng).
Overexpression of SERCAs significantly decreased the period of Ca2+ wave activity as previously reported (Camacho and Lechleiter, 1993, 1995). The dependencies of Ca2+ wave period, peak amplitude, T1/2 (half-time of decay of individual waves) and velocity on SERCA density are plotted in Fig. 4. The average period between Ca2+ waves for each level of expression decreased 2.2-fold as the SERCA density increased from control to maximal expression (Fig. 4 A). A 1.8-fold decrease in the T1/2 and a 1.7-fold increase in peak wave amplitude were observed over the same increase in SERCA density (Fig. 4, B and C). Finally, we determined that the Ca2+ wave velocity increased by ∼1.9-fold.
FIGURE 4.
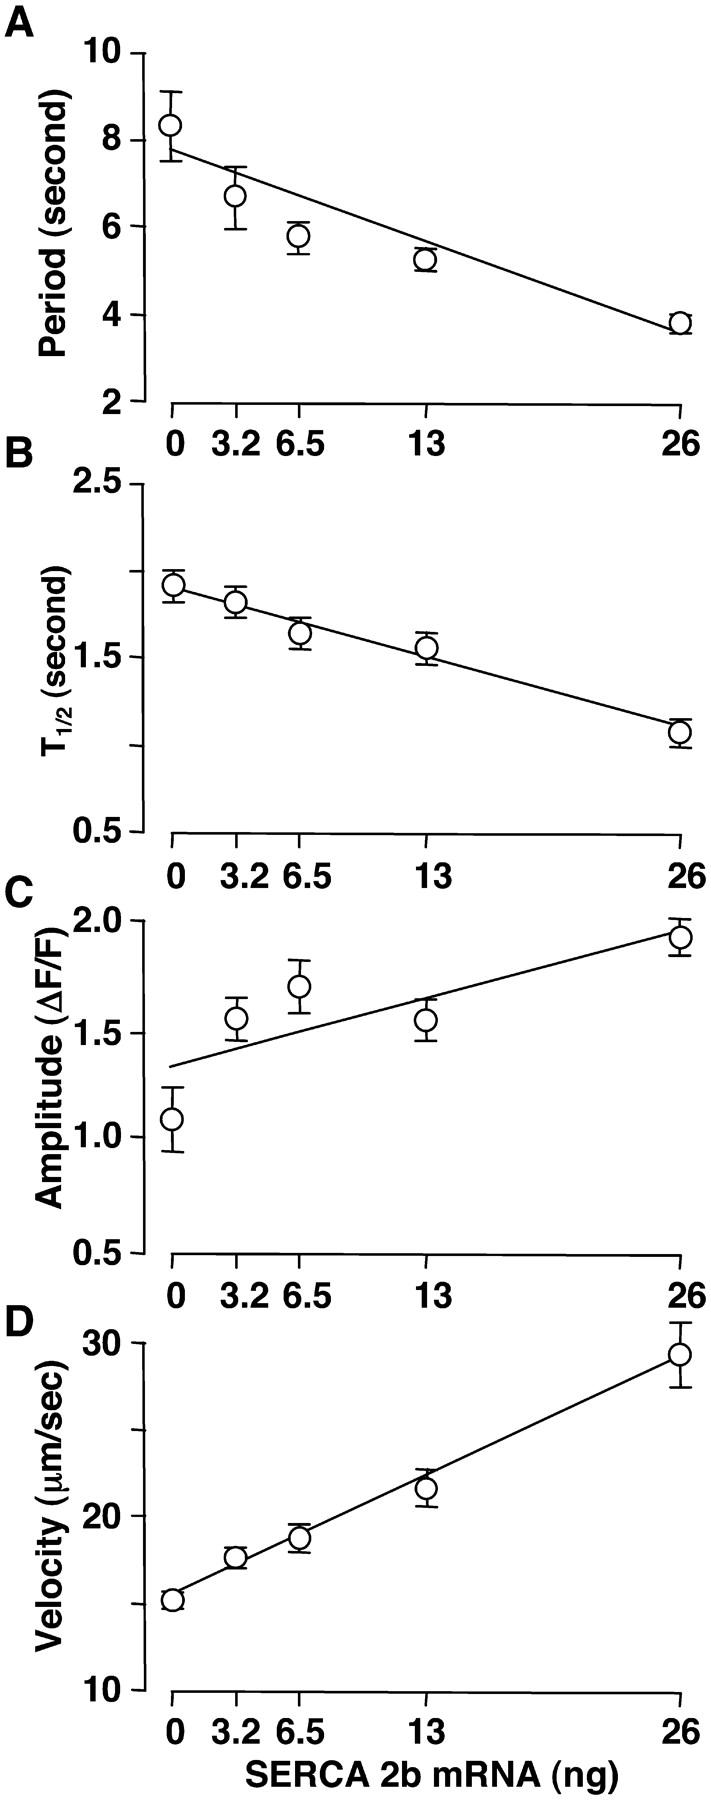
Dependence of Ca2+ wave period, T1/2, amplitude and velocity on SERCA2b density. Ca2+ wave parameters are plotted as mean ± SE.
Representative recordings of Ca2+ activity in oocytes injected with low (3.2 ng) and high (26 ng) concentrations of mRNA encoding SERCA are presented in Fig. 5. Ca2+ waves are of longer period and lower amplitude at low SERCA density, when compared to oocytes with high SERCA density. Note also that the Ca2+ wave amplitude decreases during a single recording (Fig. 5). This is likely due to the slow depletion of intracellular Ca2+ stores, because all recordings were carried out in zero extracellular Ca2+. Change in IP3 levels during the recording could also partially contribute to the decrease in Ca2+ wave activity although the turnover of IP3 in Xenopus oocytes is relatively slow (Allbritton et al., 1992; Sims and Allbritton, 1998). However, this contribution to changes in amplitude was shown to be much smaller than the changes seen in Fig. 5, A and B (Camacho and Lechleiter, 1993). Furthermore, only the highest level of SERCA expression consistently returned the interspike Ca2+ levels to near the resting concentration (Fig. 5 B). In Fig. 5, C and D, we have simulated the predicted decrease in wave amplitude when the oocytes are placed in zero extracellular Ca2+.
FIGURE 5.

Spatio-temporal plots of Ca2+ wave activity in zero extracellular Ca2+. Panels A and B show experimental results; panels C and D show simulations. Oocytes were injected with low (3.2 ng) (panel A) and high (26 ng) (panel B) concentrations of mRNA encoding SERCA. Representative wave patterns are shown next to the time series. The ΔF/F0 values were recorded at the spot marked in the wave pattern. Panels C and D show simulated spiral wave amplitudes recorded approximately one spiral revolution off the spiral core. The loss of Ca2+ through the plasma membrane was modeled by an exponential decay of CT. Panel C shows the low SERCA density case CT = 11.565 μM e−t/1000s, Pmax = 4.97 μMs−1, panel D shows results with high SERCA density CT = 141.35 μM e−t/500s, Pmax = 54.6 μMs−1. The base line of the simulated concentrations decreases from 69 nM to 27 nM in panel C and from 48 nM to 30 nM in panel D in the course of the simulation.
SERCA2b is the predominant SERCA isoform expressed in Xenopus oocytes. Overexpression of this pump corresponds simply to a change of SERCA density (Pmax). However, we have also reported that overexpression of SERCA2a and SERCA1 decrease Ca2+ wave period (Camacho and Lechleiter, 1993; John et al., 1998). Consequently, we simulated spiral waves for different dissociation constants (K1) corresponding to a range that includes the different SERCA isoforms. Simulations for high and low [IP3] are shown in Fig. 6. We found that period decreases and velocity and amplitude increase with increasing SERCA expression, if K1 is not too large. However, when K1 is increased beyond a critical value, the period begins to increase and velocity to decrease with additional increases in P1max (Fig. 6). This occurs between K1 = 0.136 μM and K1 = 0.164 μM at [IP3] = 0.3 μM and between K1 = 0.124 μM and K1 = 0.136 μM at [IP3] = 0.08 μM. Ca2+ pumps with a large dissociation constant are predicted to have almost no activity at resting concentrations of free Ca2+. As a result, store content is not increased and Ca2+ oscillations are not affected. Ca2+ pumping with large values of the dissociation constant becomes significant only after Ca2+ release. This increase in Ca2+ pump activity occurs without an increase in the maximal store content, which reduces the spread of excitation and stops wave propagation.
Together, these simulations correctly predict that overexpression of SERCA leads to an increase of velocity and amplitude and decrease of period not only for a single type of additionally expressed SERCAs but for different SERCA isoforms with a range of Ca2+ dissociation constants.
DISCUSSION
The experimental data presented above confirm that Ca2+ wave amplitude and velocity increase with the overexpression of SERCAs in Xenopus oocytes. On the other hand, Ca2+ wave period and half-time of decay (T1/2) of Ca2+ waves decrease. We were able to theoretically simulate these findings by incorporating into the model the experimental finding that increasing SERCA density increases luminal Ca2+ content. This increase, in turn, increases the positive feedback on Ca2+ wave dynamics. This theoretical model accounts for the experimental results at low and high IP3 concentration and for a range of resting Ca2+ concentrations and pump dissociation constants. Ca2+ wave amplitude and period were the most sensitive to increases in the Ca2+ content of the ER. In fact, raising only the SERCA density actually increased wave period and decreased velocity and amplitude. However, the magnitude of these negative changes was offset by the positive effect of increasing the concentration of Ca2+ in the ER lumen. Thus, the net effect of increasing SERCA density is increased Ca2+ wave amplitude and velocity and decreased period.
The increase in luminal Ca2+ content caused by overexpression of SERCA should not be precisely compared between simulations and experimental measurements. However, we can compare theoretical and experimental data for a relative increase in velocity caused by a relative increase in luminal calcium. The experimental luminal free Ca2+ increased by a factor of 1.57 while the velocity increased by a factor of 1.8 resulting in a ratio of 1.57/1.8 = 0.87. The corresponding theoretical ratio is 2.2 at low concentrations of IP3 and low resting concentration of cytosolic Ca2+ and 7.5 at high concentrations of IP3 and resting Ca2+. These values do not exceed an expected higher theoretical ratio because the model projects a three-dimensional experimental system onto a two-dimensional surface. We estimate that the original three-dimensional system will be greater than 2.5 times more sensitive to an increase in luminal calcium, because cytosolic concentration changes are localized close to the ER membrane and do not extend all the way to the plasma membrane as the projection from three onto two spatial dimensions implies (Wang and Thompson, 1995).
The underlying mechanism used to model increased SERCA density in this report is different from earlier theoretical work published on the same topic. Dupont et al. simulated waves with the two-pool model in a one-dimensional system (Dupont et al., 1991; Dupont and Goldbeter, 1989). A small area at one end of the system contained the IP3 sensitive pool and had the role of a wave-generating pacemaker. This area could be excitable, oscillatory, or may be in a high activity stationary state. Wave velocity and period were determined by the interaction of the pacemaker and its vicinity. Both wave parameters increase with increasing SERCA pumping in the excitable and oscillatory regime. If the IP3 sensitive pool is in a high activity stationary state, both parameters decrease with increased pumping. The two-pool model successfully predicted a decrease in wave period for high [IP3], but not for low [IP3]. This approach also could not account for the rise in wave amplitude with increased SERCA pumping.
The dependence of Ca2+ wave period on SERCA density was also theoretically investigated using the DeYoung-Keizer-model (Jafri and Keizer, 1995). Overexpression of SERCA1 was modeled by a second Ca2+ pump term with a dissociation constant of 0.4 μM, in addition to a term with 0.1 μM for SERCA2b. Using this approach, a decrease in the oscillation period with increasing expression of SERCA1 was successfully predicted, although the wave velocity was constant. In addition, these findings were only observed in the oscillatory regime of the system. When pumping was increased to push the system into the excitable regime, wave activity was abolished. The positive results in the oscillatory regime were also dependent on the introduction of a pump term with lower affinity for Ca2+ than the term used for the endogenous SERCA2b. Consequently, this approach could not account for experimental observations in which increased expression of SERCA2b also decreased Ca2+ wave period (Camacho and Lechleiter, 1995; John et al., 1998).
In conclusion, it is important to stress that simply increasing the maximum pump rate (Pmax) of the SERCA2b term does not correctly simulate the experimental findings. Increasing only Pmax decreased the amplitude and increased the period of Ca2+ waves. This is similar to the results of other theoretical approaches discussed in the previous paragraphs. The experimental findings are correctly reproduced, only if an increase in the Ca2+ content of the ER is permitted to occur in response to increased SERCA density.
References
- Allbritton, N. L., T. Meyer, and L. Stryer. 1992. Range of messenger action of calcium ion and inositol 1,4,5-trisphosphate. Science. 258:1812–1815. [DOI] [PubMed] [Google Scholar]
- Berridge, M., P. Lipp, and M. Bootman. 1999. Calcium signalling. Curr. Biol. 9:R157–R159. [DOI] [PubMed] [Google Scholar]
- Bezprozvanny, I., J. Watras, and B. E. Ehrlich. 1991. Bell-shaped calcium-response curves of Ins(1,4,5)P3- and calcium-gated channels from endoplasmic reticulum of cerebellum. Nature. 351:751–754. [DOI] [PubMed] [Google Scholar]
- Bootman, M. D., T. J. Collins, C. M. Peppiatt, L. S. Prothero, L. MacKenzie, P. De Smet, M. Travers, S. C. Tovey, J. T. Seo, M. J. Berridge, F. Ciccolini, and P. Lipp. 2001. Calcium signalling–an overview. Semin. Cell Dev. Biol. 12:3–10. [DOI] [PubMed] [Google Scholar]
- Camacho, P., and J. Lechleiter. 1993. Increased frequency of calcium waves in Xenopus laevis oocytes that express a calcium-ATPase. Science. 260:226–229. [DOI] [PubMed] [Google Scholar]
- Camacho, P., and J. D. Lechleiter. 1995. Calreticulin inhibits repetitive calcium waves. Cell. 82:765–771. [DOI] [PubMed] [Google Scholar]
- Camacho, P., and J. D. Lechleiter. 2000. Xenopus oocytes as a tool in calcium signaling research. In Calcium Signaling. J. Putney, editor. CRC Press, Boca Raton. 157–181.
- D'Andrea, P., and F. Vittur. 1995. Spatial and temporal Ca2+ signalling in articular chondrocytes. Biochem. Biophys. Res. Commun. 215:129–135. [DOI] [PubMed] [Google Scholar]
- Dupont, G., and A. Goldbeter. 1989. Theoretical insights into the origin of signal-induced calcium oscillations. In Cell to Cell Signalling: From Experiments to Theoretical Models. A. Goldbeter, editor. Academic Press Limited, London. 461–474.
- Dupont, G., M. J. Berridge, and A. Goldbeter. 1991. Signal-induced Ca2+ oscillations: properties of a model based on Ca2+-induced Ca2+ release. Cell Calcium. 12:73–85. [DOI] [PubMed] [Google Scholar]
- Dupont, G., and A. Goldbeter. 1992. Oscillations and waves of cytosolic calcium: insights from theoretical models. Bioessays. 14:485–493. [DOI] [PubMed] [Google Scholar]
- Dupont, G., and A. Goldbeter. 1994. Properties of intracellular Ca2+ waves generated by a model based on Ca2+-induced Ca2+ release. Biophys. J. 67:2191–2204. [DOI] [PMC free article] [PubMed] [Google Scholar]
- Dupont, G., J. Pontes, and A. Goldbeter. 1996. Modeling spiral Ca2+ waves in single cardiac cells: role of the spatial heterogeneity created by the nucleus. Am. J. Physiol. 271:C1390–C1399. [DOI] [PubMed] [Google Scholar]
- Dupont, G. 1998. Theoretical insights into the mechanism of spiral Ca2+ wave initiation in Xenopus oocytes. Am. J. Physiol. 44:C317–C322. [DOI] [PubMed] [Google Scholar]
- Ehrlich, B. E. 1995. Functional properties of intracellular calcium-release channels. Curr. Opin. Neurobiol. 5:304–309. [DOI] [PubMed] [Google Scholar]
- Fabiato, A., and F. Fabiato. 1978. Calcium-induced release of calcium from the sarcoplasmic reticulum of skinned cells from adult human, dog, cat, rabbit, rat, and frog hearts and from fetal and new-born rat ventricles. Ann. N. Y. Acad. Sci. 307:491–522. [DOI] [PubMed] [Google Scholar]
- Falcke, M., J. L. Hudson, P. Camacho, and J. D. Lechleiter. 1999a. Impact of mitochondrial Ca2+ cycling on pattern formation and stability. Biophys. J. 77:37–44. [DOI] [PMC free article] [PubMed] [Google Scholar]
- Falcke, M., M. Bär, J. D. Lechleiter, and J. L. Hudson. 1999b. Spiral breakup and defect dynamics in a model for intracellular Ca2+ dynamics. Physica D. 129:236–252. [Google Scholar]
- Falcke, M., M. Or-Guil, and M. Bär. 2000. Dispersion gap and localized spiral waves in a model for intracellular Ca2+ dynamics. Phys. Rev. Lett. 84:4753–4756. [DOI] [PubMed] [Google Scholar]
- Finch, E. A., T. J. Turner, and S. M. Goldin. 1991a. Calcium as a coagonist of inositol 1,4,5-trisphosphate-induced calcium release. Science. 252:443–446. [DOI] [PubMed] [Google Scholar]
- Finch, E. A., T. J. Turner, and S. M. Goldin. 1991b. Subsecond kinetics of inositol 1,4,5-trisphosphate-induced calcium release reveal rapid potentiation and subsequent inactivation by calcium. Ann. N. Y. Acad. Sci. 635:400–403. [DOI] [PubMed] [Google Scholar]
- Fink, C. C., B. Slepchenko, I. I. Moraru, J. Watras, J. C. Schaff, and L. M. Loew. 2000. An image based model of calcium waves in differentiated neuroblastoma cells. Biophys. J. 79:163–183. [DOI] [PMC free article] [PubMed] [Google Scholar]
- Fontanilla, R. A., and R. Nuccitelli. 1998. Characterization of the sperm-induced calcium wave in Xenopus eggs using confocal microscopy. Biophys. J. 75:2079–2087. [DOI] [PMC free article] [PubMed] [Google Scholar]
- Grynkiewicz, G., M. Poenie, and R. Y. Tsien. 1985. A new generation of Ca2+ indicators with greatly improved fluorescence properties. J. Biol. Chem. 260:3440–3450. [PubMed] [Google Scholar]
- Gunter, T. E., and D. R. Pfeiffer. 1990. Mechanism by which mitochondria transport calcium. Am. J. Physiol. 258:C755–C786. [DOI] [PubMed] [Google Scholar]
- Hofer, A. M., B. Landolfi, L. Debellis, T. Pozzan, and S. Curci. 1998. Free [Ca2+] dynamics measured in agonist-sensitive stores of single living intact cells: a new look at the refilling process. EMBO J. 17:1986–1995. [DOI] [PMC free article] [PubMed] [Google Scholar]
- Hongo, K., E. White, and C. H. Orchard. 1995. Effect of stretch on contraction and the Ca2+ transient in ferret ventricular muscles during hypoxia and acidosis. Am. J. Physiol. 269:C690–C697. [DOI] [PubMed] [Google Scholar]
- Iino, M. 1990. Biphasic Ca2+ dependence of inositol 1,4,5-trisphosphate-induced Ca release in smooth muscle cells of the guinea pig taenia caeci. J. Gen. Physiol. 95:1103–1122. [DOI] [PMC free article] [PubMed] [Google Scholar]
- Iino, M., and M. Endo. 1992. Calcium-dependent immediate feedback control of inositol 1,4,5-triphosphate-induced Ca2+ release. Nature. 360:76–78. [DOI] [PubMed] [Google Scholar]
- Jafri, M. S., and J. Keizer. 1995. On the roles of Ca2+ diffusion, Ca2+ buffers and the endoplasmic reticulum in IP3-induced Ca2+waves. Biophys. J. 69:2139–2153. [DOI] [PMC free article] [PubMed] [Google Scholar]
- Jafri, M. S. 1995. A theoretical study of cytosolic calcium waves in Xenopus oocytes. J. Theor. Biol. 172:209–216. [DOI] [PubMed] [Google Scholar]
- John, L. M., J. D. Lechleiter, and P. Camacho. 1998. Differential modulation of SERCA2 isoforms by calreticulin. J. Cell Biol. 142:963–973. [DOI] [PMC free article] [PubMed] [Google Scholar]
- Jouaville, L. S., F. Ichas, E. L. Holmuhamedov, P. Camacho, and J. D. Lechleiter. 1995. Synchronization of calcium waves by mitochondrial substrates in Xenopus laevis. Nature. 377:438–441. [DOI] [PubMed] [Google Scholar]
- Lechleiter, J., S. Girard, E. Peralta, and D. Clapham. 1991. Spiral calcium wave propagation and annihilation in Xenopus laevis oocytes. Science. 252:123–126. [DOI] [PubMed] [Google Scholar]
- Lechleiter, J. D., and D. E. Clapham. 1992. Spiral Ca2+ waves, excitability and intracellular signalling. Scanning. 14(Suppl II):34–35. [Google Scholar]
- Lechleiter, J. D., L. M. John, and P. Camacho. 1998. Ca2+ wave dispersion and spiral wave entrainment in Xenopus laevis oocytes overexpressing Ca2+ ATPases. Biophys. Chem. 72:123–129. [DOI] [PubMed] [Google Scholar]
- Lytton, J., M. Westlin, S. E. Burk, G. E. Shull, and D. H. MacLennan. 1992. Functional comparisons between isoforms of the sarcoplasmic or endoplasmic reticulum family of calcium pumps. J. Biol. Chem. 267:14483–14489. [PubMed] [Google Scholar]
- Marks, A. R. 1997. Intracellular calcium-release channels: regulators of cell life and death. Am. J. Physiol. 41:H597–H605. [DOI] [PubMed] [Google Scholar]
- Meyer, T., D. Holowka, and L. Stryer. 1988. Highly cooperative opening of calcium channels by inositol 1,4,5-trisphosphate. Science. 240:653–656. [DOI] [PubMed] [Google Scholar]
- Mikoshiba, K. 1997. The InsP3 receptor and intracellular Ca2+ signaling. Curr. Opin. Neurobiol. 7:339–345. [DOI] [PubMed] [Google Scholar]
- Nathanson, M. H., A. D. Burgstahler, and M. B. Fallon. 1994. Multistep mechanism of polarized Ca2+ wave patterns in hepatocytes. Am. J. Physiol. 267:G338–G349. [DOI] [PubMed] [Google Scholar]
- Parker, I., and I. Ivorra. 1990. Inhibition by Ca2+ of inositol trisphosphate-mediated Ca2+ liberation: a possible mechanism for oscillatory release of Ca2+. Proc. Natl. Acad. Sci. USA. 87:260–264. [DOI] [PMC free article] [PubMed] [Google Scholar]
- Parker, I., and Y. Yao. 1991. Regenerative release of calcium from functionally discrete subcellular stores by inositol trisphosphate. Proc. R. Soc. Lond. B Biol. Sci. 246:269–274. [DOI] [PubMed] [Google Scholar]
- Parys, J. B., S. M. McPhersion, L. Mathews, K. P. Campbell, and F. J. Longo. 1994. Presence of inositol 1,4,5-trisphosphate receptor, calreticulin, and calsequestrin in eggs of sea urchins and Xenopus laevis. Dev. Biol. 161:466–476. [DOI] [PubMed] [Google Scholar]
- Parys, J. B., S. W. Sernett, S. DeLisle, P. M. Snyder, M. J. Welsh, and K. P. Campbell. 1992. Isolation, characterization, and localization of the inositol 1,4,5-trisphosphate receptor protein in Xenopus laevis oocytes. J. Biol. Chem. 267:18776–18782. [PubMed] [Google Scholar]
- Ridgeway, E. B., J. C. Gilkey, and L. F. Jaffe. 1977. Free calcium increases explosively in activating medaka eggs. Proc. Natl. Acad. Sci. USA. 74:623–627. [DOI] [PMC free article] [PubMed] [Google Scholar]
- Sims, C. E., and N. L. Allbritton. 1998. Metabolism of inositol 1,4,5-trisphosphate and inositol 1,3,4,5- tetrakisphosphate by the oocytes of Xenopus laevis. J. Biol. Chem. 273:4052–4058. [DOI] [PubMed] [Google Scholar]
- Sneyd, J., and J. Sherratt. 1997. On the propagation of calcium waves in an inhomogeneous medium. SIAM J. Appl. Math. 57:73–94. [Google Scholar]
- Sneyd, J., P. Dale, and A. Duffy. 1998. Traveling waves in buffered systems: applications to calcium waves. SIAM J. Appl. Math. 58:1178–1192. [Google Scholar]
- Sneyd, J., A. LeBeau, and D. Yule. 2000. Traveling waves of calcium in pancreatic acinar cells: model construction and bifurcation analysis. Physica D. 145:158–179. [Google Scholar]
- Tang, Y., J. Stephenson, and H. Othmer. 1996. Simplification and analysis of models of calcium dynamics based on IP3-sensitive calcium channel kinetics. Biophys. J. 70:246–263. [DOI] [PMC free article] [PubMed] [Google Scholar]
- Wagner, J., and J. Keizer. 1994. Effects of rapid buffers on Ca2+ diffusion and Ca2+ oscillations. Biophys. J. 67:447–456. [DOI] [PMC free article] [PubMed] [Google Scholar]
- Wagner, J., Y.-X. Li, J. Pearson, and J. Keizer. 1998. Simulation of the fertilization Ca2+ wave in Xenopus laevis eggs. Biophys. J. 75:2088–2097. [DOI] [PMC free article] [PubMed] [Google Scholar]
- Wang, S.-H., and S. H. Thompson. 1995. Local positive feedback by calcium in the propagation of intracellular calcium waves. Biophys. J. 69:1683–1697. [DOI] [PMC free article] [PubMed] [Google Scholar]
- Watras, J., I. Bezprozvanny, and B. E. Ehrlich. 1991. Inositol 1,4,5-trisphosphate-gated channels in cerebellum: presence of multiple conductance states. J. Neurosci. 11:3239–3245. [DOI] [PMC free article] [PubMed] [Google Scholar]
- Wussling, M. H., and H. Salz. 1996. Nonlinear propagation of spherical calcium waves in rat cardiac myocytes. Biophys. J. 70:1144–1153. [DOI] [PMC free article] [PubMed] [Google Scholar]