

Abstract
A mathematical model was used to analyse the contributions of different types of ionic currents in the pyramidal cells of longitudinal CA3 slices to the magnetic fields and field potentials generated by this preparation. Murakami et al. recently showed that a model based on the work of Traub et al. provides a quantitatively accurate account of the basic features of three types of empirical data (magnetic fields outside the slice, extracellular field potentials within the slice and intracellular potentials within the pyramidal neurons) elicited by stimulations of the soma and apical dendrites. This model was used in the present study to compute the net current dipole moment (Q) due to each of the different voltage- and ligand-gated channels in the cells in the presence of fast GABAA inhibition. These values of Q are proportional to the magnetic field and electrical potential far away from the slice. The intrinsic conductances were found to be more important than the synaptic conductances in determining the shape and magnitude of Q. Among the intrinsic conductances, the sodium (gNa) and delayed-rectifier potassium (gK(DR)) channels were found to produce sharp spikes. The high-threshold calcium channel (gCa) and C-type potassium channel (gK(C)) primarily determined the overall current waveforms. The roles of gCa and gK(C) were independent of small perturbations in these channel densities in the apical and basal dendrites. A combination of gNa, gK(DR), gCa, and gK(C) accounted for most of the evoked responses, except for later slow components, which were primarily due to synaptic channels.
Unlike classic passive models, neurons are now known to contain a variety of active voltage- and ion-sensitive conductances distributed along the dendrites and soma (Llinás, 1984, 1988; Hille, 2001). These channels include ligand-gated excitatory (AMPA and NMDA) and inhibitory (GABAA and GABAB) receptor channels. Also included in this group are voltage- and ion-gated channels (voltage-sensitive sodium channels (gNa), delayed-rectifier, voltage-sensitive potassium channels (gK(DR)), A-type voltage-sensitive potassium channels (gK(A)), voltage-sensitive calcium channels (gCa), C-type voltage- and calcium-sensitive potassium channels (gK(C)) and afterhyperpolarization-type calcium-sensitive potassium channels (gK(AHP)); Traub & Miles, 1991; Traub et al. 1999). Electrical currents produced in activated neurons are the result of the opening and closing of these active conductances. These neuronal currents collectively produce magnetic fields and electrical potentials outside the neurons, which can be measured non-invasively with magnetoencephalography (MEG) and electroencephalography (EEG). The specific roles of various active channels that produce the electrophysiological signals outside the brain have been addressed experimentally (Okada et al. 1997; Wu & Okada, 1998, 1999, 2000).
Murakami et al. (2002) have recently shown that evoked MEG and EEG signals from the hippocampus can be explained within a single theoretical framework. They showed that a mathematical network model of the CA3 based on the work of Traub et al. (1991, 1992, 1993) could provide a quantitatively accurate account of the basic features of three types of empirical data: the magnetic field outside the slice, extracellular field potentials within the slice and intracellular potentials within the pyramidal neurons. These data were elicited by stimulating the soma and apical dendrites. Thus, the model, which has been thoroughly validated for intracellular data by Traub and his colleagues (Traub & Miles, 1991; Traub et al. 1991, 1994, 1999), also appears to be valid, after some modifications, for explaining magnetic field and extracellular field potentials within a single theoretical framework.
It is still unknown, however, how different neuronal conductances contribute to the macroscopic EEG and MEG signals outside the tissue. This problem is difficult to resolve since the equations governing transmembrane potentials and synaptic and intrinsic conductances are inherently non-linear. The present report describes a simple, but novel use of the classic cable equation (see eqn (1) below) to remedy this problem. In this method, the cable equation is solved twice. First, the equations are used in the conventional way to calculate the intracellular potentials. Once this step is completed, the non-linear terms due to synaptic and intrinsic conductances are determined and can be treated as inputs to a system of linear equations. Thus, the intracellular potentials associated with each conductance can be calculated and these potentials can be used to determine the longitudinal intracellular currents along the main cell axis. After establishing the validity of this model with empirical data in our previous study (Murakami et al. 2002), it was possible to use the model to estimate the relative contributions of the channels to the population currents in the slices. This theoretical analysis provides insight into the parameters that are difficult to measure experimentally.
METHODS
Summary of the model
The mathematical model used here has been explained in detail in Murakami et al. (2002) and will thus be described here only briefly. The model represents the longitudinal CA3 slice preparation used by Okada and his colleagues (Okada et al. 1997; Wu & Okada, 1998, 1999, 2000). The experimental slice (Fig. 1A) is a rectangular tissue in which the principal neurons (i.e. pyramidal cells) are arranged parallel to each other with their cell bodies along the cell layer and their longitudinal axis perpendicular to the cell layer. The basal dendrites are located in the stratum oriens and the apical dendrites in the stratum radiatum. The slice was modelled by a square array of 10 × 10 pyramidal cells (E-cells; Fig. 1B) plus 2 × 10 inhibitory cells (I-cells; not shown). The E-cells are spaced 20 μm apart. The cell layer lies along the X axis and the longitudinal axis of the pyramidal cells lies along the Y axis in a rectangular coordinate system. Each E-cell is represented by a multicompartment, single-cylinder cell consisting of eight compartments for the basal dendrites, one compartment for the soma and 10 compartments for the apical dendrites (Fig. 1C). There are six types of active ion-gated conductances along its longitudinal axis. The channel density for gNa is monotonic, with the highest density in the soma, extending to the dendrites on both sides as far as compartments 5 and 13. In the original 1991 Traub model (Traub et al. 1991), the distribution was trimodal with the channels in the soma (compartment 9) and its adjacent dendritic compartments (6, 8, 10 and 12). The channel density distribution of gK(DR) is unimodal in our revised Traub model, but trimodal in the original 1991 Traub model, just as in the case of gNa. gK(A) is present only in the soma in the present model. The channel densities of gCa and gK(C) are almost the same as in the original Traub model, the density being higher in the middle of the basal and apical dendrites compared to the soma region. gK(AHP) is uniformly distributed along the cylinder. The I-cells are also multicompartmental (Fig. 1D). They are classic Hodgkin-Huxley-type cells, having gNa and gK(DR) only in the soma. Three types of cell-to-cell connections are represented in the model: (1) E-cell to E-cell, (2) E-cell to I-cell and (3) I-cell to E-cell. The first type of connection represents the recurrent excitatory connections between the pyramidal cells. The connection space constant was, on average, 25 cells in the Traub model, but it is reduced to two cells in order to compensate for the size of the model hippocampus (200 μm × 200 μm) compared to the actual cross-sectional area of the slice that was modelled (400 μm thick × 400 μm wide, which is half of the distance between the pairs of bipolar stimulating electrodes). The second connection type represents activations of the inhibitory cells by the pyramidal cells. The third type of connection represents mutual inhibition between the inhibitory interneurons. The AMPA and NMDA receptors mediating the E-cell-to-E-cell connections are functional. However, the GABAA connections are blocked in this simulation study, similar to the blocking of fast inhibition with picrotoxin in the experimental studies (Wu & Okada, 1998, 1999, 2000). GABAB inhibition is intact in the model.
Figure 1. A CA3 model modified from the 1991 model developed by Traub et al. (1991).
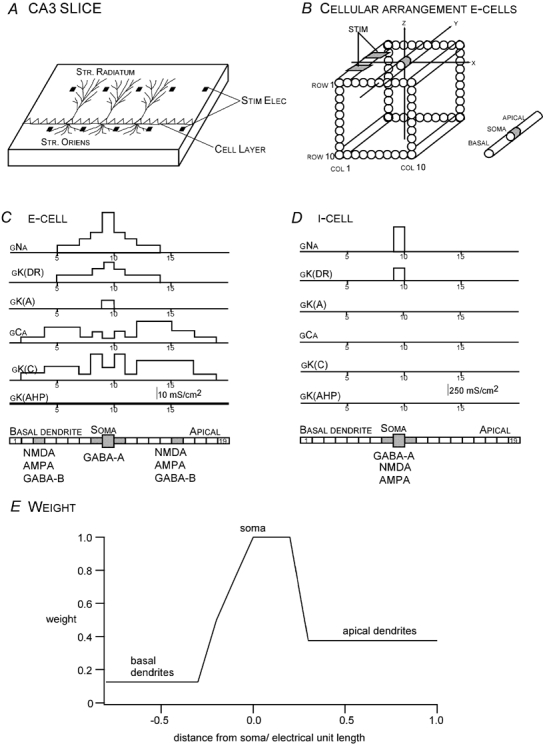
A, geometry of the longitudinal hippocampal CA3 slice represented in the model. Pyramidal cells are arranged parallel to each other with their cell bodies along the cell layer and their longitudinal axis along the orthogonal direction, with basal dendrites in the striatum oriens (STR. ORIENS) and apical dendrites in the striatum radiatum (STR. RADIATUM). An array of bipolar electrodes (STIM ELEC) with an intra-pair distance of 400 μm are placed along the cell layer with a spacing of about 800 μm between pairs of electrodes. B, CA3 model of the present study. E-cells, representing the pyramidal cells in CA3, are arranged in a square array of 10 × 10 cells, spaced 20 μm apart. Twenty I-cells are arranged in a 2 × 10 grid. A bipolar stimulating electrode (STIM) is placed in columns (COL) 1–3. C, a multicompartment, equivalent single-cylinder representation of E-cells together with the distribution of channel densities of the active conductances. D, a similar model for the I-cells. E, weighting function used to represent effects of dendritic branching on the current dipole moment Q.
Calculation of the currents due to the different conductances of the E-cells
As mentioned in the introduction, the longitudinal current associated with changes in each conductance was calculated from an application of eqn (1) in two steps.
 |
(1) |
where Vk is the intracellular potential of compartment k, Vexk is the extracellular potential, Ck is the transmembrane capacitance in compartment k, γk, k-1 is the conductance between compartment k and k − 1, GL,k is the leakage conductance, χk is the calcium concentration in the shell beneath the membrane of compartment k, and fi, k(Vk, t, χk) is the current through ionic or synaptic channel i of compartment k.
First, eqn (1) was used to compute Vk in the conventional way. Vk and fi, k can be computed as a function of time. In the second step, it can be seen that fi, k(Vk, t, χk) can be written as Fi, k(t), since Vk and χk are both functions of time only after step 1. In this case, the ionic and synaptic currents represented in Fi, k(t) can be treated as constant-current sources in a system of linear equations for each fixed value of t. The variable Vk can then be replaced in this new equation by Vi,k, which represents the intracellular potential due to each constant-current source, i. This variable of interest, Vi,k, was computed by solving the modified eqn (1). In turn, Vi,k was used to compute the net current dipole Qi in each cell, which was produced by each ionic and synaptic current, i. Qi is computed as the sum of current dipole Qi,k in each compartment k. By definition, Qi,k = Ji,kdv for each current source i, where Ji,k is the current density along the longitudinal axis of compartment k and dv is the volume element. Qi,k can be estimated from its discrete approximation since it can be written as Qi k = (I/A)(AΔL) = IΔL, where I is the longitudinal current for current source i in compartment k, A is the cross-sectional area, and ΔL the length of compartment k. I is computed as the product of the conductance and voltage drop in the compartment (i.e. γk,k-1(Vi,k - Vi,k-1)). The relative contribution of each channel i to the aggregate Q was determined by comparing Qi to the aggregate Q of all channels computed from eqn (1) in the initial step of the calculation.
The calculated Q values were normalized for a slice with a cross-sectional area of 6 mm wide × 0.4 mm thick used in experimental studies (Wu & Okada, 1999, 2000) to allow comparison of the calculated Q values with the Q values estimated from experiments. The Q from the model was multiplied by 120, since a slice of this size is expected to contain 12 000 pyramidal cells (Traub & Miles, 1991). The Q values are proportional to the magnetic field and electrical potential some distance from the slice (Barr et al. 1966; Geselowitz, 1967,1970). Thus, the Q values presented in this paper are indicative of the MEG and EEG signals evoked outside the slice.
Representation of dendritic branching in the single-cylinder model
A major difference between the 1991 Traub model and the present model is the set of weights used to take into account the effects of dendritic branching. The 1991 model could not account for certain features of the data, such as the spikes and overall shape of the MEG waveform outside the slice (Okada et al. 1997). The original model was developed to account for intracellular data; therefore, the branching effects were not critical. MEG signals measured empirically outside the slice, however, depend on the component of the Q in each segment of dendrites that is parallel to the longitudinal axis (Y axis) of the pyramidal cells. Moreover, the Q in each segment depends on the diameter of the dendrite, since by definition Q is proportional to its cross-sectional area. Thus, it was necessary to factor in the effects of dendritic obliqueness and the reduction in dendritic cross section of the distal processes. The effects of branching dendrites on Q were represented by weights incorporating these two factors. These weights were scaled from 1 to 0, with 1 representing the unbranched portion of the proximal apical dendrite, and values less than 1 indicating branched portions of the distal apical dendrites plus all of the basal dendrites. The following weights were assigned to the neuronal compartments: 0.125 for compartments 1–6, 0.5 for compartment 7, 0.75 for compartment 8, 1.0 for the soma and proximal dendritic compartments 9–12 and 0.375 for compartments 13–19 (Fig. 1E). While weights were determined empirically to obtain good fits to experimental data, they approximate the products of cross-sectional area and longitudinal dendritic length derived from morphological data on CA3 pyramidal cells presented in Traub et al. (1994) and Migliore et al. (1995).
RESULTS
Dipolar longitudinal intracellular currents due to intrinsic currents and synaptic currents
The magnetic field and electrical potentials produced by the slice depend on two types of conductance, namely the synaptic and non-synaptic intrinsic conductances. Figure 2 shows the contributions of these two types of conductance to the aggregate Q in the model slice. The aggregate Q is shown by a dashed curve in each panel for the somatic and apical stimulation conditions. The Q due to intrinsic conductances (left) or synaptic conductances (right) is shown by a continuous curve superimposed on the aggregate Q. The ‘intrinsic current dipole’ is the sum of the Q values attributable to the six voltage- and calcium-dependent conductances. The ‘synaptic current dipole’ is the sum of the Q values attributable to the AMPA, NMDA and GABAB receptors. GABAA receptors were blocked in this simulation, but GABAB receptors were not blocked. As mentioned in Methods, the contributions of the synaptic and intrinsic conductances to the aggregate Q were calculated by treating the transmembrane current associated with each type of conductance as an input current in solving eqn (1) in step 2, then solving for the membrane potential change due to each conductance, finding Qi and summing Qi across conductance i for each type (intrinsic vs. synaptic) of conductances. It can be seen that for both stimulus conditions, intrinsic current dipoles accounted for most of the total current dipole, whereas synaptic current dipoles made a weak contribution to the slow waves.
Figure 2. Dipolar current waveforms (Q values) produced by intrinsic (non-synaptic, left) and synaptic (right) channels of the excitatory E-cells in the model slice.
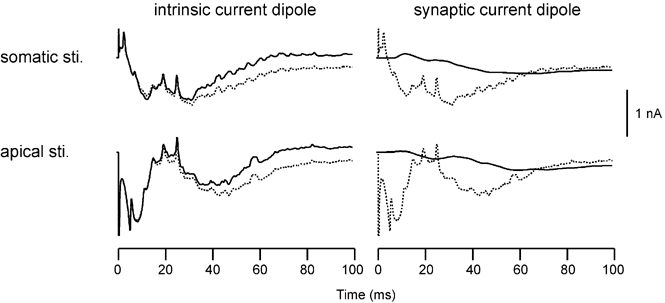
Continuous curves in row 1: Qy produced by somatic stimulus (sti.). Continuous curves in row 2: Qy produced by apical stimulus. Dotted curves: Qy produced by the sum of all channel types.
Dipolar longitudinal intracellular currents are due to each intrinsic channel type
Somatic stimulation
Since the intrinsic conductances are key contributors in producing the net dipolar current, their roles were analysed further. Figure 3 illustrates the contributions of the various intrinsic conductances towards the aggregate Q (Qy) in the somatic stimulation condition. Two populations of neurons have been distinguished in the slice, a directly activated population of neurons and a synaptically activated population of neurons (Murakami et al. 2002). In the experimental studies analysed here, the slice was stimulated by several pairs of bipolar electrodes. Neurons close to each pair of bipolar electrodes were activated directly by the stimulus, whereas those between the pairs of bipolar electrodes were not. Instead, the latter neurons were activated synaptically via the recurrent excitatory connections among the pyramidal neurons in the slice. Thus, the evoked magnetic field measured outside the slice was due to a mixture of the fields created by these two types of neurons. The dipolar current waveforms in Fig. 3 are shown separately for the entire slice (left), for the population of E-cells directly activated by the extracellular stimulation (centre) and for those activated synaptically by the first class of cells (right). As depicted by the Qy in the top row, these two types of cells had distinctly different contributions to the aggregate Qy from the entire slice.
Figure 3. Dipolar current waveforms (Q values) produced by all of the E-cells in the model slice (Qtotal, left), by the population of E-cells directly activated by the stimulus (Qdirect, centre), and by the population of synaptically activated E-cells (Qsynapse, right).
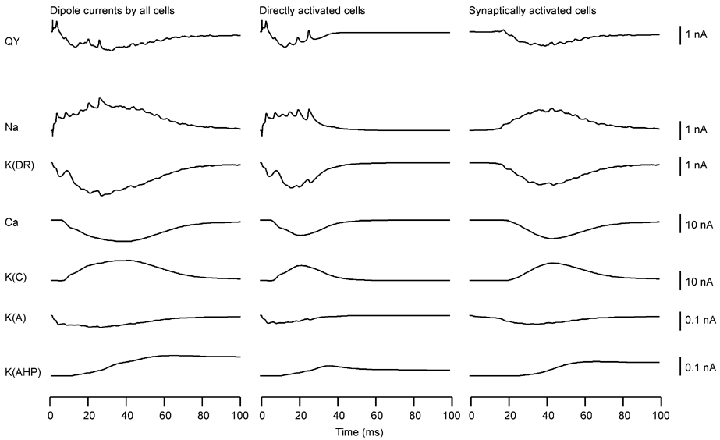
Row 1, Qy produced by the sum of all channel types. Rows 2–7, Q values produced by gNa, gK(DR), gCa, gK(C), gK(A) and gK(AHP), respectively.
The spikes in Qy of directly activated neurons were due to the longitudinal currents produced by gNa, and to a small degree by gK(DR). The sodium spikes were well defined because the transmembrane currents resulting from gNa activation were confined to the soma and its surrounding dendritic regions. The spikes due to gK(DR) were less clearly seen because of the prolonged transmembrane currents associated with this conductance in the dendrites. The sum of the sodium spikes across all the directly activated E-cells was more evident in Qy because of a high level of synchrony in these cells. The currents produced by gNa was directed from the soma towards the apical dendrites because the asymmetry in dendritic branching favoured the apical cells. The current for gK(DR) was opposite to the sodium current, since this conductance produced a repolarizing current. The slow wave in Qy appears to be due to gK(DR), gCa and gK(C). However, the magnitude of QK(DR) was approximately 10 times smaller than the magnitudes of QCa and QK(C). The latter two dipole moments were thus predominantly responsible for the slow wave. The gCa current flowed from apical dendrites towards the soma, while the gK(C) current flowed in the opposite direction. The net effect of QCa and QK(C) thus played an important role in determining the shape and amplitude of Qy. The intracellular currents associated with gK(A) and gK(AHP) were quite weak relative to QCa and QK(C).
In the case of synaptically activated E-cells, the aggregate Qy was very similar in waveform to the currents due to gNa, gK(DR), gCa and gK(C). However, the magnitudes of the first two currents were again about 10 times weaker than those of the latter two conductances. Thus, the net effect of gCa and gK(C) were important in determining the shape of Qy. The currents associated with gNa, gK(DR), gCa and gK(C) flowed in the same directions as the directly activated E-cells.
Apical stimulation
The results for the apical stimulation condition are illustrated in Fig. 4. In directly activated cells, the sharp spikes in Qy were due to gNa, just as in the case of somatic stimulation. The initial spike in QNa (downward spike after the stimulus artefact in Qy of column 1) was directed from the apical dendrite to the soma since compartment 15 of the apical dendrite was stimulated and the sodium conductances proximal to this site were activated first. The direction of QNa changed in subsequent spikes as their origin moved towards the soma; QK(DR) mirrored these changes after some delay. Furthermore, the current associated with gK(A) mirrored the current associated with gNa, but its magnitude was about 1/10 of QNa. The slowly varying main components of Qy were determined primarily by the combination of QCa and QK(C). Finally, QK(AHP) was directed from the soma to the apical dendrites due to stronger hyperpolarization in the dendrites and differences in the branching pattern of the apical and basal dendrites. This current was again relatively weak and did not contribute significantly to the overall Q.
Figure 4.
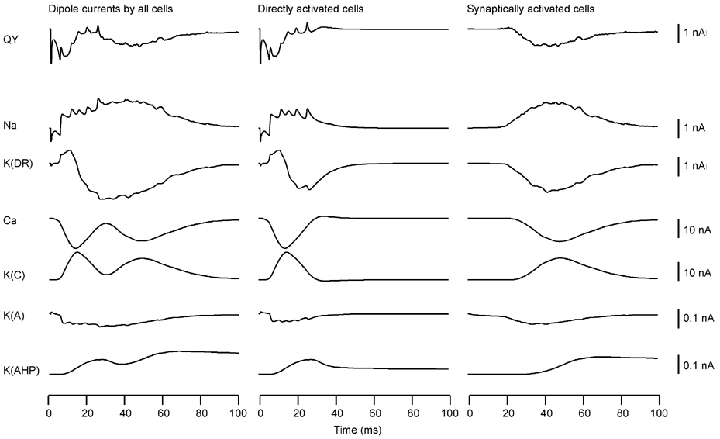
Same as Fig. 3 for the apical stimulation condition
Relative contributions of active conductances to the longitudinal currents in CA3 slices
Somatic stimulation
Figure 5 demonstrates the relative contributions of different active conductances in the CA3 pyramidal model neurons to the aggregate intracellular currents. Results are shown for the entire slice (Qtotal), for the population of directly activated (Qdirect) and synaptically activated cells (Qsynapse). In each of these cases, the dashed curve indicates Qy. The continuous curve, Q, in each pair of traces is the summation of a combination of channels, as labelled to the left of the waveform.
Figure 5. Relative contributions of the currents produced by the different channel types to the aggregate population current dipole moment (Q) in the somatic stimulation condition.
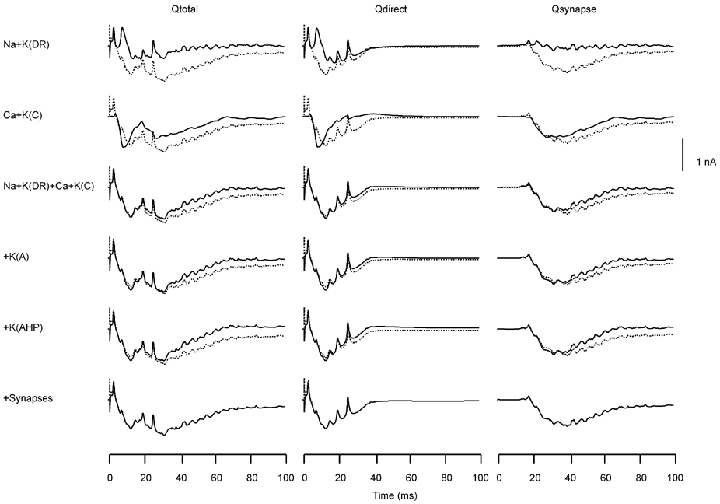
Relative contributions of the currents produced by the different channel types to the aggregate population Q value in the somatic stimulation condition, shown separately for the Qtotal produced by the entire model slice (left), Qdirect produced by the population of E-cells directly activated by the stimulus (centre) and Qsynapse produced by the population of synaptically activated E-cells (right). In each case, the Q due to the sum of all channel types is shown by a dashed curve in each row. The continuous curves in rows 1–6 show the Q values produced by the sum of Na and K(DR) channels (row 1), the sum of the Ca and K(C) pair (row 2), the Na + K(DR) + Ca + K(C) channels (row 3), addition of the current generated by the A-channel (row 4), addition of the current generated by the K(AHP) channel (row 5) and by the addition of the synaptically mediated current (row 6).
As shown in Qdirect, the dipolar current produced by the combination of gNa and gK(DR) resulted in the upward spikes directed from the soma towards the apical dendrites in Qy, but did not influence the overall shape of Qy. The combination of gCa and gK(C) generated the slowly varying main component of Qy, but not the spikes. All four channel types, when combined together, accounted for most of the waveform of Qy, except for the later part of the slow wave. This slow component was due to the synaptically produced longitudinal currents in the model E-cells.
In the case of synaptically activated neurons, the sum of currents produced by gNa and gK(DR) did not account for the slow wave seen in Qsynapse. This slow wave was primarily due to gCa and gK(C), with the remaining portion of Qsynapse due to the synaptically mediated currents.
Apical stimulation
The relative roles of the different channel types for the apical stimulation, shown in Fig. 6, were similar to those for the somatic stimulation condition in Fig. 5. In the case of Qdirect, the Na-K(DR) pair explained the spikes in Qy, but did not account for the triphasic slow wave. This component was primarily due to gCa and gK(C). The combination of these four types of channel determined the shape of Qy, except for the later component of the slow wave starting at a latency of about 20 ms. This later component was due to the synaptically mediated current.
Figure 6.
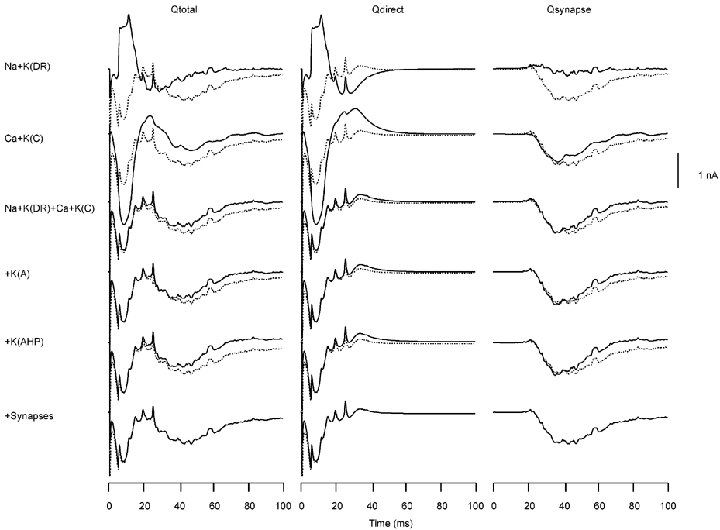
Same as Fig. 5 for the apical stimulation condition
For Qsynapse, gNa and gK(DR) did not contribute to the slow wave, rather this component was due mostly to the combination of gCa and gK(C). The remaining portions of the slow wave was a result of the synaptically generated currents, as was the case for the somatic stimulation.
Contributions of calcium and C-type potassium channels in the apical and basal dendrites and perisomal region
Up to this point, the analysis has focussed on the net dipolar currents in entire cells. The current flow within the entire cell is generally more complex than a simple current dipole. Current flows within three principal cellular segments during an extracellularly evoked response were therefore examined. The current flow in each compartment was calculated using the two-step procedure described in Methods. The net current in each cellular segment was then evaluated for currents due to gCa and gK(C), since these channels were most significant in determining the shape of the Qy.
The sum of Q values due to Ca and K(C) channels is illustrated in Fig. 7. The dashed curves show the Q values for the entire cells. The continuous curves show the Q values separately for basal dendrites (compartments 1–7), perisomal region (compartments 8–10) and apical dendrites (compartments 11–19). In the case of somatic stimulation, the Q value from basal dendrites was positive (directed toward the soma), since the distal basal dendrites were more depolarized than the proximal dendrites. The currents due to gCa and gK(C) in the perisomal and apical segments flowed in the same direction (negative) as the Q for the entire cells, and were directed from the apical dendrite towards the basal side. Furthermore, the currents in the basal segment tended to cancel the currents in these two segments. The latency of current flow was shorter in the perisomal region than in the apical region because the propagation of calcium channel activation from soma to apical dendrites takes time.
Figure 7. The Q generated by the sum of calcium and C-type potassium channels in the somatic and apical stimulation condition.
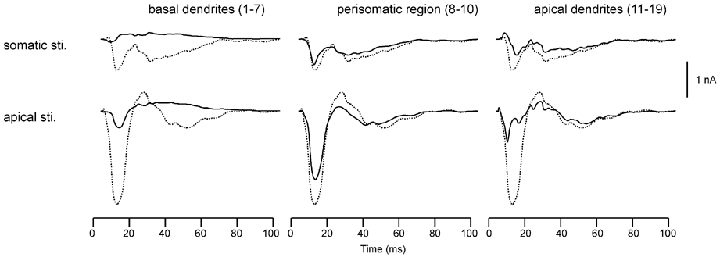
The Q generated by the sum of calcium and C-type potassium channels in the somatic and apical stimulation condition, shown separately for the Q produced by basal dendrites (compartments 1–7; left), the perisomatic region (compartments 8–10; centre) and by the apical dendrites (compartments 11–19; right). In each case, the Q due to the sum of all regions is shown by a dashed curve. Row 1, somatic stimulus condition. Row 2, apical stimulus condition.
As a result of apical stimulation, the first component of Q in the basal dendritic segment was negative because the activation of gCa propagated from the apical dendrites to the soma and then towards the basal dendrites. The perisomal region was responsible for most of the current dipole moment from the entire cells. The onset of the first component in the apical dendrites was faster than in the perisomal region because gCa activation occurred initially in the apical dendrites, due to the site of extracellular depolarizing stimulation.
Effects of changes in the distribution of calcium and C-type potassium channels
The relative contributions of gCa and gK(C) depend on the balance of channel density of these conductances in the apical and basal dendrites. Therefore, their channel densities were systematically varied in order to investigate how the changes in distribution of these channels affect Q.
The effects of changes in the distribution of gCa distribution on the net longitudinal current are depicted in Fig. 8. In Fig. 8a, the density of gCa was reduced to 90 % of the original value in the apical dendrites (continuous line) and in the basal dendrites (dashed line). Figure 8b is based on the distributions used in the rest of this paper. In Fig. 8c, gCa density was increased by 10 % in the apical (continuous line) and basal (dashed line) areas. The reduction of gCa density in the apical dendrites decreased the slow waves, whereas the increase in density enhanced the slow waves. The effects of altering gCa in the basal dendrites were the opposite of the apical manipulations.
Figure 8. The Q generated by the sum of calcium and C-type potassium channels in the somatic (row 1) and apical (row 2) stimulation condition.
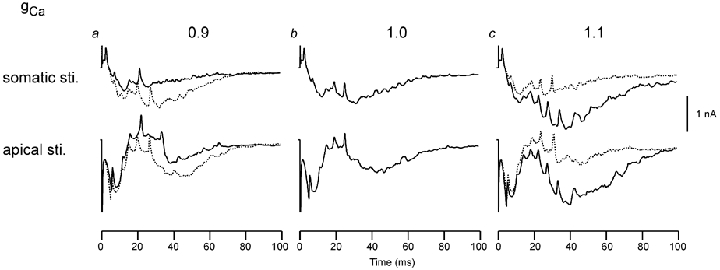
The Q generated by the sum of calcium and C-type potassium channels in the somatic (row 1) and apical (row 2) stimulation condition, shown separately for (a) change in gCa density to 0.9 of that of the original in apical dendrites (continuous line) and basal dendrites (dashed line), (b) original gCa density and (c) change in the gCa density to 1.1 of that of the original in apical dendrites (continuous line) and in the basal dendrites (dashed line).
Figure 9 summarizes the effects of changing gK(C) density on the aggregate Q value. These results are exactly the opposite of the effects observed for gCa. For example, a reduction of gK(C) in the apical dendrites (Fig. 9a, continuous line) increased the slow-wave amplitude, and an increase in the apical dendrites reduced it (Fig. 9c, continuous line). Similarly, a reduction of gK(C) in the basal dendrites (Fig. 9a, dashed line) decreased the slow wave directed from the apical toward the basal dendrites, whereas an increase (Fig. 9c, dashed line) increased it. The effects of small perturbations of gCa and gK(C) densities appear to be gradual and without catastrophic consequences (i.e. a small perturbation produces a small perturbation in a predictable direction).
Figure 9.
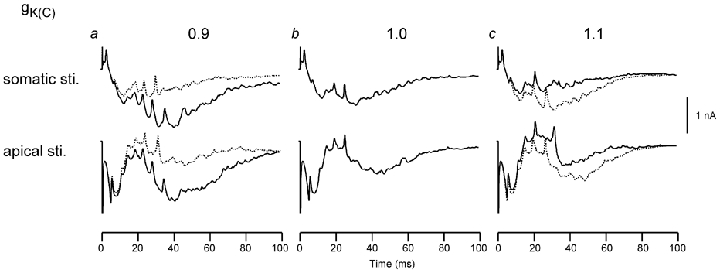
Same as Fig. 8 but for changes in the gK(C) density distribution
DISCUSSION
The theoretical analysis presented in this report clearly delineates the relative contributions of currents associated with a variety of conductances to the Q produced by neuronal activity in the slice model, and therefore to the magnetic field measured outside the slice. Empirically, 1–3 spikes can be clearly seen in the magnetic field from longitudinal CA3 slices (Okada et al. 1997; Wu & Okada, 1998). According to the present results, these spikes are due to the gNa in the neuronal population that is directly activated by an external stimulus. The spike direction is from the soma to apical dendrites for all spikes following somatic stimulation, since spike initiation is always at the soma. The presence of asymmetry in dendritic branching favours the current directed towards the apical dendrites. With apical stimulation in which an apical compartment was depolarized by external stimulation, the initial spike was directed from an apical compartment towards the soma. Subsequent spikes were always directed from the soma to the apical dendrites, similar to somatic stimulation, because the site of spike initiation shifted to the soma.
The slowly varying components of Qy were similar in shape and magnitude to the experimentally measured magnetic fields in both the somatic and apical stimulation conditions (Murakami et al. 2002). According to the present analysis, the overall shape of the Qy was due predominantly to the combination of currents produced by calcium and C-type potassium channels. These results demonstrate the importance of gCa and gK(C) on the physiological basis of MEG and EEG signals obtained from hippocampal slices. The intracellular current associated with each of these two types of channels was about one order of magnitude stronger than the currents associated with gNa and gK(DR). Since the direction of current was opposite for gCa and gK(C), with a slight delay for QK(C) relative to QCa, the two currents nearly cancelled each other out. Nevertheless, the net current mediated by these conductances accounted for most of the total current of the relatively slow components as compared to sodium spikes.
This study is the first of its type, and thus the above conclusions should be viewed with some caution. Further studies are needed to assess the role of gCa and gK(C), since the dipole moments associated with these conductances are about one order of magnitude stronger than those of gNa and gK(DR). The net longitudinal calcium and C-type currents depend on assumptions about their channel distributions along the dendrites and soma. The parametric analysis demonstrated that effects of change in channel density distributions were well ordered and predictable. Nevertheless, it is important to incorporate experimentally estimated density distributions of gCa and gK(C) in interpreting MEG and EEG signals. Some progress has been made recently in experimentally determining these channel densities in the hippocampus (Johnston et al. 1996; Migliore & Shepherd, 2002).
This study also revealed that the intrinsic cellular currents dominate MEG and EEG signals, while the synaptic currents played a minor role. Some caution should be taken when using this somewhat surprising result to interpret MEG and EEG signals, since in the present model, as in the Traub model, the synapses were represented in only one component in the apical and basal dendrites. The distribution of synapses should be varied and its effect on the longitudinal currents should be evaluated before making generalizations.
Overall, this mathematical analysis, which is based on a novel use of the classic cable equation, has provided new insights into the physiological basis of MEG and EEG.
Acknowledgments
This work was supported financially by a grant from the Ministry of Education, Science, Sports and Culture, Japan, under Grant-in-Aid for Prior Science Research (A)11170211 to A. Hirose, and NIH grant RO1-NS21149 to Y. Okada. We acknowledge the generous support of Dr Roger Traub, who provided his 1991 model. We thank J. A. Connor and S. Mun-Bryce for their comments about the manuscript.
REFERENCES
- Barr RC, Pilkington TC, Boineau JP, Spach MS. Determining surface potentials from current dipoles, with application to electrocardiography. IEEE Trans Biomed Eng. 1966;13:88–92. doi: 10.1109/tbme.1966.4502411. [DOI] [PubMed] [Google Scholar]
- Geselowitz DB. On bioelectric potentials in an inhomogeneous volume conductor. Biophys J. 1967;7:1–11. doi: 10.1016/S0006-3495(67)86571-8. [DOI] [PMC free article] [PubMed] [Google Scholar]
- Geselowitz DB. On the magnetic field generated outside an in homogeneous volume conductor by internal current sources. IEEE Trans Magn. 1970;6:346–347. [Google Scholar]
- Hille B. Ionic Channels of Excitable Membranes. Sunderland Mass: Blackwell Science Inc; 2001. [Google Scholar]
- Johnston D, Magee JC, Colbert CM, Cristie BR. Active properties of neuronal dendrites. Annu Rev Neurosci. 1996;19:165–186. doi: 10.1146/annurev.ne.19.030196.001121. [DOI] [PubMed] [Google Scholar]
- Llinás RR. Comparative electrobiology of mammalian central neurons. In: Dingledine R, editor. Brain Slices. New York: Blackwell Science Inc; 1984. pp. 7–24. [Google Scholar]
- Llinás RR. The intrinsic electrophysiological properties of mammalian neurons: insights into central nervous system function. Science. 1988;242:1654–1664. doi: 10.1126/science.3059497. [DOI] [PubMed] [Google Scholar]
- Migliore M, Cook E, Jaffe DB, Turner DA, Johnston DJ. Computer simulations of morphologically reconstructed CA3 hippocampal neurons. J Neurophysiol. 1995;73:1157–1168. doi: 10.1152/jn.1995.73.3.1157. [DOI] [PubMed] [Google Scholar]
- Migliore M, Shepherd GM. Emerging rules for the distributions of active conductances. Nat Rev Neurosci. 2002;3:362–370. doi: 10.1038/nrn810. [DOI] [PubMed] [Google Scholar]
- Murakami S, Zhang T, Hirose A, Okada YC. Physiological origins of evoked magnetic fields and extracellular field potentials produced by guinea-pig CA3 hippocampal slices. J Physiol. 2002;544:237–251. doi: 10.1113/jphysiol.2002.027094. [DOI] [PMC free article] [PubMed] [Google Scholar]
- Okada YC, Wu J, Kyuhou S. Genesis of magnetic signals in a mammalian CNS structure. Electroencephalogr Clin Neurophysiol. 1997;103:474–485. doi: 10.1016/s0013-4694(97)00043-6. [DOI] [PubMed] [Google Scholar]
- Traub RD, Jefferys JGR, Miles R. Analysis of the propagation of disinhibition-induced after-discharged along the guinea-pig hippocampal slice in vitro. J Physiol. 1993;472:267–287. doi: 10.1113/jphysiol.1993.sp019946. [DOI] [PMC free article] [PubMed] [Google Scholar]
- Traub RD, Jefferys JGR, Miles R, Whittington MA, Tóth K. A branching dendritic model of a rodent CA3 pyramidal neurone. J Physiol. 1994;481:79–95. doi: 10.1113/jphysiol.1994.sp020420. [DOI] [PMC free article] [PubMed] [Google Scholar]
- Traub RD, Jefferys JGR, Whittington MA. Fast Oscillations in Cortical Circuits. Cambridge MA: Blackwell Science Inc; 1999. [Google Scholar]
- Traub RD, Miles R. Neuronal Networks of the Hippocampus. New York: Blackwell Science Inc; 1991. [Google Scholar]
- Traub RD, Miles R, Buzsaki G. Computer simulation of Carbachol-driven rhythmic population oscillations in the CA3 region of the in vitro rat hippocampus. J Physiol. 1992;451:653–672. doi: 10.1113/jphysiol.1992.sp019184. [DOI] [PMC free article] [PubMed] [Google Scholar]
- Traub RD, Wong RKS, Miles R, Michelson H. A model of a CA3 hippocampal pyramidal neuron incorporating voltage-clamp data on intrinsic conductances. J Neurophysiol. 1991;66:635–650. doi: 10.1152/jn.1991.66.2.635. [DOI] [PubMed] [Google Scholar]
- Wu J, Okada YC. Physiological bases of the synchronized population spikes and slow wave of the magnetic field generated by a guinea-pig longitudinal CA3 slice preparation. Electroencephalogr Clin Neurophysiol. 1998;107:361–373. doi: 10.1016/s0013-4694(98)00098-4. [DOI] [PubMed] [Google Scholar]
- Wu J, Okada YC. Roles of a potassium afterhyperpolarization current in generating neuromagnetic fields and field potentials in longitudinal CA3 slices of the guinea-pig. Clin Neurophysiol. 1999;110:1858–1867. doi: 10.1016/s1388-2457(99)00138-8. [DOI] [PubMed] [Google Scholar]
- Wu J, Okada YC. Roles of calcium- and voltage-sensitive potassium currents in the generation of neuromagnetic signals and field potentials in a CA3 longitudinal slice of the guinea-pig. Clin Neurophysiol. 2000;111:150–160. doi: 10.1016/s1388-2457(99)00207-2. [DOI] [PubMed] [Google Scholar]