

Abstract
The alignment of pyrene in a 1-palmitoyl-2-oleoyl-phosphatidylcholine bilayer was investigated using two different approaches, namely solid-state 2H-NMR spectroscopy and molecular dynamics (MD) simulations. Quadrupolar splittings from 2H-NMR spectra of deuterated pyrene-d10 in an oriented lipid bilayer give information about the orientation of C-D bonds with respect to the membrane normal. From MD simulations, geometric information is accessible via trajectories. By defining molecular and bond order parameters, the data from MD trajectories and NMR spectra can be compared straightforwardly. To ensure that the results from both methods are comparable, parameters of the experimental and the simulation setup were chosen to be as similar as possible. From simulations, we saw that pyrene prefers a position inside the lipid membrane near the headgroups and has no tendency to diffuse from one monolayer of the membrane to the other. The results from simulation and NMR show that the normal of the molecular plane is aligned nearly perpendicular to the bilayer normal. The long axis of pyrene lies preferentially parallel to the bilayer normal within a range of ±30°. The results from the two different methods are remarkably consistent. The good agreement can be explained by the fact that the different kind of motions of a pyrene molecule are already averaged within a few nanoseconds, which is the timescale covered by the MD simulation.
INTRODUCTION
Small hydrophobic molecules are known to interact with cell membranes of living organisms. Due to their hydrophobic nature, such compounds can accumulate inside the lipid bilayer and influence its properties and function. Polycyclic aromatic hydrocarbons (PAH) represent a class of substances, which are listed as human health hazards with toxic, carcinogenic, and mutagenic properties (IARC, 1983). They interact mainly with hydrophobic organic compounds (Neff, 1979). After the uptake of PAH by living organisms (via direct contact or inhalation), they diffuse passively into cell membranes and, if not degraded, accumulate there (Cuno et al., 1995; Petrasek et al., 1983). Besides environmental significance, PAH dyes are also of scientific relevance. PAH dyes prefer to accumulate in the more ordered l0 lipid phase domains. Thus they can be used for fluorescence labeling of different phase states of membranes (Baumgart et al., 2003).
Solid-state NMR is widely used for the investigation of lipid bilayers. It can give information about bilayer morphology (Seelig, 1978), phase states, and local structure such as acyl chain ordering (Seelig and Waespe-Sarcevic, 1978). Investigating a labeled solute in membranes by NMR can give detailed information about its permeation, localization, or molecular alignment. The latter can be deduced for example from deuterium NMR spectra of macroscopically oriented samples (Ulrich et al., 1992, 1995; Ulrich and Grage, 1998). 2H nuclei show quadrupolar splittings, which depend on the average orientation of the C-D bond in the magnetic field. Moreover, these splittings are averaged by molecular motion, thus giving information about the overall dynamics of the molecule.
Pyrene itself has not been studied in lipid bilayers by 2H-NMR, but Shilstone and Zannoni (1989) determined molecular order parameters of pyrene in different liquid crystals. Other techniques, mainly fluorescence spectroscopy, have been employed to examine pyrene in various lipid environments. Herrenbauer (2002) used fluorescence quenching methods for determining the localization of pyrene in 1-palmitoyl-2-oleoyl-phosphatidylcholine (POPC) bilayers. Daems et al. (1985) investigated excimer lifetime and diffusion constants of pyrene in DPPC liposomes at different concentrations and temperature by measuring the fluorescence decay. The lateral diffusion of pyrene in DMPC bilayers has been examined by using fluorescence self-quenching (Martins and Melo, 2001)
Molecular dynamics simulations are commonly used to examine processes in lipid membranes in atomic detail (Feller, 2000; Saiz et al., 2002). Molecular interactions, as well as permeation and distribution of small hydrophilic and hydrophobic solutes in lipid membranes, can be studied by this technique. Older literature has been reviewed by Tieleman et al. (1997). Recently many extended simulations have been performed in this field. A series of Monte Carlo simulations were carried out, examining the permeability of several gases (O2, CO, CO2, NO, and NH3), CHCl3, formamide, and water in DMPC bilayers, as a function of varying cholesterol content (Jedlovszky and Mezei, 2003). Another study used, among other methods, an umbrella sampling technique to investigate the distribution of hexane and halothane in DOPC bilayers, calculated from free-energy profiles (MacCallum et al., 2003). Long-scale simulations up to 50 ns were carried out to examine the distribution of the organic pollutant pentachlorophenol (PCP) in POPC and POPE bilayers and the changes in membrane properties evoked by the presence of PCP (Mukhopadhyay et al., 2004). Constraint simulations were employed to study the permeability and diffusion properties of a series of small hydrophobic and hydrophilic solutes inside DPPC bilayers (Bemporad et al., 2004). The behavior of drugs in model membranes was also studied with this method. Changes on a DPPC bilayer caused by the presence of the anesthetic halothane at a high mole fraction of 50% were investigated with a 2 ns molecular dynamics (MD) simulation (Koubi et al., 2000). Free-energy profiles and diffusion coefficients of the anticonvulsant drug valproic acid in DPPC were determined employing constraint simulations (Ulander and Haymet, 2003).
In this study, the interaction of the PAH pyrene (C16H10) with cell membranes is investigated in a model system consisting of pyrene in liquid crystalline POPC bilayers. We describe the location and orientation of pyrene in this bilayer using 2H-NMR spectroscopy and MD simulations.
MATERIALS AND METHODS
The NMR conditions and simulation setup in this study were chosen to guarantee a direct comparison between these two methods. The concentration of pyrene in the lipid bilayer as well as the temperature were similar in experiment and simulations. Deuterated pyrene-d10 was used for 2H-NMR spectroscopy, whereas the simulation was performed with protonated pyrene. Deuterium and hydrogen are chemically equivalent, and the additional mass is assumed to have a negligible effect on the molecular motion of the large pyrene molecules.
NMR
NMR theory
The quadrupolar splitting Δvq of a deuterium nucleus is given by (Abragam, 1983, first order term at high magnetic field)
 |
(1) |
where the quadrupolar coupling constant QCC is given by
 |
(2) |
which in the case of a deuterium nucleus bound to an aromatic ring carbon is close to 193 kHz (Rowell et al., 1965), θ is the angle between the C-D bond and the external magnetic field direction, and 〈 〉 denotes the time-average of the expression inside the brackets. We can define a bond order parameter
 |
(3) |
which gives the average orientation of the C-D bond vector. This average orientation of the bond vector can be directly compared to the value obtained from molecular dynamics simulations.
In the case of anisotropic motion of the molecule, the quadrupolar coupling of a deuteron depends on the molecular ordering tensor S (Saupe, 1964; 1968; Emsley, 1996). A general element of this tensor, Sαβ (where α and β are either x, y, or z in a molecule-fixed coordinate system) is given by
 |
(4) |
where δαβ is the Kronacker delta function, which is 1 if α = β, and 0 otherwise. In a liquid crystalline phase, θα is the angle between the α-axis and the director of the liquid crystal, which in a lipid membrane is the bilayer normal. It is always possible to find a molecular coordinate system in which the ordering tensor is diagonal, with diagonal elements Sxx, Syy, and Szz. In the case of the highly symmetric pyrene molecule, these coordinate axes coincide with the symmetry axes of the molecule, and such a coordinate system xyz is shown in Fig. 1 A. It should also be noted that the ordering tensor is traceless, which means that the sum of the diagonal elements is zero. Hence there exist only two independent tensor elements of the ordering tensor.
FIGURE 1.
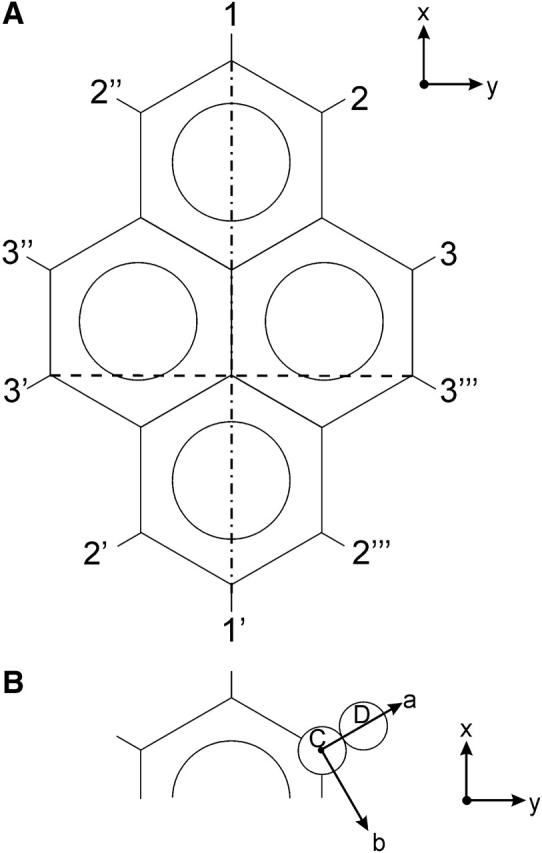
The 10 deuterium atoms on the pyrene-d10 molecule belong to three chemically different sites, and are denoted as 1, 2, and 3. In the MD simulation, all atoms are distinguishable, as indicated by primes in the figure. (A) The molecule-fixed xyz coordinate system is shown, with the z axis pointing into the plane, dash-dot-dash x axis for calculating Sxx, dash-dash y axis for calculating Syy. (B) The quadrupolar coordinate system abc is illustrated for the deuteron at position 2. The a axis is along the C-D bond, and the c axis is parallel to the z axis, pointing into the plane.
In the case of pyrene embedded in liquid crystals, the following expression has been derived for the quadrupolar splittings of deuterons in the molecule (Shilstone and Zannoni, 1989; Emsley and Lindon, 1975):
 |
(5) |
Here xyz is a molecular coordinate system, defined in Fig. 1 A, whereas abc is a quadrupolar interaction tensor coordinate system for deuteron i, shown in Fig. 1 B for the deuteron in position 2. These coordinate systems are chosen such that both the ordering tensor and the quadrupolar interaction tensor are diagonal. It can be noted that the a axis points along the C-D bond. The quadrupolar interaction tensor for deuteron i is defined by the coupling constant  and the asymmetry parameter ηi. These can in principle be different for the different deuterons, but here we assume that they are the same at all positions, with ηi = 0.06 (Shilstone and Zannoni, 1989) and
  having the value of QCC given above. The li are directional cosines between the xyz and abc coordinate systems, defined as
  where
where  is the angle between the molecular x axis and the a axis for deuteron i.
Using the NMR data, we can fit the observed splittings to Eq. 5 and determine the elements of the ordering tensor, which can be compared to those found by Shilstone and Zannoni (1989) for pyrene in other liquid crystal systems. We can also compare with the order parameter values Sxx, Syy, and Szz obtained from the simulation performed below. From NMR, we get two parameters, Szz and the difference term (Sxx − Syy), and tracelessness gives the third value. MD simulations will directly provide all three order parameter values.
Materials
Pyrene-d10 was purchased from Cambridge Isotope Laboratories (Andover, MA), and POPC from Avanti Polar Lipids (Alabaster, AL). CHCl3 was purchased from Merck (Darmstadt, Germany) and water was deionized and filtered with a Milli-Q water purification system from Millipore (Bedford, MA).
Sample preparation
An oriented NMR sample was prepared by dissolving 3.4 mg of pyrene-d10 in 4.00 ml of CHCl3; 400 μl of the solution was added to 30.6 mg of POPC, giving a lipid-pyrene mixture with 4.0% (mol/mol) of pyrene, corresponding to the concentration of pyrene in the computer simulation box (see below). The solution was spread on 20 thin glass plates with dimensions of 18 mm × 7.5 mm × 0.08 mm (Marienfeld Laboratory Glassware, Lauda-Koenigshofen, Germany) and dried in air for 1 h and then under vacuum for an additional 12 h. The dried glass plates were stacked and placed in a hydration chamber over a saturated K2SO4 solution at 30°C (98% relative humidity) for 36 h. The stack was then wrapped in parafilm and plastic foil to maintain full hydration during the NMR measurements.
NMR spectroscopy
NMR experiments were carried out on a Bruker Avance 500 MHz NMR spectrometer (Bruker Biospin, Karlsruhe, Germany) at 300 K. 31P-NMR measurements were performed at a frequency of 202.5 MHz using a Hahn echo sequence with phase cycling according to Rance and Byrd (1983), with a 7 μs 90° pulse, 30 μs echo time, 2 s relaxation delay time, 100 kHz spectral width, 4096 data points, and proton decoupling using tppm20 (Bennett et al., 1995); 128 scans were collected, and spectra were processed using the Xwinnmr software from Bruker by offset correction, zero filling to 16384 data points, and a 100 Hz exponential multiplication before Fourier transformation. 2H-NMR experiments were performed at 76.77 MHz using a quadrupolar echo sequence (Davis et al., 1976) with a 4.5 μs 90° pulse, an echo delay of 30 μs, 200 ms relaxation delay time, 500 kHz spectral width, and 4096 data points; 100,000 scans were collected. Acquisition was started before the echo, and the time domain data was left-shifted to obtain the free induction decay starting at the echo maximum before further processing by zero filling to 16384 data points, and a 200 Hz exponential multiplication followed by Fourier transformation.
Molecular dynamics simulations
Simulation setup. A fully hydrated, equilibrated POPC membrane (Tieleman et al., 1998), consisting of 128 POPC molecules and 4480 water molecules, was used as a starting structure. Five pyrene molecules were placed in different positions and with different alignments into the box, four inside the POPC membrane, one outside in the aqueous phase. The box size was 6 nm × 6 nm × 7 nm. The starting and final configurations are shown in Fig. 2. The simulation box is described by the coordinate system XYZ with the Z axis along the lipid bilayer normal.
FIGURE 2.

Snapshot of the MD simulation starting configuration (left) at t = 0 ns, and the configuration (right) at t = 20 ns of the simulated box. The five pyrene molecules are shown as space filled in gray. Lipids are shown as sticks without hydrogen atoms, and with headgroup phosphates in black.
Lipid force field parameters were used as described by Berger et al. (1997), and single point charge water was used to model the water (Berendsen, 1981). For the pyrene molecule, explicit hydrogen atoms were chosen (Fig. 1 A). The molecular dynamics studies were run on a dual processor desktop personal computer under Linux, using software package GROMACS 3.0.5 (Lindahl et al., 2001). A time span of 25 ns was simulated. For the calculations, the leap-frog algorithm was used with a time step of 2 fs. Positions were saved every 250 steps for data analysis. A twin-range cutoff radius was used with a cutoff of 1.8 nm for electrostatic interactions and 1.0 nm for van der Waals interactions. The bilayer simulation was done by constant anisotropic pressure of 1 bar and a temperature of 300 K. Temperature and pressure were kept constant using weak coupling (Berendsen et al., 1984), with a coupling constant of τp = 1.0 ps for pressure coupling and τt = 0.1 ps for temperature coupling.
Analysis. The orientation of the C-H bonds can be described by the angle θ between the intramolecular bond vector and the Z axis of the system. When analyzing an oriented NMR sample, this angle between the C-D bond and the external magnetic field determines the deuterium quadrupolar splitting as described above. It is thus possible to calculate for each C-H bond an order parameter SCD = <½(3cos2θ − 1)> from the simulated data, which can be compared with the SCD value obtained from the quadrupolar splitting Δvq of the corresponding 2H-NMR experiments. The bond parameter SCD was calculated for each C-H bond in all pyrene molecules by averaging over all time steps.
To describe the whole molecule, a normal order parameter Szz was calculated as Szz = 〈½(3cos2θzz − 1)〉, where θzz is the angle between the normal of the pyrene ring plane and the lipid bilayer normal. Similarly, the order parameter Sxx is calculated as the average orientation of the vector from carbon atom 1 to 1′, and Syy is calculated as the average orientation of the vector from carbon atom 3′ to 3″′ (Fig. 1 A).
The area per lipid was calculated from the size of the box in the X direction multiplied with the size of the box in the Y direction and divided by the number of POPC molecules in the XY plane, ignoring the presence of pyrene molecules.
RESULTS
NMR
Bilayer orientation
Macroscopically aligned NMR samples were prepared, and the quality of the orientation of the phospholipid bilayers on glass plates was checked with 31P-NMR. When the glass plates are oriented with the sample normal parallel to the magnetic field direction (Fig. 3), the peak close to 20 ppm corresponds to well-oriented lipids, whereas the broader signal with a peak around −12 ppm corresponds to unoriented lipid bilayers. By integrating the areas under the two parts of the spectrum, the degree of orientation was estimated to be ∼60%.
FIGURE 3.

31P-NMR spectrum of an oriented sample of fully hydrated POPC containing 4% (mol/mol) pyrene-d10.
Bond order parameter SCD
In the 2H-NMR spectrum of the pyrene-d10/POPC system, with the bilayer normal oriented parallel to the magnetic field direction (Fig. 4, upper panel), a number of quadrupolar splittings can be seen, which are labeled A, A′, B, and B′. The splittings and intensities for each pair of peaks are listed in Table 1. It should be noted that the splittings of peaks A′ and B′ are half the magnitude of peaks A and B, respectively. In the case when the bilayer normal is oriented perpendicular to the magnetic field direction (Fig. 4, lower panel, and Table 1), only two dominant splittings are observed, corresponding to A′ and B′ of the parallel spectrum.
FIGURE 4.
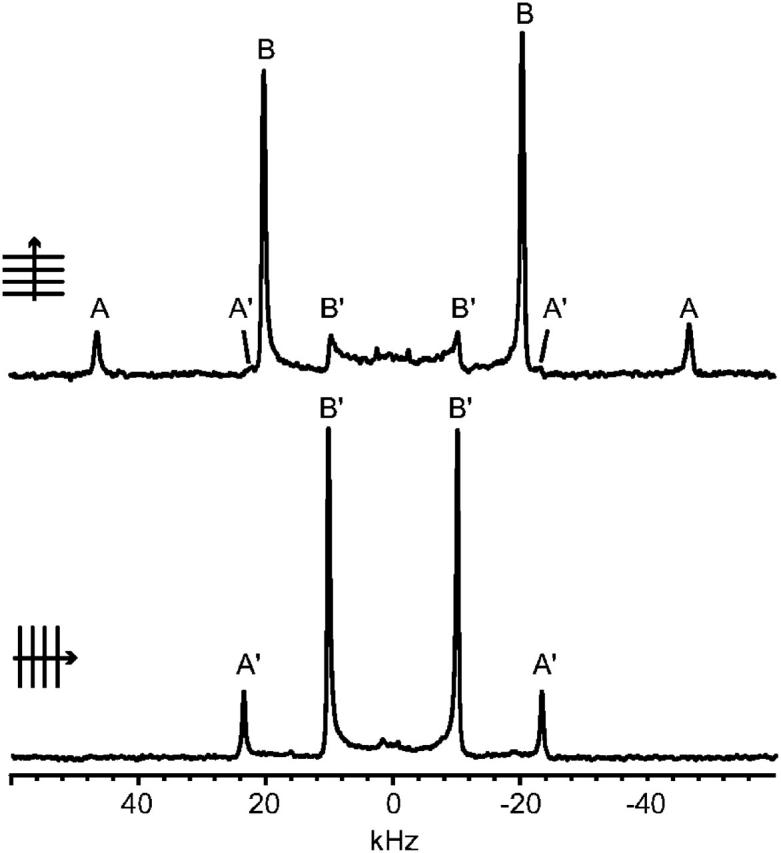
2H-NMR spectra of an oriented sample of pyrene-d10 in POPC. (Upper part) Bilayer normal oriented parallel to the static magnetic field direction. (Lower part) Bilayer normal oriented perpendicular to the magnetic field direction.
TABLE 1.
2H-NMR quadrupolar splittings
| Peak label* | A | A′ | B | B′ |
|---|---|---|---|---|
| Parallel sample orientation | ||||
| Splitting/kHz | 93.0 | 46.0 | 40.5 | 20.0 |
| Intensity† | 14 | 3 | 100 | 12 |
| Perpendicular sample orientation | ||||
| Splitting/kHz | — | 46.5 | — | 20.0 |
| Intensity† | 21 | 100 |
Labels given in Fig. 4.
Sum of the intensities for the two peaks of each splitting, as percentage of the highest intensity in the spectrum.
When a molecule is rotating fast around the bilayer normal, the splitting of a deuterium nucleus will be half at the perpendicular sample orientation as compared to the parallel sample orientation (Killian et al., 1992; Van der Wel et al., 2002). In a powder sample, the main peak corresponds to the perpendicular position. The 2H-NMR peaks in the sample oriented with the bilayer normal parallel to the magnetic field are thus assigned to well-oriented parts of the sample (peaks A and B) and to unoriented powder contributions (A′ and B′). In the sample with the bilayer normal perpendicular to the magnetic field, the oriented and unoriented peaks from each deuterium site overlap, giving only one doublet for each site. We therefore conclude that there exist two deuterium populations, with quadrupolar splittings of 93 kHz and 40 kHz, respectively.
Given the symmetry of the pyrene molecule, there are three chemically different deuterium sites, denoted 1, 2, and 3 in Fig. 1 A. However, the quadrupolar splitting depends only on the geometric arrangement of the C-D bonds. Therefore, we can expect the same splitting for bonds 2 and 3, since their bond vectors are colinear. From Fig. 1 A, we also see that 2 and 2′, or 3 and 3′, are parallel, meaning that all these four deuterium nuclei give the same splitting. Similarly, 2″, 2″′, 3″, and 3″′ give one splitting, and 1 and 1′ give one splitting. We thus expect three different splittings, with relative intensities of 1:2:2 (for 1/1′:2/2′/3/3′:2″/2″′/3″/3″′).
In the 2H-NMR spectrum, only two splittings are present, with relative intensities of ∼1:5. This can be explained as splitting A originating from deuterium at site 1/1′, and splitting B from deuterium at all other sites, with expected relative intensities of 1:4. This would be the result if the molecule can rotate around the molecular x axis, so that, for example, positions 2 and 2″ will be averaged to give the same splittings. The slightly reduced intensity of splitting A could be due to the excitation profile of the nonideal 90° pulse (4.5 μs), giving a slightly reduced intensity of the outermost signals.
From Eq. 1, assuming (3/2)QCC = 290 kHz, the experimental splitting A yields a bond order parameter  and splitting B gives
  It should be noted that since the sign of the quadrupolar coupling cannot be determined from the NMR spectrum, the sign of SCD is unresolved.
Ordering tensor
We can also obtain the molecular ordering tensor elements from Eq. 4. Looking at the deuteron at position 1, it can be noted that in this case the a axis, along the C-D bond, is also along the molecular x axis, giving  For the deuteron at position 2, the angle between the a axis and the x axis is close to 60°, and between a and y it is close to 30°. We get two equations for the two unknown quantities; solving these using QCC = 193 kHz, we obtain four possible solutions, depending on the signs of the two splittings. The only solution compatible with the results from Shilstone and Zannoni (1989) is the one corresponding to both splittings being positive, giving Szz = −0.42 and (Sxx − Syy) = 0.25.
Simulations
Positions. Although the five pyrene molecules were initially placed at different positions inside and outside the membrane, within 8 ns all molecules moved to a region inside the membrane near the headgroups. After the molecules reached this region, no further systematic movement along the bilayer normal is detected (Fig. 5 C). There is no trend for the pyrene molecules to move from one monolayer leaflet of the membrane across the hydrophobic core to the other half.
FIGURE 5.
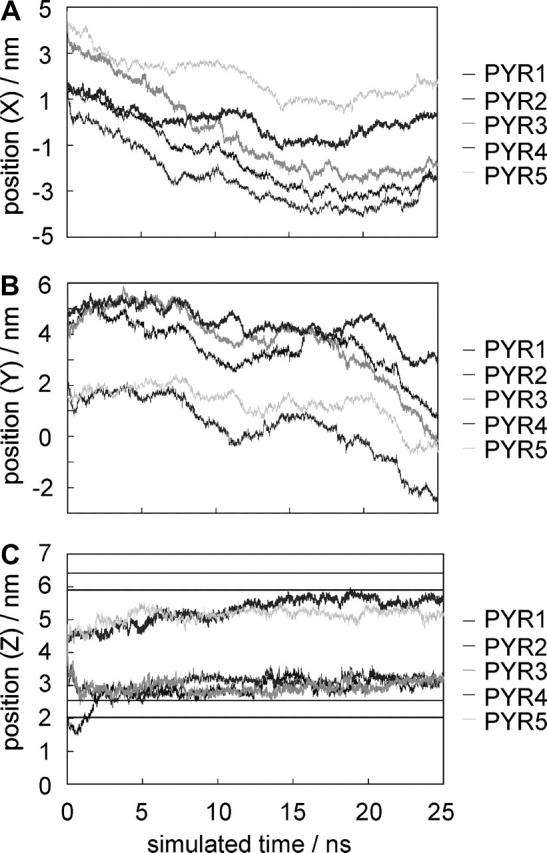
Positions of the center of mass of the five pyrene molecules in X (A), Y, (B) and Z directions (C) during the MD simulation. The lines in C indicate the headgroup region.
Bond order parameter SCD. For each C-D bond vector, a time-averaged orientation was calculated over three different time spans of the simulation, namely 5–10 ns, 10–15 ns, and 15–25 ns. Values of SCD for each bond in each pyrene molecule for the final period of 10 ns are listed in Table 2.
TABLE 2.
Values of the bond order parameters 〈SCD〉, averaged over the last 10 ns (15–25 ns) of the simulation for all C-H bonds of the five individual pyrene molecules

The last row, ≪SCD≫, shows the mean values  and
and  which are averages of the geometrically equivalent types of C-H bonds in the five pyrene molecules.
In terms of geometry, we can distinguish five different pairs of C-H bonds in a pyrene molecule: 1/1′, 2/2′, 3/3′, 2″/2″′, and 3″/3″′. SCD for 1/1′ is denoted  For geometric reasons (see Fig. 1 A), SCD at positions 2/2′ and 3/3′ have always nearly the same values, so these can be combined to give
  Similarly, SCD for positions 2″/2″′ and 3″/3″′give
  A rotational motion around the normal of the molecular plane would not affect these three parameters. A rotation around the long axis (1/1′) would interconvert the two parameters
  and
and  As this movement is observed to take place in the simulations, it is reasonable to average
  and
and  to one parameter,
  Table 3 summarizes the two parameters,
  and
and  resulting from the averaging over molecules, bonds, and over time, and for comparison the parameters
  and
and  from the NMR experiments are also listed.
TABLE 3.
Parameters  and
and  =
=  calculated from the simulation over three different time periods, compared with
  and
and  obtained from the NMR experiment
| 5–10 ns | 10–15 ns | 15–25 ns | NMR* | ||
|---|---|---|---|---|---|
 |
0.42 | 0.35 | 0.30 |  |
±0.32 |
 |
0.06 | 0.10 | 0.11 |  |
±0.14 |
Only the absolute value is determined by 2H-NMR.
Ordering tensor. The ordering tensor elements Sxx, Syy, and Szz, as well as (Sxx-Syy), were calculated for each pyrene molecule. Averages over the last 10 ns of the simulation when the area per lipid is converging (see Fig. 6) are summarized in Table 4. The average value over all five pyrene molecules is 0.33 for Sxx and 0.07 for Syy. This gives (Sxx-Syy) = 0.26, which is close to the NMR result of 0.25. The average value of Szz is −0.40. The sum Sxx + Syy + Szz is also very close to the theoretical value of zero. Fig. 7 shows the values of Szz for each molecule as a function of simulation time. Values of Szz near −0.5 mean that the normal of the pyrene molecular plane is oriented perpendicular to the Z axis of the simulation box (see Fig. 1). Inside the membrane, the pyrene planes tend to arrange parallel to the bilayer normal. Nevertheless, a bending to one or the other side is also possible (e.g., PYR2). PYR1 was placed outside the membrane into the aqueous phase at the start of the simulation. Although it is still outside the membrane (the first 5 ns of the simulation), it can rotate freely, and values between −0.5 and 1 are possible.
FIGURE 6.

Area per lipid in nm2 during the simulation period.
TABLE 4.
Molecular ordering tensor elements of pyrene in POPC bilayers for the five molecules, averaged over the last 10 ns (15–25 ns) of the simulation, compared with the NMR results
| Order parameter | PYR1 | PYR2 | PYR3 | PYR4 | PYR5 | Average | NMR |
|---|---|---|---|---|---|---|---|
| Sxx | 0.38 | 0.25 | 0.47 | 0.25 | 0.31 | 0.33 | |
| Syy | 0.05 | 0.17 | −0.02 | 0.14 | 0.02 | 0.07 | |
| Szz | −0.43 | −0.41 | −0.44 | −0.40 | −0.33 | −0.40 | −0.42 |
| Sxx−Syy | 0.34 | 0.08 | 0.49 | 0.11 | 0.29 | 0.26 | 0.25 |
FIGURE 7.

Orientation of the normal of the molecular plane with respect to the Z axis (Szz) over the simulation time for all five pyrene molecules.
Alignment of the long axis. Besides ordering tensors, we also calculated the angle between the pyrene molecular long axis (the 1/1′ vector) and the membrane bilayer normal (the Z axis). The angle was calculated for each time step and a histogram was made, showing that most angles were found between 0° and 30° or between 150° and 180°. Each box in the histogram corresponds to the vector pointing into a round stripe of the unit sphere, and the different areas of the stripes were corrected by dividing the histogram value of each box with sinθ, where θ is the angle in the middle of the box. The normalized angle distribution is shown in Fig. 8, and from this is it clear that the preferred orientation (the orientation corresponding to the lowest energy) of the molecular long axis is along the bilayer normal.
FIGURE 8.

Normalized angle distribution of the angle between the molecular long axis 1/1′ and the Z axis (membrane normal). Values over the whole simulation time were taken into account.
DISCUSSION
The observed intensities of the 2H-NMR lines have allowed an assignment of the C-D bonds that were individually observable by MD. Thus the values of the averaged bond order parameters  and
and  listed in Table 3, are directly comparable with the experimental values
  and
and  respectively, from NMR. Toward the end of the simulation, these values become very similar to one another.
The fact that the results fit so well indicates that the NMR results can be explained virtually completely by very fast motions. When a small hydrophobic molecule is dissolved in a lipid bilayer, many different motions can be expected. There are very fast motions like vibrations, slower rotational diffusion around different axes, even slower lateral diffusion, cooperative effects of lipid molecular motions, dynamics of the whole bilayer, etc. In a 2H-NMR observation, the signal from 1019 molecules is averaged in the free induction decay over several milliseconds, which includes the effect of most kinds of motions. In MD simulations, on the other hand, usually only a few nanoseconds can be taken into account for a small number of individual molecules. Therefore, many of the slower motions observed by NMR cannot be seen in the simulation. Thus it is unexpected that even a few nanoseconds of simulation seem to be enough to cover all types of motions that pyrene performs inside a lipid bilayer.
Three consecutive simulation periods of 5 and 10 ns duration each are separately analyzed and compared in Table 3. The differences of the respective time-averages and their improved match with the NMR values toward the end of the simulation can be explained by several reasons. As long as the pyrene molecules are still moving from the outside to the inside of the membrane or within the membrane, the results from the simulations are not exactly comparable with NMR results, where the whole system is in equilibrium. In the first 8 ns, the pyrene molecules still diffuse along the Z axis toward their preferred residue place inside the membrane (Fig. 5 C). Due to the errors resulting from using a twin-range cutoff (Anezo et al., 2003), the area per lipid molecule decreases over the first 15 ns of simulation (Fig. 6). This causes an overall artificial motion of the POPC molecules along the X axis and the Y axis of the box. The pyrene molecules are dragged along with the lipid molecules (Fig. 5, A and B). After 15 ns, the area per lipid has converged, and no artificial motion of lipid or pyrene molecules can be detected. Now the simulated system is very close to the equilibrium state of the NMR sample, and the time-averaged values from the final 15–25 ns period of the simulation fits best with the NMR results. Longer simulation times and extended averaging spans would support these results even better.
Further differences between simulation and experimental results may be related to the choice of QCC values. The NMR order parameters SCD (Eq. 1) are calculated using an estimated QCC value from the literature. This parameter has not been determined for pyrene and must be estimated. There are possible values in the literature from similar molecules, between 181 kHz and 198 kHz, depending on the molecule and method used (Millett and Dailey, 1972). The value of QCC = 193 kHz used here was determined from polycrystalline benzene (Rowell et al., 1965).
Like the bond order parameter, the ordering tensor elements from simulation and experiment, shown in Table 4, also match up very well. These results can be compared to the values found for pyrene in a liquid crystal system using both 2H-NMR (Shilstone and Zannoni, 1989) and 13C-NMR (Hagemeyer et al., 1994). Szz values up to ∼−0.43, depending on the temperature, were found. Other aromatic compounds in lipid bilayers also show similar values. Mukhopadhyay et al. (2004) studied PCP in POPC and POPE bilayers by molecular dynamics simulations. They determined the angle between the normal of the aromatic ring and the bilayer normal to be 70–80°, which would correspond to Szz values between −0.32 and −0.45. They suggested that the tilt of the molecular plane is influenced by the packing density of the lipids and the tilt of the acyl chains.
From Fig. 8, it can be seen that pyrene shows a preferred alignment with the 1/1′ axis oriented more or less parallel to the bilayer normal with a margin of ±30°. A perpendicular alignment of the 1/1′ axis with respect to the bilayer is relatively scarce. This observation suggests that planar molecules tend to arrange themselves parallel to the alignment of the acyl chains, thereby minimizing the perturbation of the lipid chains.
The position of pyrene near the headgroups seems to be the favored region for these aromatic molecules inside a lipid membrane. Experimental studies with fluorescence methods confirm this behavior. Herrenbauer determined the preferred location of pyrene in phospholipid bilayers by depth-sensitive fluorescence quenching to be in the region of the fifth and sixth carbon atom of the acyl chain. The quenching effect with brominated lipids labeled at the fifth and sixth carbon atom was noticeably higher than that with unmarked lipids or lipids labeled at other carbon atoms (Herrenbauer, 2002).
Pyrene is a very hydrophobic molecule, so the first assumption might be that these molecules should be found in the most hydrophobic part of the bilayer, i.e., the middle of the membrane. The absence of pyrene in the hydrophobic core might be due to entropic reasons. In the middle of the membrane, the acyl chains are in high disorder, resembling liquid hexane (Marrink and Berendsen, 1994). The presence of large, rigid molecules such as pyrene would force the acyl chains to arrange themselves around the molecule, and it would reduce the mobility of the chain ends. This would decrease entropy; thus it is more favorable to accommodate pyrene in the region closer to the headgroup, where the chain order is higher. The observation that PAH dyes tend to accumulate inside highly ordered phases in liposomes (Baumgart et al., 2003) support these suggestions. Looking at MD simulations with benzene, we find similar phenomena. In DMPC bilayers, benzene shows a temperature dependence in its preferred position, as it relocates from the bilayer core to the upper acyl chain region with increasing temperature (Bassolino-Klimas et al., 1993, 1995). The authors explain this on the one hand with the distribution of free voids, which are concentrated in the middle of the membrane at low temperature, and on the other hand with a higher entropy penalty for benzene when residing in the middle of the membrane at high temperatures, because then the chain ends show a higher mobility.
Besides entropic considerations, other effects may also play a role. There are many hints in literature that aromatic compounds do not act like completely hydrophobic molecules. For benzene, it is well established that is has a large permanent quadrupole moment, leading to a negative partial charge within the ring and a positive partial charge at the hydrogen atoms (Dougherty, 1996). Though no such calculations could be found for pyrene, it is a reasonable assumption that this effect also occurs in other aromatic compounds. So interactions with partial charges or charged groups are favorable. It has also been suggested that aromatic rings can act as hydrogen bond acceptors (Levitt and Perutz, 1988). Nishio (2004) describes several examples for CH/π-hydrogen bonds, among others in liquid crystals. A related effect is the so-called cation-π interaction. These effects can be detected in various organic systems, especially in proteins, where side-chain interactions between amino acid and aromatic groups occur (Ma and Dougherty, 1997). For example, the structure of α-helical peptides composed of Trp/Arg, are stabilized by cation-π interactions (Shi et al., 2002). The accumulation of pyrene in a region of high molecular order near the lipid headgroups may thus be the result of a mixture of all these effects. In the simulations, however, pyrene is not polarizable, and only the hydrogen atoms and the carbons bonded to them have small partial charges. Interactions with induced charges, and interactions involving quadrupole and higher moments due to π electrons, are not represented.
CONCLUSIONS
From simulations and 2H-NMR measurements, we determined the orientation of pyrene in a POPC bilayer. The planar molecule arranges itself parallel to the membrane normal. Moreover, it shows a preferred upright alignment of the molecular 1/1′ long axis. Consequently, perturbation of the acyl chains is minimized. A preferred location of pyrene inside the membrane could be determined from the simulations. Although pyrene is a very hydrophobic molecule, it is found mainly in the highly ordered upper acyl chain region near the lipid headgroups and not in the middle of the membrane, which is the most hydrophobic part. This could be explained considering the high disorder and flexibility of the acyl chain ends, as entropic effects, disfavoring the presence of pyrene in the middle of the membrane. Additionally, enthalpic effects may play a role, such as possible interactions of the π-electron system with its molecular environment. Despite the differences in timescale and the small number of molecules in the MD simulations, the NMR and simulation results agree very closely. Order parameters describing the alignment of the molecular plane and the molecular long axis with respect to the bilayer normal vary only in the second decimal place. This close agreement suggests that all important modes of motion are already averaged on the nanosecond timescale of the molecular dynamics simulation and that the comparison is best when the MD simulation has reached an equilibrium state. This finding is one of the most compelling experimental validations of MD simulations of small molecules in lipid bilayers to date.
Acknowledgments
B.H. is supported by the Deutsche Forschungsgemeinschaft. E.S. and A.S.U. acknowledge the Forschungszentrum Karlsruhe and the Center for Functional Nanostructures. D.P.T. is a Scholar of the Alberta Heritage Foundation for Medical Research. Work in D.P.T.'s group is supported by the National Science and Engineering Research Council of Canada.
References
- Abragam, A. 1983. The Principles of Nuclear Magnetism. Oxford University Press, Oxford.
- Anezo, C., A. H. de Vries, H.-D. Holtje, D. P. Tieleman, and S.-J. Marrink. 2003. Methodological issues in lipid bilayer simulations. J. Phys. Chem. B. 107:9424–9433. [Google Scholar]
- Bassolino-Klimas, D., H. E. Alper, and T. R. Stouch. 1993. Solute diffusion in lipid membranes: an atomic level study by molecular dynamics simulation. Biochemistry. 32:12624–12637. [DOI] [PubMed] [Google Scholar]
- Bassolino-Klimas, D., H. E. Alper, and T. R Stouch. 1995. Mechanism of solute diffusion through lipid bilayer membranes by molecular dynamics simulation. J. Am. Chem. Soc. 117:4118–4129. [DOI] [PubMed] [Google Scholar]
- Baumgart, T., S. T. Hess, and W. W. Webb. 2003. Imaging coexisting fluid domains in biomembrane models coupling curvature and line tension. Nature. 425:821–824. [DOI] [PubMed] [Google Scholar]
- Bemporad, D., J. W. Essex, and C. Luttmann. 2004. Permeation of small molecules through a lipid bilayer: a computer simulation study. J. Phys. Chem. B. 108:4875–4884. [Google Scholar]
- Bennett, A. E., C. M. Rienstra, M. Auger, K. V. Lakshmi, and R. G. Griffin. 1995. Heteronuclear decoupling in rotating solids. J. Chem. Phys. 103:6951–6958. [Google Scholar]
- Berendsen, H. J. C. 1981. H2O interaction models for water in relation to protein hydration. In Intermolecular Forces. B. Pullmann, editor. D. Reidel Publishing, Dordrecht, The Netherlands.
- Berendsen, H. J. C., J. P. M. Postma, W. F. van Gunsteren, A. DiNola, and J. R. Haak. 1984. Molecular dynamics with coupling to an external bath. J. Chem. Phys. 81:3684–3690. [Google Scholar]
- Berger, O., O. Edholm, and F. Jähnig. 1997. Molecular dynamics simulations of a fluid bilayer of dipalmitoylphosphatidylcholine at full hydration, constant pressure, and constant temperature. Biophys. J. 72:2002–2013. [DOI] [PMC free article] [PubMed] [Google Scholar]
- Cuno, M., B. Weigert, J. Behrendt, and U. Wiesmann. 1995. Biodegradation of oil/water-emulsions and polycyclic aromatic hydrocarbons (PAH). Vom Wasser. 84:105–116. [Google Scholar]
- Daems, D., M. Van den Zegel, N. Beons, and F. C. De Schryver. 1985. Fluorescence decay of pyrene in small and large unilamellar L, α-dipalmitoylphosphatidylcholine vesicles above and below phase transition temperature. Eur. Biophys. J. 12:97–105. [DOI] [PubMed] [Google Scholar]
- Davis, J. H., K. R. Jeffrey, M. Bloom, M. I. Valic, and T. P. Higgs. 1976. Quadrupolar echo deuteron magnetic-resonance spectroscopy in ordered hydrocarbon chains. Chem. Phys. Lett. 42:390–394. [Google Scholar]
- Dougherty, D. A. 1996. Cation-π interactions in chemistry and biology: a new view of benzene, Phe, Tyr and Trp. Science. 271:163–168. [DOI] [PubMed] [Google Scholar]
- Emsley, J. W. 1996. Liquid crystals: general considerations. In Encyclopedia of NMR. D. M. Grant and R. K. Harris, editors. Wiley, New York. 2788–2799.
- Emsley, J. W., and J. C. Lindon. 1975. NMR Spectroscopy Using Liquid Crystal Solvents. Pergamon Press, Oxford.
- Feller, S. E. 2000. Molecular dynamics simulations of lipid bilayer. Curr. Opin. Colloid Interface Sci. 5:217–223. [Google Scholar]
- Hagemeyer, A., R. Tarroni, and C. Zannoni. 1994. Determination of orientational order parameters in liquid crystals from temperature-dependent 13C NMR experiments. J. Chem. Soc. Faraday Trans. 90:3433–3442. [Google Scholar]
- Herrenbauer, M. 2002. Biosorption of Polycyclic Aromatic Hydrocarbons (PAH) to Microorganisms and Liposomes. Shaker Verlag, Aachen, Germany.
- IARC. 1983. Polynuclear aromatic compounds, Part 1: Chemical, environmental and experimental data. IARC monographs on the evaluation of the carcinogenic risk of chemicals to humans. 32. Lyon, France. [PubMed]
- Jedlovszky, P., and M. Mezei. 2003. Effect of cholesterol on the properties of phospholipid membranes. 2. Free energy profile of small molecules. J. Phys. Chem. B. 107:5322–5332. [Google Scholar]
- Killian, J. A., M. J. Taylor, and R. E. Koeppe, Ii. 1992. Orientation of the valine-1 side chain of the gramicidin transmembrane channel and implications for channel functioning. A 2H NMR study. Biochemistry. 31:11283–11290. [DOI] [PubMed] [Google Scholar]
- Koubi, L., M. Tarek, M. L. Klein, and D. Scharf. 2000. Distribution of halothane in a dipalmitoylphosphatidylcholine bilayer from molecular dynamics calculations. Biophys. J. 78:800–811. [DOI] [PMC free article] [PubMed] [Google Scholar]
- Levitt, M., and M. F. Perutz. 1988. Aromatic rings act as hydrogen bond acceptors. J. Mol. Biol. 201:751–754. [DOI] [PubMed] [Google Scholar]
- Lindahl, E., B. Hess, and D. van der Spoel. 2001. GROMACS 3.0: A package for molecular simulation and trajectory analysis. J. Mol. Model. 7:306–317. [Google Scholar]
- Ma, J. C., and D. A. Dougherty. 1997. The cation-π interaction. Chem. Rev. 97:1303–1324. [DOI] [PubMed] [Google Scholar]
- MacCallum, J. L., P. Mukhopadhyay, H. Luo, and D. P. Tieleman. 2003. Large scale molecular dynamics simulations of lipid-drug interactions. In Proceedings of the 17th Annual International Symposium on High Performance Computing Systems and Applications and the OSCAR Symposium. D. Senechal, editor. NRC Research Press, Ottawa, Canada.
- Marrink, S. J., and H. J. C. Berendsen. 1994. Simulation of water transport through a lipid membrane. J. Phys. Chem. 98:4155–4168. [Google Scholar]
- Martins, J., and E. Melo. 2001. Molecular mechanism of lateral diffusion of py10-PC and free pyrene in fluid DMPC bilayers. Biophys. J. 80:832–840. [DOI] [PMC free article] [PubMed] [Google Scholar]
- Millett, F. S., and B. P. Dailey. 1972. NMR determination of some deuterium quadrupole coupling constants in nematic solutions. J. Chem. Phys. 36:3249–3256. [Google Scholar]
- Mukhopadhyay, P., H. J. Vogel, and D. P. Tieleman. 2004. Distribution of pentachlorophenol in phospholipid bilayers: a molecular dynamics study. Biophys. J. 86:1–9. [DOI] [PMC free article] [PubMed] [Google Scholar]
- Neff, J. M. 1979. Polycyclic Aromatic Hydrocarbons in the Aquatic Environment. Sources, Fates and Biological Effects. Applied Science Publishers, Barking, UK.
- Nishio, M. CH/π hydrogen bonds in crystals. 2004. Cryst. Eng. Comm. 6:130–158. [Google Scholar]
- Petrasek, A. C., I. J. Kugelman, B. M. Austern, T. A. Pressley, L. A. Winslow, and R. H. Wise. 1983. Fate of toxic organic compounds in wastewater treatment plants. Res. J. Water Pollut. C. 55:1286–1296. [Google Scholar]
- Rance, M., and R. A. Byrd. 1983. Obtaining high-fidelity spin-1/2 powder spectra in anisotropic media: phase-cycled Hahn echo spectroscopy. J. Magn. Reson. 52:221–240. [Google Scholar]
- Rowell, J. C., W. D. Phillips, L. R. Melby, and M. Panar. 1965. NMR studies of some liquid crystal systems. J. Chem. Phys. 43:3442–3454. [Google Scholar]
- Saiz, L., S. Bandyopadhyay, and M. L. Klein. 2002. Towards an understanding of complex biological membranes from atomistic molecular dynamics simulations. Biosci. Rep. 22:151–173. [DOI] [PubMed] [Google Scholar]
- Saupe, A. 1964. Nuclear resonances in crystalline liquids and in liquid crystalline solutions. Part I. Z. Naturforschg. 19a:161–171. [Google Scholar]
- Saupe, A. 1968. Recent results in the field of liquid crystals. Angew. Chem. Int. Edit. 7:97–112. [Google Scholar]
- Seelig, J. 1978. 31P nuclear magnetic resonance and head group structure of phospholipids in membranes. Biochim. Biophys. Acta. 515:105–140. [DOI] [PubMed] [Google Scholar]
- Seelig, J., and N. Waespe-Sarcevic. 1978. Molecular order in cis and trans unsaturated phospholipid bilayers. Biochemistry. 17:3310–3315. [DOI] [PubMed] [Google Scholar]
- Shi, Z., C. A. Olson, and N. R. Kallenbach. 2002. Cation-π interaction in model α-helical peptides. J. Am. Chem. Soc. 124:3284–3291. [DOI] [PubMed] [Google Scholar]
- Shilstone, G. N., and C. Zannoni. 1989. Solute alignment in liquid crystal solvents. The Saupe ordering matrix for perylene and pyrene. Liq. Cryst. 6:303–317. [Google Scholar]
- Tieleman, D. P., S. J. Marrink, and H. J. C. Berendsen. 1997. A computer perspective of membranes: molecular dynamics studies of lipid bilayers systems. Biochim. Biophys. Acta. 1331:235–270. [DOI] [PubMed] [Google Scholar]
- Tieleman, D. P., L. R. Forrest, M. S. P. Sansom, and H. J. C. Berendsen. 1998. Lipid properties and the orientation of aromatic residues in OmpF, influenza M2 and alamethicin systems: molecular dynamics simulations. Biochemistry. 37:17554–17561. [DOI] [PubMed] [Google Scholar]
- Ulander, J., and A. D. J. Haymet. 2003. Permeation across hydrated DPPC lipid bilayers: simulation of the titrable amphiphilic drug valproic acid. Biophys. J. 85:3475–3484. [DOI] [PMC free article] [PubMed] [Google Scholar]
- Ulrich, A. S., M. P. Heyn, and A. Watts. 1992. Structure determination of the cyclohexene ring of retinal in bacteriorhodopsin by solid-state deuterium NMR. Biochemistry. 31:10390–10399. [DOI] [PubMed] [Google Scholar]
- Ulrich, A. S., I. Wallat, M. P. Heyn, and A. Watts. 1995. Re-alignment of the retinal chromophore in the M-photointermediate of bacteriorhodopsin. Nat. Struct. Biol. 2:190–192. [DOI] [PubMed] [Google Scholar]
- Ulrich, A. S., and S. L. Grage. 1998. 2H NMR. In Solid State NMR of Polymers. I. Ando and T. Asakura, editors. Elsevier Science, Amsterdam.
- Van der Wel, P. C. A., E. Strandberg, J. A. Killian, and R. E. Koeppe 2nd. 2002. Geometry and intrinsic tilt of a tryptophan-anchored transmembrane α-helix determined by 2H NMR. Biophys. J. 83:1479–1488. [DOI] [PMC free article] [PubMed] [Google Scholar]