

Abstract
In the recombination process of Photosystem II  the limiting step is the electron transfer from the reduced primary acceptor pheophytin Ph− to the oxidized primary donor P+ and the rate depends on the equilibrium constant between states
  and
and  Accordingly, mutations that affect the midpoint potential of Ph or of P result in a modified recombination rate. A strong correlation is observed between the effects on the recombination rate and on thermoluminescence (TL, the light emission from
  during a warming ramp): a slower recombination corresponds to a large enhancement and higher temperature of the TL peak. The current theory of TL does not account for these effects, because it is based on the assumption that the rate-limiting step coincides with the radiative process. When implementing the known fact that the radiative pathway represents a minor leak, the modified TL theory readily accounts qualitatively for the observed behavior. However, the peak temperature is still lower than predicted from the temperature-dependence of recombination. We argue that this reflects the heterogeneity of the recombination process combined with the enhanced sensitivity of TL to slower components. The recombination kinetics are accurately fitted as a sum of two exponentials and we show that this is not due to a progressive stabilization of the charge-separated state, but to a pre-existing conformational heterogeneity.
INTRODUCTION
Thermoluminescence (TL) is a broadly used technique for analyzing the energetics of charge- separated states in photosynthetic systems (see, for a review, Inoue, 1996; and Vass, 2003, for an historical overview). It consists in freezing some light-induced charge-separated state and monitoring the luminescence emission during a slow warming ramp carried out at constant rate. The method was originally introduced in solid-state physics where a theoretical framework was developed by Randall and Wilkins (1945). This theory assumes that the detrapping process can be described by a single temperature-dependent rate constant with Arrhenius behavior. The reaction scheme is depicted in Fig. 1 and the derivation of the relevant equations (following DeVault et al., 1983) is given in the Appendix.
FIGURE 1.

The reaction scheme in the Randall-Wilkins picture. C1 is the charge-separated state (i.e., D+PA−, where P is the primary pigment donor, D is a secondary electron donor, and A an electron acceptor). It is in rapid equilibrium with the excited state C* (i.e., DP*A), from which recombination to the ground state C0 (DPA) occurs with a limiting rate constant κ. ΔG, ΔH, and ΔS are the activation free energy, enthalpy, and entropy, respectively. A fixed fraction Φ of the recombination process is radiative, giving rise to the luminescence emission.
Various improvements have been proposed to the above scheme, which have no significant quantitative consequences under most relevant cases. The pre-exponential factor s (Eqs. A2–A3) may be modified (Vass et al., 1981) to include the kBT/h factor from absolute rate theory. The process remains, however, dominated by the steep temperature-dependence of the exponential term. DeVault and Govindjee (1990) and DeVault et al. (1983) pointed out that, in general, the photosynthetic recombination process involves an equilibrium between various charge-separated states. This is clearly a more realistic picture for, e.g., the recombination in DCMU-inhibited Photosystem II (PS II), since the excited state of the primary electron donor P* is formed via the radical pair P+Ph− from equilibria on the donor side ( ) and on the acceptor side (
 ). Here, P denotes the primary donor P680 (a cluster of 2–4 weakly coupled chlorophylls), Ph is the primary electron acceptor (pheophytin), S2 and S1 are the oxidized and reduced states of the water oxidase, respectively, YZ is the secondary tyrosine donor, and QA is the quinone acceptor. However, the correction implied by this refinement is, in fact, quite negligible here as in most practical cases, where the charge-separated state with the lowest energy (e.g.,
  ) is the only one to be significantly populated. Irrespective of the involvement of intermediate states, the scheme of Fig. 1 is a good approximation, provided: 1), the intermediate states undergo rapid equilibration compared with their depletion rate; 2), the equilibrium constants are such that the lowest energy state is strongly favored throughout the relevant temperature range; and 3), the recombination reaction coincides with the radiative reaction.
We would like to discuss two types of discrepancies between the above theory and experimental data, focusing on the case of  recombination in PS II. The first problem concerns the TL behavior under conditions where the recombination rate is slowed or accelerated due to a modified equilibrium constant on the acceptor or donor side. As explained below, the scheme of Fig. 1 is unable to account even in a qualitative manner for the observed effects in such cases. A more complete theory, taking into account the various competing recombination routes, must be put forward. The second type of discrepancy is, however, not solved by this more complete theory. It concerns the location of the TL peak, which occurs at a higher temperature than would be expected from the overall rate and temperature-dependence of the
  recombination. We will argue that this is a consequence of the kinetic heterogeneity of PS II recombination.
MATERIALS AND METHODS
Chlamydomonas reinhardtii cultures were grown in TAP medium under dim light. In all experiments except that of Fig. 6, the algae were treated with benzoquinone, to inhibit metabolic activity in the chloroplast and to maintain an oxidized plastoquinone pool. For this treatment, the algal culture was incubated for a few minutes with 300 μM of p-benzoquinone. The algae were then centrifuged, washed, and finally resuspended in 20 mM HEPES at pH 7.2, and 10 μM DCMU. The D1E130L mutant was constructed as described in Dorlet et al. (2001).
FIGURE 6.
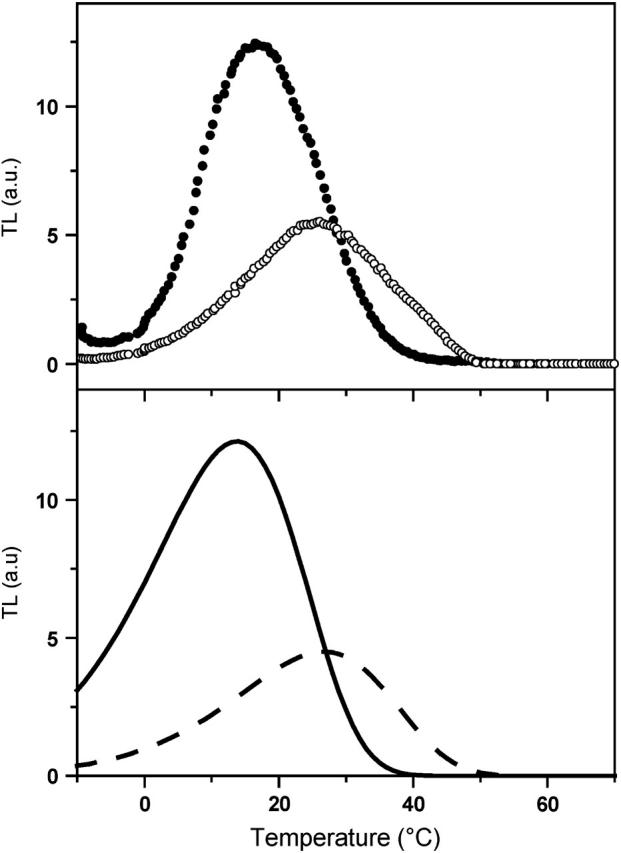
Effect of the membrane potential on thermoluminescence. (Top panel) TL in whole cells of the Chlamydomonas reinhardtii mutant E130L in the absence (solid symbols) and presence (open symbols) of uncouplers (nonactin 1 μM and nigericin 1 μM). The electron transfer inhibitor DCMU (10 μM) was added. The warming rate was B = 0.5° s−1. (Bottom panel) Simulated TL curves according to Eq. 6, assuming B = 0.5° s−1, sr = 1.1 × 10¹⁰ s−1, ΔHex = 670 meV, ΔHr = 690 meV (dashed curve), and ΔHex = 625 meV, ΔHr = 665 meV (solid curve). The latter case corresponds to a membrane potential of 50 mV, assuming that the formation of the P+Ph− state accounts for 50% of the total electrogenicity.
Thylakoids were prepared from market spinach leaves. They were broken in 0.3 M NaCl, 50 mM HEPES at pH 7.2, 5 mM MgCl2, 5 mM Na ascorbate, and 2 gL−1 Bovine Serum Albumin. After centrifugation for 5 min at 5000 × g, the pellet was washed and finally resuspended in 0.3 M Sorbitol, 10 mM NaCl, 5 mM MgCl2, and 20 mM HEPES at pH 7.2. Glycerol (25% v/v) was added for the TL experiment.
To measure the  recombination, we monitored the decay of the chlorophyll fluorescence yield after a single subsaturating flash given to whole cells. Fluorescence was measured with a homebuilt spectrophotometer described in Joliot et al. (1980). The actinic flash was a xenon flash lamp (2 μs at half-height) with a broadband blue filter. It was attenuated so that it induced <5% of the fluorescence yield change caused by a saturating flash. Under such conditions, the fluorescence yield is a quasilinear indicator of the amount of closed centers in the
  state (Cuni et al., 2004). The fluorescence emission was excited by discrete weak monochromatic flashes (450 nm) and detected through a combination of filters rejecting wavelengths <650 nm. Experiments at variable temperature were done in a similar way, using the setup described by Joliot et al. (1997).
Thermoluminescence was measured with a homebuilt apparatus described by Ducruet (2003). The Chl concentration was 40 μg/mL. The sample was dark-adapted for 5 min and then cooled to −20°C, unless stated otherwise. After 2 min, a single saturating flash was fired. The TL was recorded upon heating the sample at a rate of 0.5° s−1.
Mathematical simulations were run using Mathcad 2000i (MathSoft Engineering and Education, Cambridge, MA).
RESULTS AND DISCUSSION
Thermoluminescence from mutants with a modified recombination rate
Fig. 2 shows TL results obtained in DCMU-inhibited cells of the unicellular eukaryotic alga Chlamydomonas reinhardtii. This compares experiments with the wild-type (WT) and the mutant strain E130L, where residue 130 of the D1 subunit has been changed from Glu to Leu. This residue is likely hydrogen-bonded to the pheophytin (Ph) of the active (A) branch of electron transfer (Merry et al., 1998; Dorlet et al., 2001; Rappaport et al., 2002; Ferreira et al., 2004), which is the primary electron acceptor from the excited primary chlorophyll donor P680 (P). In a cyanobacterial strain (Synechocystis sp. PCC6803), the residue found in the WT is a Gln. Mutating it to a Leu was shown to shift the midpoint potential of Phe to a more negative value by ∼80 mV (Merry et al., 1998). In previous work, we showed that the increased ΔG between QA and Ph caused a slowing of the  recombination. Conversely, a smaller ΔG, obtained either in the Gln to Glu mutant, or in the WT by using bromoxynil rather than DCMU as an inhibitor of electron transfer from
  (Krieger-Liszkay and Rutherford, 1998), resulted in an accelerated recombination rate (Rappaport et al., 2002). These effects were explained, in agreement with van Gorkom's analysis (van Gorkom, 1985), by ascribing the predominant recombination route in the WT to the P+Ph− → PPh reaction, which short-circuits the formation of the radiative state P* (via reaction 2 in the scheme of Fig. 3). We obtained similar results with Chlamydomonas WT and mutant strains (Cuni et al., 2004). In particular, the overall recombination rate is slowed ∼11-fold in the E130L mutant with respect to the WT. As shown in Fig. 2, this mutation also results in a drastically modified TL pattern, with an upward shift by ∼20° of the peak temperature Tm and a large enhancement of the amplitude.
FIGURE 2.

Thermoluminescence (Q-band, ascribed to the detrapping of the  state) in whole cells of Chlamydomonas reinhardtii WT (solid squares) and mutant E130L (open circles). The algal suspensions were adjusted at the same chlorophyll concentration, corresponding to similar maximum fluorescence (Fm) yields. The electron transfer inhibitor DCMU (10 μM) and uncouplers (nonactin 1 μM and nigericin 1 μM) were added. The warming rate was B = 0.5° s−1.
FIGURE 3.

Various recombination routes from the  state in PS II. Route 1 is the excitonic (radiative) pathway. Its activation enthalpy is ΔHex. Route 2 is the predominant (indirect) recombination route, with activation enthalpy ΔHr. Route 3 is the direct route, with activation enthalpy ΔHd. It is normally negligible with respect to route 2, but has an increased relative weight when the equilibrium constant between QA and Ph is increased (130L mutants).
In the Randall-Wilkins scheme of Fig. 1, the shift of the Em(Ph) should have no consequence on TL, since the overall ΔH, between  and S1P*PhQA is not changed. This scheme, for that matter, does not account either for the slower recombination, unless the mutation somehow increases the overall ΔH or decreases κ. On the other hand, both effects on TL and recombination rate are readily accounted for by the scheme of Fig. 3. A key feature here is that the excitonic route 1 involving the decay from P* is generally a minor contribution to the overall recombination process, as shown by De Grooth and van Gorkom (1981), who measured a yield of ∼3% for the excitonic route at room temperature. Assuming that the equilibria between the intermediate steps are not rate-limiting, the overall rate constant for recombination is
 |
(1) |
Here, we ascribe subscripts ex, r, and d to recombination routes 1, 2, and 3 in Fig. 3, respectively. Thus, ΔHr, ΔHd, and ΔHex are the enthalpies of states  and S1P*PhQA, respectively, with respect to the state
  At some temperature T, the recombination rate is
 |
(2) |
and the luminescence intensity is
 |
(3) |
 |
(4) |
 |
(5) |
At variance with the Randall-Wilkins scheme, the luminescence intensity is not directly linked to the recombination rate. Rather, it probes the n(T) function with a temperature-dependent sensitivity expressed by kex(T).
As explained above, in the WT PS II, the indirect route (pathway 2 in Fig. 3), is the dominant pathway for charge recombination. Then, kex and kd may be neglected in Eq. 1, yielding a simplified formula for Eq. 5,
 |
(6) |
In this case, Eq. A9 for the determination of Tm becomes
 |
(7) |
The low yield of the excitonic pathway in the WT is due both to a smaller pre-exponential factor (current estimates give sr ≈ 10 sex, see Rappaport et al., 2002) and to the fact that ΔHex > ΔHr. The latter inequality is probably no longer true for the E130L mutant where ΔHr is increased without changing ΔHex. It is probable that in this case the excitonic route represents a significant fraction of the recombination process (∼13% at room temperature, using the parameters given in the legend of Fig. 4). Furthermore, the direct recombination route 3 becomes a significant competitor with respect to the other pathways. In the 130L mutant of Synechocystis (Rappaport et al., 2002) this pathway was actually found predominant, whereas in the homologous Chlamydomonas strain, its weight was estimated to be approximately one-third of the overall recombination at room temperature (Cuni et al., 2004). In such a case, the treatment involving ktot (Eqs. 1–5) is clearly more appropriate than the approximation made to obtain Eq. 6. Nevertheless, this simplified approach suffices to account qualitatively for the enhancement of the TL band in the mutant. Fig. 4 shows a simulation of the TL in the WT and E130L mutants applying either Eq. 5 (solid lines) or Eq. 6 (dashed lines) with the parameters sr, sd, sex, ΔHr, ΔHd, ΔHex derived for these two strains by Cuni et al. (2004). As expected from a larger contribution of the direct and/or excitonic pathways to the recombination process, the differences between the results of Eqs. 5 or 6 were larger when simulating the E130L mutant than the WT. Yet, in both cases the main differences between the TL profiles from the two strains were qualitatively reproduced: the Tm was increased in the E130L mutant with respect to WT and the TL band was enhanced.
FIGURE 4.

Simulations according to Eq. 5 (solid lines) or Eq. 6 (dashed lines) of the TL band from the WT and E130L (see Fig. 2). The parameters used were ΔHr = 625 meV and 680 meV for the WT and E130L, respectively; ΔHex = 670 meV; ΔHd = 230 meV; sr = 1.1 × 10¹⁰ s−1; sex= 1.0 × 10⁹ s−1; and sd = 63 s−1 (see Cuni et al., 2004); and B = 0.5° s−1.
Fig. 5 illustrates in more detail the effects of uncoupling the main recombination pathway from the excitonic contribution. For simplicity, we use Eq. 6, assuming that, as in the WT, most of the recombination proceeds via route 2 in Fig. 3. As shown in Fig. 5 (top panel), the effect of increasing ΔHr while keeping ΔHex constant is to slow the recombination and shift the depletion of n to higher temperatures, whereas the (exponentially rising) luminescence sensitivity kex(T) is unchanged (dashed line). One thus obtains (Fig. 5, bottom panel) both an increased Tm and an enhancement of the TL band. In the Randall-Wilkins scheme (where ΔH = ΔHr = ΔHex), a slower recombination may be simulated either by decreasing s, or by increasing ΔH. Simulations of these cases (not shown) show an increased Tm, but fail to account for the increase of the TL band amplitude. This is easily realized by considering that in the Randall-Wilkins scheme, the luminescence integral over the time (or over the temperature at fixed B) is a constant quantity because the recombination coincides with the radiative route.
FIGURE 5.
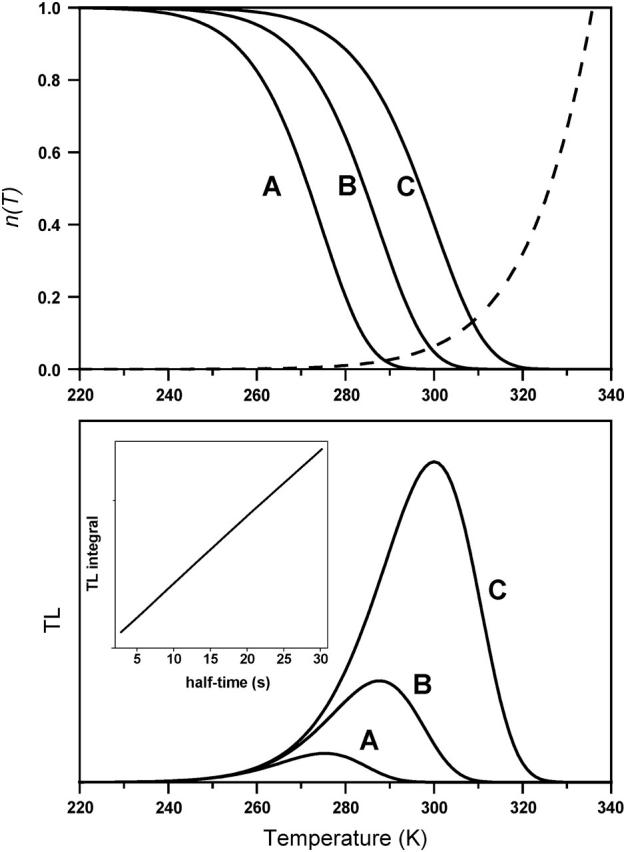
TL simulations according to Eq. 6. ΔHex was kept fixed at 670 meV. ΔHr was taken equal to 625 meV (A), 650 meV (B), and 680 meV (C). The heating rate was B = 0.5° s−1. The pre-exponential factor was s = 1.1 × 10¹⁰ s−1, corresponding to a recombination half-time at 293 K of 2.8 s (A), 9.2 s (B), and 30.2 s (C). The top panel shows the corresponding n(T) functions and the unique kex(T) function (dashed line; the scale is arbitrary). The TL (T) curves (bottom panel) are the products n(T) kex(T). Notice the increase of the Tm and of the peak amplitude when ΔHr increases. The inset is a plot of the TL integral (from T = 0 to 330 K) versus the half-time of the recombination reaction at 293 K while varying ΔHr from 600 to 680 meV: a quasilinear dependence was obtained, in agreement with the data of Vavilin and Vermaas (2000).
Vavilin and Vermaas (2000) studied the recombination rate and TL in a series of Synechocystis mutants of the luminal CD-loop of the D2 protein. The mutations resulted in slower or faster recombination rates with respect to the WT, which were ascribed by the authors to an increased or decreased equilibrium constant between S2P and S1P+. The effect on TL was qualitatively similar to that simulated in Fig. 5, with regard both to the Tm shift and band amplitude. Indeed, we obtained a linear relationship (inset) between the TL integral and the recombination half-time, as experimentally found by Vavilin and Vermaas. The authors' interpretation was, in agreement with ours, that the recombination was dominated by a nonradiative pathway. They believed, however, that this pathway was the direct route (3 in Fig. 3); while, as argued above, the effects of acceptor side mutations, or of inhibitors affecting the potential of QA (Krieger-Liszkay and Rutherford, 1998; Rappaport et al., 2002) indicate that the main contribution occurs via the nonradiative recombination of the radical pair P+Ph− (2 in Fig. 3). That is, the direct route becomes predominant only in systems with a markedly increased ΔG between QA and Ph. This is in contrast with bacterial centers (those where QA is a ubiquinone), where direct recombination predominates unless this ΔG is decreased by mutations or quinone substitution (Gunner et al., 1986).
In the mutants studied by Vavilin and Vermaas (2000), the equilibrium constant on the donor side might be affected by a change in the Em of the S2/S1 couple, Em(S), or by a change of the P+/P couple, Em(P). A change of Em(S) would similarly affect ΔHr and ΔHex. This could account for the observed shifts of Tm, but would not be consistent with the large effect on the peak amplitudes (the simulation shows only a small increase of the amplitude when decreasing ΔHr and ΔHex by the same amount). On the other hand, a change of Em(P) will affect ΔHr, but not ΔHex (the case illustrated in Fig. 5), because the Em of the P+/P* couple is similarly changed (the difference between both Em values is the energy of the P→ P* transition). This means that, for instance, lowering the equilibrium constant for populating P+S1 from PS2 is compensated by an increased equilibrium constant for populating P*QA from  Therefore, the mutations studied by Vavilin and Vermaas (2000) appear to modify primarily Em(P), rather than Em(S), as may be expected from structural data (see, e.g., the structure from Zouni et al., 2001).
Effect of the membrane potential
In either the E130L mutant, with a more reducing Ph, or in the mutants studied by Vavilin and Vermaas (2000), where the midpoint potential of P is changed, ΔHr is modified while ΔHex is kept constant; increasing ΔHr results then, as explained above, in a slower recombination rate, a higher Tm, and a pronounced increase of the TL band intensity. The energetics of the system can be modified in other ways, for instance by acting on the stabilized states S2 or  A modified Em for each of these will now affect both ΔHr and ΔHex, keeping their difference constant. An increased stabilization will again shift the TL band to higher temperatures, but, as noticed earlier, the effect on the band amplitude is much smaller than when only ΔHr is modified. An example is the effect of various QB pocket inhibitors, which affect the Em of QA (see Droppa et al., 1981; Koike et al., 1989). Another interesting case is the effect of the membrane potential, which is expected to lower ΔHex more than ΔHr. An important contribution to the total electrogenicity in
  formation is the P*↔ P+Ph− reaction. Thus, the electrogenicity associated with the
  reaction is larger than that associated only with the
  reaction. This implies that the membrane potential will diminish ΔHex more than ΔHr because of the additional effect on the P* ↔ P+Ph− step. The acceleration of the recombination rate and the strong stimulation of luminescence caused by the membrane potential are well known (see, e.g., De Grooth and van Gorkom, 1981; Vos and van Gorkom, 1988). Concerning thermoluminescence, one expects that the presence of a membrane potential will shift the n(T) curve and Tm toward lower temperatures because of the decreased ΔHr. One should notice that the rate constant (κr) for the electron tunneling from Ph− to P+ is not expected to depend strongly on the membrane potential. This is a prediction of electron transfer theory for an activationless reaction (similarly, the recombination rate of
  in bacterial reaction centers is little-dependent on the ΔG, either modified by an electric field—Franzen and Boxer, 1993—or by quinone substitution—Gunner et al., 1986; Woodbury et al., 1986). On the other hand, the luminescence sensitivity factor kex is enhanced because of the diminished ΔHex. This tends to increase the amplitude of the TL band, opposing the lowering due to the temperature shift. Due to the larger sensitivity of ΔHex to the membrane potential, the first effect easily prevails and one predicts a picture opposite of that of Fig. 2, i.e., an increased amplitude for the TL band at lower T.
This effect is addressed in a qualitative manner in the experiment and simulation of Fig. 6. In living unicellular algae, a permanent potential across the thylakoid membrane is present in the dark (Diner and Joliot, 1976; Bennoun, 1983), maintained by a slow hydrolysis of ATP (see Rappaport et al., 1999 for a discussion). Accordingly, the rate of the  recombination and the luminescence yield are significantly decreased upon addition of an uncoupler (Joliot and Joliot, 1980). The top panel of Fig. 6 shows the TL bands for the
  recombination obtained with living cells, thus in the presence of a permanent membrane potential (solid symbols) and for uncoupled cells (open symbols). The E130L strain was used, with an enhanced TL band, located at a higher temperature than the WT. This offered the advantage of resolving the entire TL band without going below −10°C. When cooling the algae down to lower temperatures, the permanent membrane potential was more or less suppressed, presumably because of structural damage to the membranes. The sensitivity to uncouplers illustrated by Fig. 6 was a test for the conservation of the membrane potential. As predicted by the theory (see the qualitative simulation in the bottom panel), the suppression of the membrane potential caused a shift of the TL peak toward a higher temperature, accompanied by a decrease of its amplitude.
In the Randall-Wilkins scheme, a modification of the energy barrier for recombination would shift the TL band along the temperature scale, but it would not change the integral of the band, because the radiative pathway coincides with the recombination reaction. We have falsified this prediction in various ways, either by changing ΔHr at fixed ΔHex, or, conversely, by changing ΔHex more than ΔHr, thus producing marked stimulation or inhibition, respectively, of the TL band at higher Tm. The effect of the membrane potential on the TL from the E130L mutant shows that even in this case, where, as noticed above, the weight of the excitonic route is expected to be larger than in the WT, the recombination rate is still largely determined by the electron transfer from Ph− to P+.
Thermoluminescence is dominated by a fraction of PS II with slow recombination rate
The temperature position of the TL band (e.g., the value of Tm) is related to the kr(T), kex(T) functions according to Eq. 7 (we use here the WT approximation, assuming that path 2 is predominant and ktot ≈ kr). The dependence of kr versus T for DCMU-inhibited  has been studied by several groups (Bennoun, 1970, Kanazawa et al., 1992; Rappaport et al., 2002, Cuni et al., 2004). An Arrhenius dependence was found with ΔHr = 578 meV (55.8 kJ mol−1) in spinach thylakoids (Kanazawa et al., 1992) or 610 meV in Synechocystis (Rappaport et al., 2002). Our own results for WT Chlamydomonas are shown in Fig. 7 (top panel), over the temperature range −5°C to 35°C, yielding ΔHr = 625 meV and s = 1.1 × 10¹⁰ s−1. These data were obtained from the fluorescence-yield decay after a weak flash, exciting ∼16% of the centers (this corresponds to a fluorescence change of ∼4.5% of that induced by a saturating flash). This procedure (Cuni et al., 2004) eliminates the effect of the hyperbolic dependence of the fluorescence yield upon the amount of closed centers (see Lavorel and Joliot, 1972; Paillotin, 1972; Lavergne and Trissl, 1995), thus yielding directly the recombination kinetics (notice that the apparent half-time is ∼3.7-fold smaller when monitoring the fluorescence decay after a saturating flash); it also eliminates the contribution of the small amount of β-centers with a lower trapping efficiency (Melis, 1985; Lavergne and Trissl, 1995). The latter estimate of ΔHr ≈ 625 meV was used for computing the predicted value of Tm according to Eq. 7 (see the inset of Fig. 7, bottom panel), varying ΔHex in the reasonable range that may be accepted for this parameter. The dependence of Tm on ΔHex is rather weak and, in this whole range, Tm ≈ 276 K (+3°C). (When simulating the TL band with a fixed ΔHr and increasing ΔHex, the band amplitude decreases dramatically, and the bands become thinner on the low T side). Now, 276 K is about 5°C below the observed Tm (+8°C, see Figs. 1 and 10). The discrepancy is still much larger if one adopts the value of ΔHr = 578 meV reported by Kanazawa et al. (1992) for spinach thylakoids, which predicts Tm ≈ 257°K (−16°C). The reason for the low predicted values of Tm is clear: at 281 K, where the actual TL peak is observed, there should be very little
  (i.e., n(T)) still present, as shown in Fig. 7 (bottom panel).
FIGURE 7.
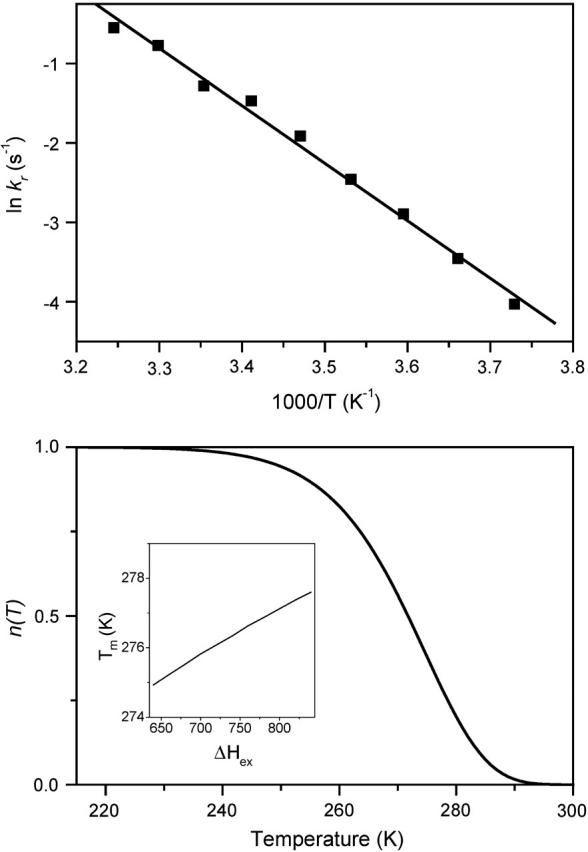
Experimental dependence of kr upon T and predicted TL behavior. (Top panel) An Arrhenius plot of kr, measured from the decay of the fluorescence yield after a weak flash in WT Chlamydomonas cells. kr was computed from the effective half-time of the kinetics, as ln(2)/t1/2. The linear regression (line) yielded ΔHr = 625 meV and s = 1.1 × 10¹⁰ s−1. (Bottom panel) The n(T) function computed with this value of ΔHr from Eq. 4, with B = 0.5° s−1. The inset shows the predicted Tm as a function of ΔHex, using Eq. 7.
FIGURE 10.

TL simulation for two PSII recombination components using Eq. 6. (Left panel) The s-factors were kept constant and the two ΔHr were adjusted to yield half-times of 0.9 s and 5 s at 293 K. Curves A and B (dotted) are the TL bands for the 0.9-s and 5-s components, respectively. Curve C (solid line) is a combination of both with 0.35/0.65 weights. Curve D (dashed) is the TL band for a 293-K half-time of 3.4 s (i.e., the effective half-time of the biexponential decay). Similar results were obtained when assuming that the fast and slow components correspond to different values of s, with a fixed ΔHr. (Middle and right panels) A comparison between the simulation of the TL bands with Chlamydomonas reinhardtii WT cells (middle panel) and spinach thylakoids (right panel). The accident at ∼−7°C in the thylakoids curve is due to melting of the glycerol-containing medium. Curves C and D were replotted from the left panel for comparison. Both curves were normalized to the amplitude of the experimental TL bands. In the experiments and simulations, B = 0.5° s−1.
The above considerations actually rely on an oversimplified picture of PS II recombination. The kr(T) function was determined from the overall half-time of the kinetics, implying that the recombination process can be adequately portrayed as a homogeneous single-exponential decay. It has long been known that such is not the case (Bennoun, 1970). At variance with Bennoun's analysis supporting an apparent second-order process, we found that the recombination kinetics can be consistently and accurately fitted as a sum of two exponentials. An example is shown in Fig. 8. Typical figures obtained in a number of experiments give, at 20°C, a relative amplitude of ∼35% for the fast phase (range 25–45%) and half-times of 0.9 s (range 0.8–1.2 s) and 5 s (range 3.7–6.3 s) for the fast and slow phases, respectively. Although the fits are satisfactory (and are not improved by assuming a larger number of exponentials), this does not warrant the presence of two kinetic components rather than a distribution of components. Indeed, we found that a broad (e.g., Gaussian) distribution of exponential contributions, or a stretched exponential of the form exp[−(kt)n], can often (depending on the parameters) be very accurately fitted as a sum of two exponentials (similar observations concerning the apparent second-order kinetics found by Bennoun were reported by Lavorel et al., 1982). Such functions (see, e.g., Frauenfelder et al. 1991) are used for describing protein reactions controlled by conformational substates. For simplicity, however, we will assume that only two kinetic contributions are present. Broadly speaking, two classes of interpretations may account for such a situation:
Pre-existing heterogeneity: two conformations of the centers with different recombination rates are present, which do not significantly interconvert during the recombination process.
The centers are homogeneous, but an evolution to a more stabilized state (with slower recombination) occurs in the one-second time-range after the charge separation.
These alternatives can be tested, for they predict a quite different behavior when submitting the sample to a series of saturating flashes with adequate time spacing. Let us denote the recombination kinetics after a single saturating flash as f1(t), and that after the last, nth flash of a regular series as fn(t). In model 2, the fraction of closed centers encountered by the nth flash is fn−1(T), where T is the flashing interval. These centers just continue the fn−1(t+T) kinetics, whereas those closed by the nth flash, decay according to f1(t). Therefore
 |
(8) |
where the time origin is taken at flash n. As illustrated below, this predicts a rapid enrichment in the slow contribution, when the flashing interval is chosen at a time where the fast phase is almost finished and the slow one still important. In contrast, the heterogeneous model 1 predicts no such evolution but rather fn(t) = f1(t). Fig. 9 (top) shows the experimental kinetics after 1–4 saturating flashes spaced 3-s apart. The curves for flashes 2–4 (open circles) are almost superimposed and slightly above that for flash 1, due to a small fraction of photochemical misses. Thus, the kinetics on the first few flashes are essentially identical, whereas a progressive slowing down can be observed on a larger number of flashes (Fig. 9, top curve, open diamonds is for the 23rd flash). The evolution predicted by Eq. 8 according to model 2 is shown in the bottom panel (where flashes 1–4 and 8 are displayed). A marked slowing-down is observed on the second flash, which continues with a diminishing extent on subsequent flashes. The experimental behavior (top panel) is in clear contrast with this prediction. This excludes model 2 and supports a heterogeneous model involving two, or possibly more, configurations. (It should be noticed that the test, based on Eq. 8, only takes into account the effective shape of f1(t), irrespective of its underlying mathematical form, which may be, e.g., a sum of two or more exponentials (including a broad distribution), a stretched exponential, etc.) The slow evolution toward slower kinetics that was observed during a long series of flashes (or continuous illumination) suggests an interconvertibility between the conformations occurring on a longer timescale (tens of seconds).
FIGURE 8.
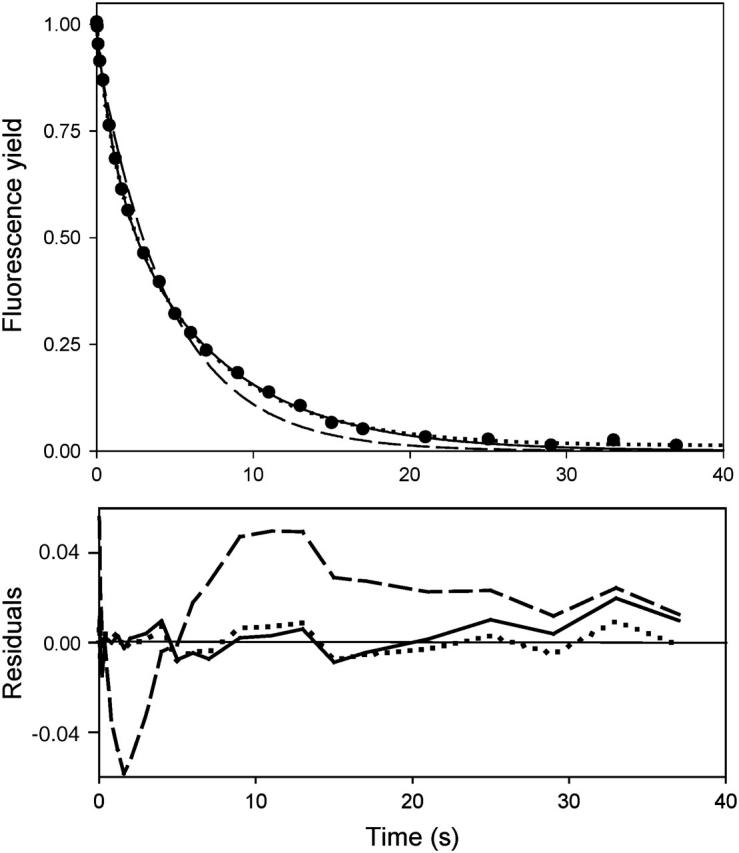
Decay of the fluorescence yield after a weak flash in benzoquinone-treated, DCMU-inhibited Chlamydomonas cells. The initial amplitude (used for normalization) was 4.5%, induced by a saturating flash. The dashed line is a best fit as a single-exponential decay. The solid line is the best fit as a sum of two exponentials, with a fast phase (t1/2 ≈ 0.81 s) accounting for 32% of the amplitude and a slow phase with t1/2 ≈ 4.73 s (68%). The dotted line is a best fit as a sum of three exponentials: the two major components are little-modified and the third phase is equivalent to a constant offset by 0.013. The bottom panel is a plot of the residuals for the three types of fits.
FIGURE 9.
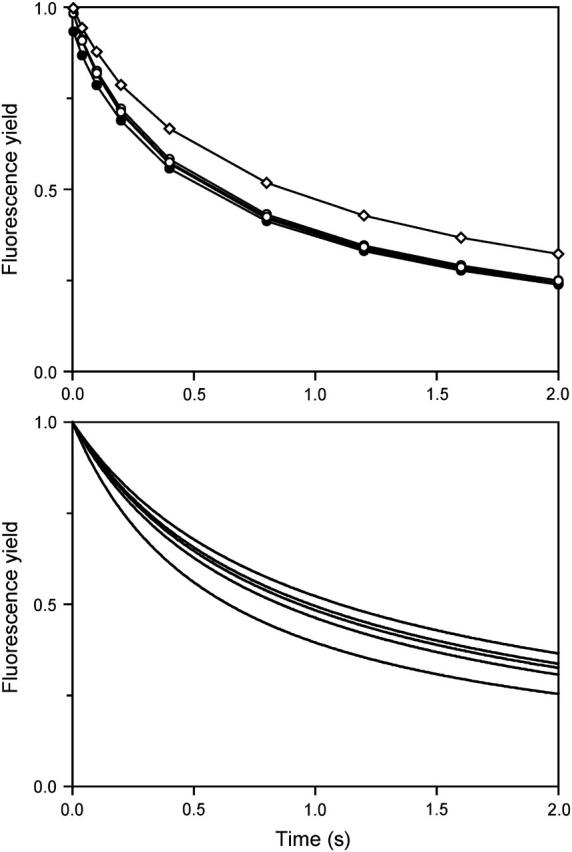
Effect of multiple flashing. (Top panel) Kinetics of the normalized fluorescence yield in benzoquinone-treated WT Chlamydomonas cells in the presence of 100 μM DCMU, after a series of saturating flashes triggered 3-s apart. Kinetics after flash 1 (solid circles), 2–4 (open circles), and 23 (open diamonds) are shown. (Bottom panel) A simulation according to the competition model (2) described in the text. The curves show (from bottom to top) the kinetics after flashes 1–4, and after flash 8. Eq. 8 was applied, using for f1(t) the fitted bi-exponential function to the fluorescence kinetics induced by a weak flash. The family of curves thus obtained for the decay of closed centers was converted to fluorescence-yield for a saturating flash, using a hyperbolic fit (see Lavergne and Trissl, 1995) of the experimental plot: (saturating flash kinetics) versus (weak flash kinetics).
This kinetic heterogeneity of PSII recombination is probably the clue to the discrepancy described above concerning the TL data. Incorporating this feature in TL simulations, one obtains an increased Tm (curve C in Fig. 10, left panel, to be compared with curve D computed from the overall half-time). The slow component (B) not only comes up at a higher Tm, but has also enhanced amplitude, so that it dominates the reconstituted TL band. The middle and right panels of Fig. 10 show experimental TL bands in WT Chlamydomonas and spinach thylakoids, respectively. In both panels, the dashed curve (curve D from the left panel) is the simulation based on a homogeneous recombination model. The solid curve is the same as C in the left panel, taking into account two kinetic contributions. The Tm is correctly predicted by the latter model, at variance with the failure, in this respect, of the homogeneous model. The band-shape simulation is also quite satisfactory for spinach thylakoids (excluding the discontinuity due to sample melting), whereas for algae, significant distortions are observed.
Vass et al. (1981) measured the kinetics of TL decay when interrupting the warming ramp at various temperatures. They found half-times of 35 s and 5 s at 7°C and 25°C, respectively (one may estimate from these data a half-time of 9–10 s at 20°C). These rates are markedly slower than the overall recombination process at the same temperatures. In other words, one observes a progressive enrichment in the fraction of slow recombining centers during the warming ramp as the faster centers decay at lower temperature.
CONCLUSION
Our first point in this article was to show that the currently used TL theory, based on the assumption that the predominant recombination pathway in PS II or other photosynthetic systems coincides with the radiative pathway, must be modified. It appears untenable in view of the present knowledge on these processes and, accordingly, it fails to account for a number of experimental facts. For instance, the ΔH estimated for the  recombination by applying the Randall-Wilkins model is ≈720 meV (Vass et al., 1981), thus much larger than that obtained from the actual temperature-dependence of the (overall) recombination rate (580–625 meV). Similarly, this theory cannot explain the effects on Tm and band amplitude observed in donor or acceptor side mutants with modified recombination rates, or when acting on the membrane potential. These effects are readily accommodated qualitatively when recasting the theory so as to distinguish the predominant nonradiative recombination route(s) from the radiative leak responsible for the luminescence emission. This rectification fully applies to bacterial reaction centers, where the excitonic yield is still much smaller than in PS II (Arata and Parson, 1981).
The second point was to realize that this amended theory did not suffice to predict the observed high value of Tm from the temperature-dependence of the overall recombination rate. Basically, the problem is that the overall recombination rate is too fast to be consistent with the high Tm, because most centers should have decayed earlier during the warming ramp. This apparent discrepancy arises from the fact that the recombination is markedly heterogeneous and that TL displays an enhanced sensitivity to slow recombination components.
Thermoluminescence is an attractive tool, because it gives an insight into the various metastable trapped states and a rough idea of their energy. This may be obtained in a single temperature scan, whereas a detailed investigation of the temperature-dependence of the recombination processes would require many more experiments. We have argued, however, that several major caveats must be taken into account. First, the information obtainable from TL on the energy depth of the trapped states is essentially the gap with respect to the state from which recombination predominantly occurs (e.g., P+Ph−) rather than the excited state (P*). Furthermore, this information is entangled with that pertaining to the pre-exponential factor s (for instance, Tm depends on both s and ΔHr—and, to a lesser extent, on ΔHex), so that an estimate of ΔHr requires a fit of the whole TL band with two adjustable parameters. This approach is hampered by the fact that, whenever some kinetic heterogeneity is present, TL will give a superimposition of bands dominated by the slower recombination processes. Marked kinetic heterogeneities for recombination and other processes are indeed present in photosynthetic reaction centers, especially at low temperatures (Kleinfeld et al., 1984)—which appears to be a general rule for proteins (Frauenfelder and McMahon, 1998). These considerations undermine the value of TL for gaining quantitative information on the energetic and kinetic parameters controlling the recombination of charge-separated states in photosynthetic systems.
Finally, we have shown that the kinetic heterogeneity of PS II recombination is not due to a stabilization process occurring during the recombination kinetics. It expresses a pre-existing heterogeneity between two or more conformations, which are probably interconvertible in a slow equilibrium process. We found a good fit of the recombination kinetics by a sum of two exponentials in Chlamydomonas, in spinach thylakoids, and in the cyanobacterium Synechocystis. This appears to be a general PS II feature, which, interestingly, is also present in bacterial type II reaction centers (McMahon et al., 1998; Schoepp et al., 1992; Sebban and Wraight, 1989). The apparent match with a biexponential function does not rule out the possibility of a broader heterogeneity reflecting a manifold of conformational substrates. In this respect, TL may turn out to be a useful tool for exploring kinetic heterogeneities in reaction centers.
Acknowledgments
We are very grateful to Dr. J.-M. Ducruet for putting his thermoluminescence setup at our disposal and for his expert assistance.
This work benefited from financial support from the Centre National de la Recherche Scientifique and the Commissariat à l'Energie Atomique.
APPENDIX
In the scheme of Fig. 1, assuming a rapid equilibrium, with a large equilibrium constant between C* and C1 and denoting n the fraction of C1, one has
 |
(A1) |
with rate constant
 |
(A2) |
The pre-exponential factor s (assumed independent of T) is
 |
(A3) |
If n(T) is the fraction of C1 still present at temperature T, the luminescence intensity is given by
 |
(A4) |
The factor Φ involves the radiative yield of the C* → C0 decay.
Denoting the warming rate as B = dT/dt, the differential equation (Eq. A1) becomes
 |
(A5) |
which is integrated as
 |
(A6) |
where T0 is some low temperature at which n = 1. Thus,
 |
(A7) |
By deriving Eq. A4 and using Eq. A5, the peak temperature Tm, for which dL/dT = 0, is the solution of the equation
 |
(A8) |
or, equivalently,
 |
(A9) |
The latter equation indicates how Tm can be predicted from the k(T) function when experimentally available.
References
- Arata, H., and W. W. Parson. 1981. Delayed fluorescence from Rhodopseudomonas sphaeroides reactions centers. Enthalpy and free energy changes accompanying electron transfer from P-870 to quinones. Biochim. Biophys. Acta. 638:201–209. [DOI] [PubMed] [Google Scholar]
- Bennoun, P. 1970. Reoxidation of the fluorescence quencher “Q” in the presence of 3-(3,4-dichlorophenyl)-1,1-dimethylurea. Biochim. Biophys. Acta. 216:357–363. [DOI] [PubMed] [Google Scholar]
- Bennoun, P. 1983. Effects of mutations and of ionophore on chlororespiration in Chlamydomonas reinhardtii. FEBS Lett. 156:363–365. [Google Scholar]
- Cuni, A., L. Xiong, R. T. Sayre, F. Rappaport, and J. Lavergne. 2004. Modification of the pheophytin midpoint potential in Photosystem II: modulation of the quantum yield of charge separation and of charge recombination pathways. Phys. Chem. Chem. Phys. 6:4825–4831. [Google Scholar]
- De Grooth, B. G., and H. J. van Gorkom. 1981. External electric field effects on prompt and delayed fluorescence in chloroplasts. Biochim. Biophys. Acta. 635:445–456. [DOI] [PubMed] [Google Scholar]
- Devault, D., and Govindjee. 1990. Photosynthetic glow peaks and their relationship with the free energy change. Photosynth. Res. 24:175–181. [DOI] [PubMed] [Google Scholar]
- Devault, D., Govindjee, and W. Arnold. 1983. Energetics of photosynthetic glow peaks. Proc. Natl. Acad. Sci. USA. 80:983–987. [DOI] [PMC free article] [PubMed] [Google Scholar]
- Diner, B. A., and P. Joliot. 1976. Effect of the transmembrane electric field on the photochemical and quenching properties of Photosystem II in vivo. Biochim. Biophys. Acta. 423:479–498. [DOI] [PubMed] [Google Scholar]
- Dorlet, P., L. Xiong, R. T. Sayre, and S. Un. 2001. High field EPR study of the pheophytin anion radical in wild type and D1–E130 mutants of Photosystem II in Chlamydomonas reinhardtii. J. Biol. Chem. 276:22313–22316. [DOI] [PubMed] [Google Scholar]
- Droppa, M., G. Horvath, I. Vass, and S. Demeter. 1981. Mode of action of Photosystem II herbicides studied by thermoluminescence. Biochim. Biophys. Acta. 638:210–216. [Google Scholar]
- Ducruet, J. M. 2003. Chlorophyll thermoluminescence of leaf discs: simple instruments and progress in signal interpretation open the way to new ecophysiological indicators. J. Exp. Bot. 54:2419–2430. [DOI] [PubMed] [Google Scholar]
- Ferreira, K. N., T. M. Iverson, K. Maghlaoui, J. Barber, and S. Iwata. 2004. Architecture of the photosynthetic oxygen-evolving center. Science. 303:1831–1838. [DOI] [PubMed] [Google Scholar]
- Franzen, S., and S. G. Boxer. 1993. Temperature dependence of the electric field modulation of electron-transfer rates: charge recombination in photosynthetic reaction centers. J. Phys. Chem. 97:6304–6318. [Google Scholar]
- Frauenfelder, H., and B. McMahon. 1998. Dynamics and function of proteins: the search for general concepts. Proc. Natl. Acad. Sci. USA. 95:4795–4797. [DOI] [PMC free article] [PubMed] [Google Scholar]
- Frauenfelder, H., S. G. Sligar, and P. G. Wolynes. 1991. The energy landscapes and motions of proteins. Science. 254:1598–1603. [DOI] [PubMed] [Google Scholar]
- Gunner, M. R., D. E. Robertson, and P. L. Dutton. 1986. Kinetic studies on the reaction center protein from Rhodopseudomonas sphaeroides: the temperature and free energy dependence of electron transfer between various quinones in the QA site and the oxidized bacteriochlorophyll dimer. J. Phys. Chem. 90:3783–3795. [Google Scholar]
- Inoue, Y. 1996. Photosynthesis thermoluminescence as a simple probe of Photosystem II electron transport. In Biophysical Techniques in Photosynthesis. J. Amesz and A.J. Hoff, editors. Kluwer Academic, Dordrecht, The Netherlands.
- Joliot, P., D. Béal, and B. Frilley. 1980. A new spectrophotometric method intended to study photosynthetic reactions. J. Chim. Phys. 77:209–216. [Google Scholar]
- Joliot, P., and A. Joliot. 1980. Dependence of delayed luminescence upon adenosine triphosphatase activity in Chlorella. Plant Physiol. 65:691–696. [DOI] [PMC free article] [PubMed] [Google Scholar]
- Joliot, P., A. Joliot, and A. Verméglio. 1997. Photo-induced cyclic electron transfer operates in frozen cells of Rhodobacter sphaeroides. Biochim. Biophys. Acta. 1318:374–384. [Google Scholar]
- Kanazawa, A., D. Kramer, and A. Crofts. 1992. Temperature Dependence of PS2 Electron Transfer Reactions Measured by Flash-Induced Fluorescence Changes. N. Murata, editor. Kluwer Academic, Dordrecht, The Netherlands. 131–134.
- Kleinfeld, D., M. Y. Okamura, and G. Feher. 1984. Electron-transfer kinetics in photosynthetic reaction centers cooled to cryogenic temperatures in the charge-separated state: evidence for light-induced structural changes. Biochemistry. 23:5780–5786. [DOI] [PubMed] [Google Scholar]
- Koike, H., S. Asami, S. Yoshida, N. Takahashi, and Y. Inoue. 1989. A new type of Photosystem II inhibitor which blocks electron transport in water-oxidation system. Z. Naturforsch. 44C:271–279. [Google Scholar]
- Krieger-Liszkay, A., and A. W. Rutherford. 1998. Influence of herbicide binding on the redox potential of the quinone acceptor of Photosystem II: relevance to photodamage and phytotoxicity. Biochemistry. 37:17339–17344. [DOI] [PubMed] [Google Scholar]
- Lavergne, J., and H.-W. Trissl. 1995. Theory of fluorescence induction in Photosystem II: derivation of analytical expressions in a model including exciton-radical pair equilibrium and restricted energy transfer between photosynthetic units. Biophys. J. 65:2474–2492. [DOI] [PMC free article] [PubMed] [Google Scholar]
- Lavorel, J., and P. Joliot. 1972. A connected model of the photosynthetic unit. Biophys. J. 12:815–831. [DOI] [PMC free article] [PubMed] [Google Scholar]
- Lavorel, J., J. Lavergne, and A.-L. Etienne. 1982. A reflection on several problems of luminescence in photosynthetic systems. Photobiochem. Photobiophysics. 3:287–314. [Google Scholar]
- McMahon, B. H., J. D. Muller, C. A. Wraight, and G. U. Nienhaus. 1998. Electron transfer and protein dynamics in the photosynthetic reaction center. Biophys. J. 74:2567–2587. [DOI] [PMC free article] [PubMed] [Google Scholar]
- Melis, A. 1985. Functional properties of Photosystem IIβ in spinach chloroplasts. Biochim. Biophys. Acta. 808:334–342. [Google Scholar]
- Merry, S. A. P., P. J. Nixon, L. M. C. Barter, M. J. Schilstra, G. Porter, J. Barber, J. R. Durrant, and D. Klug. 1998. Modulation of quantum yield of primary radical pair formation in Photosystem II by site-directed mutagenesis affecting radical cations and anions. Biochemistry. 37:17439–17447. [DOI] [PubMed] [Google Scholar]
- Paillotin, G. 1972. Transport and capture of electronic excitation energy in the photosynthetic apparatus. J. Theor. Biol. 36:223–235. [DOI] [PubMed] [Google Scholar]
- Randall, J. F., and J. H. F. Wilkins. 1945. Phosphorescence and electron traps. The study of trap distributions. Proc. Royal Soc. A. 184:366–389. [Google Scholar]
- Rappaport, F., G. Finazzi, Y. Pierre, and P. Bennoun. 1999. A new electrochemical gradient generator in thylakoid membranes of green algae. Biochemistry. 38:2040–2047. [DOI] [PubMed] [Google Scholar]
- Rappaport, F., M. Guergova-Kuras, P. J. Nixon, B. A. Diner, and J. Lavergne. 2002. Kinetics and pathways of charge recombination in Photosystem II. Biochemistry. 41:8518–8527. [DOI] [PubMed] [Google Scholar]
- Schoepp, B., P. Parot, J. Lavorel, and A. Verméglio. 1992. Charges recombination kinetics in bacterial photosynthetic reaction centers: conformational states in equilibrium pre-exist in the dark. In The Photosynthetic Reaction Center II. J. Breton and A. Verméglio, editors. Plenum Press, New York. 331–339.
-
Sebban, P., and C. A. Wraight. 1989. Heterogeneity of the
 recombination kinetics in reaction centers from Rhodopseudomonas viridis: the effect of pH and temperature. Biochim. Biophys. Acta. 974:54–65. [Google Scholar]
 - van Gorkom, H. J. 1985. Electron transfer in Photosystem II. Photosynth. Res. 6:97–112. [DOI] [PubMed] [Google Scholar]
- Vass, I. 2003. The history of photosynthetic thermoluminescence. Photosynth. Res. 76:303–318. [DOI] [PubMed] [Google Scholar]
- Vass, I., G. Horvath, T. Herczeg, and S. Demeter. 1981. Photosynthetic energy conservation investigated by thermoluminescence, activation energies and half-lives of thermoluminescence bands determined by mathematical resolution of glow curves. Biochim. Biophys. Acta. 634:140–152. [DOI] [PubMed] [Google Scholar]
- Vavilin, D. V., and W. F. Vermaas. 2000. Mutations in the CD-loop region of the D2 protein in Synechocystis sp. PCC 6803 modify charge recombination pathways in Photosystem II in vivo. Biochemistry. 39:14831–14838. [DOI] [PubMed] [Google Scholar]
- Vos, M. H., and H. J. van Gorkom. 1988. Thermodynamics of electron transport in Photosystem I by electric field-stimulated charge recombination. Biochim. Biophys. Acta. 934:293–302. [Google Scholar]
- Woodbury, N. W., W. W. Parson, M. R. Gunner, R. C. Prince, and P. L. Dutton. 1986. Radical-pair energetics and decay mechanisms in reaction centers containing anthraquinones, naphthoquinones of benzoquinones in place of ubiquinone. Biochim. Biophys. Acta. 851:6–22. [DOI] [PubMed] [Google Scholar]
- Zouni, A., H. T. Witt, J. Kern, P. Fromme, N. Krauss, W. Saenger, and P. Orth. 2001. Crystal structure of Photosystem II from Synechococcus elongatus at 3.8 Å resolution. Nature. 409:739–743. [DOI] [PubMed] [Google Scholar]