Abstract
It is unknown whether the widely used L-type Ca2+ channel antagonists diltiazem and nifedipine would block the repolarization K+ currents, transient outward current (Ito1) and ultra-rapid delayed rectifier K+ current (IKur), in human atrium. The present study was to determine the effects of diltiazem and nifedipine on Ito1 and IKur in human atrial myocytes with whole-cell patch-clamp technique.
It was found that diltiazem substantially inhibited Ito1 in a concentration-dependent manner, with an IC50 of 29.2±2.4 μM, and nifedipine showed a similar effect (IC50=26.8±2.1 μM). The two drugs had no effect on voltage-dependent kinetics of the current; however, they accelerated Ito1 inactivation significantly, suggesting an open channel block.
In addition, diltiazem and nifedipine suppressed IKur in a concentration-dependent manner (at +50 mV, IC50=11.2±0.9 and 8.2±0.8 μM, respectively). These results indicate that the Ca2+ channel blockers diltiazem and nifedipine substantially inhibit Ito1 and IKur in human atrial myocytes.
Keywords: Human atrial myocyte, transient outward K+ current, ultra-rapid delayed rectifier K+ current, ion channels, diltiazem, nifedipine
Introduction
The 4-aminopyridine (4-AP)-sensitive transient outward K+ current (Ito1) and ultra-rapid delayed rectifier K+ current (IKur) play important roles in human atrial repolarization (Shibata et al., 1989; Wang et al., 1993; Li et al., 1995; 1996a). Inhibition of Ito1 and/or IKur has been found to prolong the action potential duration in human atrium (Courtemanche et al., 1998; 1999; Van Wagoner, 2000). In addition, IKur has been reported to be present in the atrium, but not the ventricle of human heart (Li et al., 1996b). Therefore, blockade of IKur may be useful in the treatment of patients with atrial fibrillation, but without the risk of ventricular proarrhythmia (Van Wagoner, 2000; Van Wagoner & Nerbonne, 2000; Nattel, 2002).
The benzothiazopine Ca2+ channel blocker diltiazem and the dihydropyridine (DHP) Ca2+ channel blocker nifedipine are widely used in clinic for the treatment of cardiovascular diseases including hypertension (De Leeuw & Birkenhager, 2002; White, 2003), cardiac angina (Kumar & Hall, 2003), and/or supraventricular arrhythmias (for diltiazem) (Hohnloser et al., 2000). The therapeutic effects are generally believed to be related to the L-type Ca2+ channel (ICa.L) block (Hohnloser et al., 2000; De Leeuw & Birkenhager, 2001; Kumar & Hall, 2003; White, 2003). Earlier studies demonstrated that nifedipine significantly inhibited Ito1 in rabbit atrial (Gotoh et al., 1991) and rat ventricular (Jahnel et al., 1994) cells. Our recent study found that the phenylalkylamine Ca2+ channel blocker verapamil substantially blocked IKur, but not Ito1 in human atrial myocytes (Gao et al., 2004). Nevertheless, it is unknown whether diltiazem and nifedipine would affect human atrial repolarization currents. The present study was therefore designed to determine the effects of diltiazem and nifedipine on Ito1 and IKur in human atrial myocytes with whole-cell patch-clamp technique.
Methods
Single atrial myocyte preparation
Atrial cells were isolated from specimens of human right atrial appendage obtained from 29 patients (57.7±2.7 years old) undergoing coronary artery bypass grafting. The procedure for obtaining the tissues was approved by the Ethics Committee of the University of Hong Kong based on the patients' consent. All patients were free from supraventricular tachyarrhythmias, and the atria were grossly normal at the time of surgery. After excision, the samples were quickly immersed in oxygenated, nominally Ca2+-free cardioplegic solution for transport to the laboratory. Atrial myocytes were enzymatically dissociated as described previously (Du et al., 2003; Gao et al., 2004). Briefly, the myocardial tissue was sliced with a sharp blade, placed in a 15-ml centrifuge tube containing 10 ml of the Ca2+-free Tyrode solution (36°C), and gently agitated by continuous bubbling with 100% O2 for 15 min (5 min at a time in fresh solutions). The chunks were then incubated for 50 min in a similar solution containing 150–200 U ml−1 collagenase (CLS II, Worthington Biochemical, Freehold, NJ, U.S.A.), 0.2 mg ml−1 protease (type XXIV, Sigma Chemical, St Louis, MO, U.S.A.) and 1 mg ml−1 bovine serum albumin (Sigma). Subsequently, the supernatant was discarded. The chunks were re-incubated in a fresh enzyme solution with the same composition but no protease, microscope examination of the medium was performed every 10–15 min to determine the number and the quality of the isolated cells. When the yield appeared to be maximal, the chunks were suspended in a high K+ medium containing (mM) 10 KCl, 120 K-glutamate, 10 KH2PO4, 1.8 MgSO4, 10 taurine, 10 HEPES, 0.5 EGTA, 20 glucose, 10 mannitol, pH was adjusted to 7.3 with KOH and gently blown with a pipette. The isolated myocytes were kept at room temperature in the medium at least 1 h before use.
A small aliquot of the solution containing the isolated cells was placed in an open perfusion chamber (1-ml) mounted on the stage of an inverted microscope. Myocytes were allowed to adhere to the bottom of the chamber for 5–10 min and were then superfused at 2–3 ml min−1 with Tyrode solution. Only quiescent rod-shaped cells with clear cross-striations were used. The study was conducted at room temperature (21–22°C).
Solution and drugs
Ca2+-free cardioplegic solution for specimen transport contained (in mM) 50 KH2PO4, 8 MgSO4, 5 adenosine, 10 HEPES, 140 glucose, 100 mannitol, 10 taurine, pH was adjusted to 7.3. with KOH. Tyrode solution contained (in mM) 140 NaCl, 5.4 KCl, 1 MgCl2, 1.0 CaCl2, 0.33 NaH2PO4, 5 HEPES, 10 glucose, pH was adjusted to 7.4 with NaOH. The pipette solution contained (in mM) 20 KCl, 110 K-aspartate, 1.0 MgCl2, 10 HEPES, 5 EGTA, 0.1 GTP, 5 Na2-phosphocreatine, and 5 Mg2-ATP, pH was adjusted to 7.2 with KOH. For Ito1 and IKur recording, BaCl2 (200 μM) and CdCl2 (200 μM) were added to the superfusion to block IK1 and ICa. Atropine (1.0 μM) was used to minimize possible IK,ACh contamination during the current recording. Diltiazem was dissolved in distilled water with a stock solution of 100 mM, while a stock (100 mM) of nifedipine was made with DMSO. All the drugs were purchased from Sigma Chemicals Co. (St Louis, MO, U.S.A.).
Data acquisition and analysis
The whole-cell patch-clamp technique was used for electrophysiological recording. Borosilicate glass electrodes (1.2-mm OD) were pulled with a Brown-Flaming puller (model P-97, Sutter Instrument Co., Novato, CA, U.S.A.) and had tip resistances of 2–3 MΩ when filled with pipette solution. The whole-cell membrane currents in voltage-clamp mode were recorded using an EPC-9 amplifier and Pulse software (Heka, Lambrecht, Germany). A 3-M KCl-agar salt bridge was used as reference electrode. Liquid junction potentials were compensated before the pipette touched the cell. After a gigaseal was obtained, the cell membrane was ruptured by gentle suction to establish the whole-cell configuration. The cell membrane capacitance (78.6±4.1 pF, n=46) was directly measured using the lock-in module of the Pulse software, and used for normalizing the current in individual cells. The series resistance (Rs) was 3–8 MΩ and was compensated by 60–80% to minimize voltage errors. Current signals were low-pass filtered at 5 kHz and stored on the hard disk of an IBM compatible computer.
Nonlinear curve fitting was performed using Pulsefit (Heka) and/or Sigmaplot (SPSS Science, Chicago, IL, U.S.A.). Results are presented as mean±s.e. Paired and/or unpaired Student's t-test was used as appropriate to evaluate the statistical significance of differences between two group means, and ANOVA was used for multiple groups. Values of P<0.05 were considered statistical significant.
Results
Effect of diltiazem on Ito1
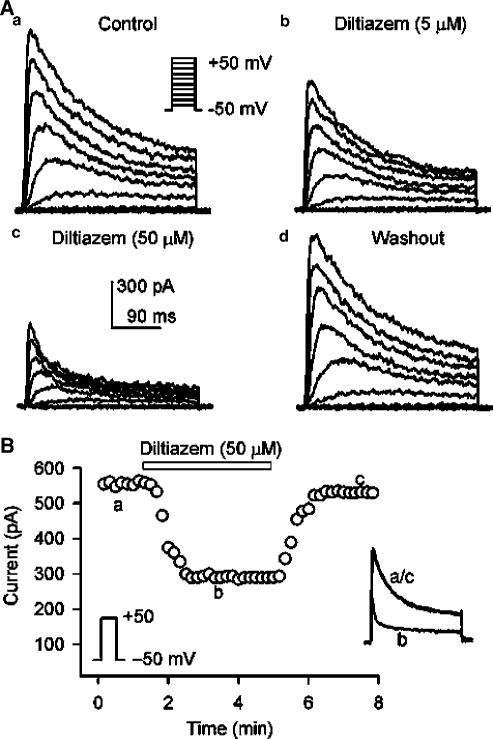
Figure 1A shows voltage-dependent Ito1 elicited by 300-ms voltage steps to between −40 and +50 from −50 mV (as shown in the inset) at 0. 2 Hz in a representative human atrial myocyte during control, in the presence of diltiazem, and after the drug washout. Ito1 was substantially inhibited by the application of 5 and 50 μM diltiazem, and the effect recovered after washout of the drug for 8 min. Figure 1B illustrates the time-dependent effect of diltiazem on Ito1 activated by the voltage step shown in the left inset. The current measured was peak to ‘quasi'-steady-state level. Diltiazem at 50 μM gradually inhibited Ito1, and the effect reached a steady-state level within 2 min. The current completely recovered upon the drug washout. The original Ito1 traces at the corresponding time points are shown in the right inset of the panel.
Figure 1.
Diltiazem effect on Ito1. (A) Representative voltage-dependent Ito1 (capacitance compensated) recorded in an atrial myocyte with the voltage steps protocol shown in the inset at 0.2 Hz under control conditions (a), in the presence of 5 and 50 μM diltiazem (b, c). Ito1 was substantially inhibited by the application of diltiazem for 6 min, and the effect was recovered by the drug washout for 8 min (d). (B) Time-dependent effect of 50 μM diltiazem on Ito1 elicited by the voltage step shown in the left inset delivered every 10 s in a typical experiment. Ito1 measured was peak to ‘quasi'-steady-state level. The original Ito1 traces at corresponding time points are shown in the right inset of the panel.
Results from Figure 1 indicate that the sustained current (i.e. IKur) is also suppressed when Ito1 is inhibited by diltiazem. It would be relatively accurate in evaluating the diltiazem effect on Ito1 if a selective IKur inhibitor is available to separate Ito1. It was reported that 4-AP selectively inhibited IKur at low concentrations (50 μM, about 50% inhibition) (Wang et al., 1993; Li et al., 1996b), but higher concentrations of 4-AP (>50 μM) also suppressed Ito1 significantly (authors' unpublished observation). Therefore, 4-AP would not be an ideal compound to separate Ito1. We have recently found that verapamil inhibits IKur (IC50=3.2 μM) without reducing Ito1 amplitude, while it induces an increase of measured Ito1 in human atrial myocytes (Gao et al., 2004). Therefore, verapamil was used to separate Ito1 as described in the following. We felt that the use of verapamil to limit the possible contamination of IKur would not affect drug action on Ito1.
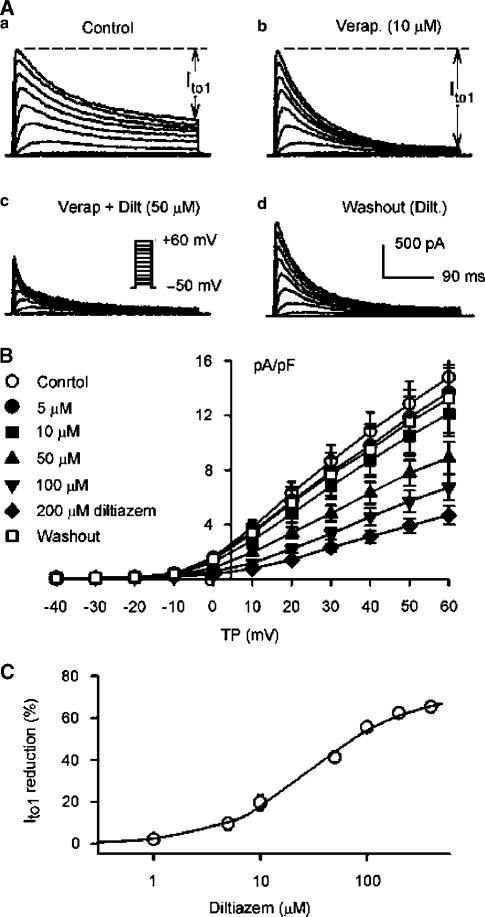
Figure 2A displays representative recordings of Ito1 elicited with the protocol as shown in the inset during control, in the presence of 10 μM verapamil, co-presence of verapamil and 50 μM diltiazem, and washout of diltiazem. After the inhibition of IKur by verapamil, inactivation of Ito1 was actually increased, and the measured Ito1 was clearly enhanced as the previous report observed (Gao et al., 2004). Diltiazem at 50 μM substantially suppressed Ito1, and the effect reversed upon dug washout. Figure 2B shows the I–V relationships of Ito1 in seven cells during the pretreatment of 10 μM verapamil to inhibit IKur, and after the application of 5, 10, 50, 100, and 200 μM diltiazem, showing that diltiazem inhibits Ito1 in a concentration-dependent manner. The effect was reversed by 90% after washout of diltiazem. Diltiazem at 5–200 μM significantly suppressed Ito1 at voltages from 0 to +60 mV (P<0.05 or 0.01 vs control). Figure 2C illustrates the concentration–response relationship for the inhibition of Ito1 by diltiazem. In six cells completed all the concentrations from 1 to 400 μM, data were fit to the Hill equation: E=Emax/[1+(IC50/C)b], where E is the effect at concentration C, Emax is the maximal effect, IC50 is the concentration for half-maximal effect, and b is Hill coefficient. IC50 (at +50 mV) was 29.2±2.4 μM with a Hill co-efficient of 0.97±0.06 on the basis of cell-by-cell fits, and Emax was 65.2%.
Figure 2.
Effects of verapamil and diltiazem on Ito1. (A) Ito1 traces recorded with the voltage protocol as shown in the inset of (c) in a representative myocytes during control (a), in the presence of 10 μM verapamil (Verap.) for 6 min (b), co-presence of verapamil and 50 μM diltiazem (Dilt.) for 6 min (c), and washout of diltiazem for 8 min. Verapamil actually induced an increase of measured Ito1 by selectively inhibiting IKur. (B) I–V relationships of Ito1 in the presence of 10 μM verapamil (control), co-presence of verapamil and 5, 10, 50, 100, and 200 μM diltiazem (6 min for each concentration), and after the drug washout for 10 min. Diltiazem inhibited Ito1 in a concentration-dependent manner (P<0.05 or 0.01 vs control, and the effect was reversed by 90% after the drug washout. The statistical significance was analyzed by repeated-measures ANOVA. (C) Concentration–response relationship for diltiazem inhibition of Ito1. Symbols are mean data at +50 mV (the error bars are smaller than the size of the data symbol), and solid line is the best-fit Hill equation, IC50=29.2±2.4 μM, Hill co-efficient=0.98±0.08 (n=6), and Emax=65.2%.
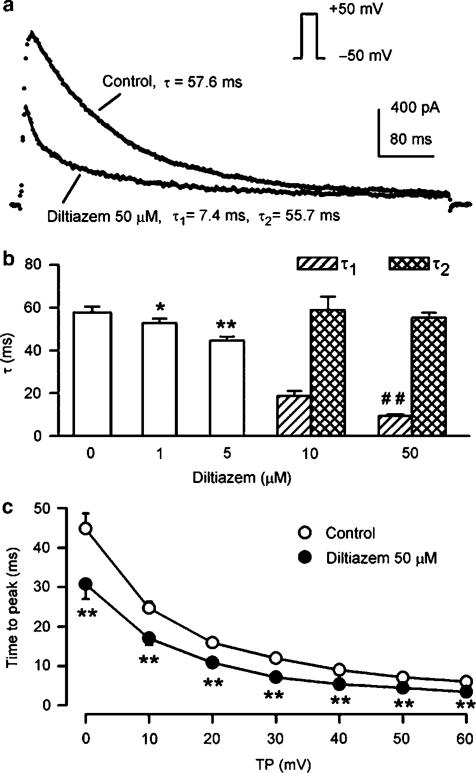
Time-dependent kinetics of Ito1 were determined in the presence of 10 μM verapamil. Figure 3a shows current traces (points) upon a 300-ms voltage step to +50 from –50 mV in a representative cell in the presence of 10 μM verapamil (control), and co-presence of verapamil and 50 μM diltiazem. Ito1 was well fitted by a mono-exponential function (solid line) under control conditions with time constant shown. After the application of 50 μM diltiazem, the current trace was no longer fitted by the monoexponential function, but well fitted by a biexponential equation with the time constants (τ1 and τ2) shown. A similar finding was obtained in all of the experiments in the presence of 10 and 50 μM diltiazem. Figure 3b illustrates the averaged time constants. The time constant of Ito1 inactivation was reduced from 57.8±2.8 ms of control to 52.1±2.1 and 44.1±1.8 ms respectively (P<0.05 or 0.01 vs control) by the application of 1 and 5 μM diltiazem. At 10 and 50 μM, there was a slower component with a time constant (τ2) similar to that under control conditions, and a faster component whose time constant (τ1) decreased to 9.4±0.6 ms from 18.6±2.1 ms as the drug concentration increased (n=7, P<0.01). These results are consistent with high-affinity open-channel block causing rapid current decay. Figure 3c shows the time to peak of Ito1, determined from the onset of depolarization to the current peak. Diltiazem at 50 μM significantly reduced the time to peak of Ito1 at 0 to +60 mV (n=6, P<0.01 vs control), consistent with open-channel block action (Feng et al., 1997).
Figure 3.
Effects of diltiazem on time-dependent kinetics of Ito1. (a) Ito1 traces recorded from a representative cell upon a 300-ms voltage step to +50 from −50 mV in the presence of 10 μM verapamil (control) and co-presence of verapamil and 50 μM diltiazem. Raw data (points) of Ito1 under control conditions were fitted to a monoexponential function (solid lines, superimposed with raw data) with time constants shown. After the application of 50 μM diltiazem, the data were fitted only by a biexponential equation, with fast and slow time constants (τ1 and τ2) shown. (b) Mean values of time constants at +50 mV under control conditions, in the presence of 1, 5, 10, and 50 μM diltiazem. The time constant was reduced by the application of 1 and 5 μM diltiazem (n=7, *P<0.05, **P<0.01 vs control). Diltiazem at concentrations higher than 10 μM had τ1 and τ2. The τ1 decreased with increasing diltiazem concentration (##P<0.01 vs 10 μM diltiazem), and the τ2 did not show significant difference. (c) Time to peak of Ito1 activation at 0 to +60 mV under control conditions and in the presence of 50 μM diltiazem. Diltiazem significantly reduced the time to peak of Ito1 (n=7, **P<0.01 vs control). The statistical significance was analyzed by repeated-measures ANOVA.
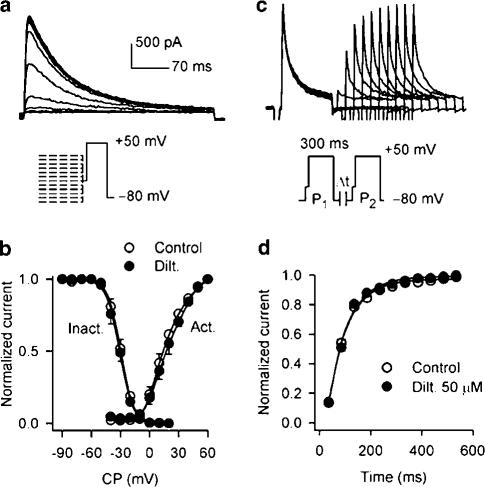
Voltage dependence of Ito1 activation and inactivation was evaluated in the presence of 10 μM verapamil (control), and co-presence of verapamil and 50 μM diltiazem. The variable (g) of voltage-dependent activation was calculated from I–V relationships for each cell from Figure 2B, based on the formulation g=I/(Vt−Vr) as described previously (Du et al., 2003), where I is the peak current at the test voltage (Vt), and Vr is the measured reversal potential (∼70 mV). The variable (I/Imax) for voltage-dependent inactivation was determined with a protocol as illustrated in Figure 4a, with 1−s conditioning pulses from voltages between −90 and +20 mV, followed by a 300-ms test pulse to +50 mV after a 30-ms interval at −40 mV. Mean data for activation and inactivation, along with best-fit Boltzmann equation to obtain the half activation or inactivation voltage (V0.5) and the slope (S), under control conditions and in the presence of 50 μM diltiazem are shown in Figure 4b. The voltage dependence of Ito1 activation and inactivation was not affected by the application of diltiazem. V0.5 and S were 16.9±1.4 and −11.2±0.3 mV for activation, and −29.2±1.1 and 7.5±0.6 mV for inactivation under control conditions. In the presence of 50 μM diltiazem, the corresponding values were 18.4±0.9 and −11.9±0.4 mV for activation (n=7, P=NS), and –30.4±1.4 and 7.6±0.8 mV for inactivation (n=6, P=NS).
Figure 4.
Effects of diltiazem on voltage-dependence and restoration of Ito1. (a) Representative current traces and protocol (inset) used to evaluate voltage-dependent inactivation Ito1 recorded in the presence of 10 μM verapamil. (b) Voltage-dependent variables for Ito1 activation (Act.) and inactivation (Inact.) were fitted to the Boltzmann distribution: y=1/{1+exp[(Vm−V0.5)/S]}, where Vm is membrane potential, V0.5 is the midpoint, and S is slope. For activation, V0.5 and S were 16.9±1.4 and −11.2±0.3 mV for control, and 18.4±0.9 and −11.9±0.4 mV for 50 μM diltiazem (Dilt.) treatment (n=7, P=NS). For inactivation, V0.5 and S were –29.2±1.1 and 7.5±0.6 mV under control conditions, and −30.4±1.4 and 7.6±0.8 mV in the presence of 50 μM diltiazem (n=6, P=NS). (c) Representative current traces recorded in a typical experiment in the presence of 10 μM verapamil by 300-ms paired pulses to +50 mV after a 30-ms step of −40 mV (to inactivate INa) from −80 mV with varying P1 and P2 interval (inset), which are used for assessing time-dependent recovery of Ito1 from inactivation. (d) Mean data for time course of recovery of Ito1 from inactivation in the absence and presence of 50 μM diltiazem in six cells. Data were best fit to monoexponential function. No change in recovery time constant of Ito1 was observed after the application of diltiazem (n=6, P=NS).
Time-dependent recovery of Ito1 from inactivation was studied with a paired-pulse protocol as shown in the inset of Figure 4c. Time course of recovery was well fitted by a monoexponential function with the time constant of 98.6±5.4 ms under control conditions, and 105.8±7.5 ms in the presence of 50 μM diltiazem (n=6, P=NS). The result indicates that diltiazem does not affect recovery of Ito1 from inactivation. In addition, no use-dependent effect of diltiazem (50 μM) on Ito1 (+50 mV) was noted at frequencies from 1 to 3 Hz (n=5, P=NS).
Inhibition of IKur by diltiazem
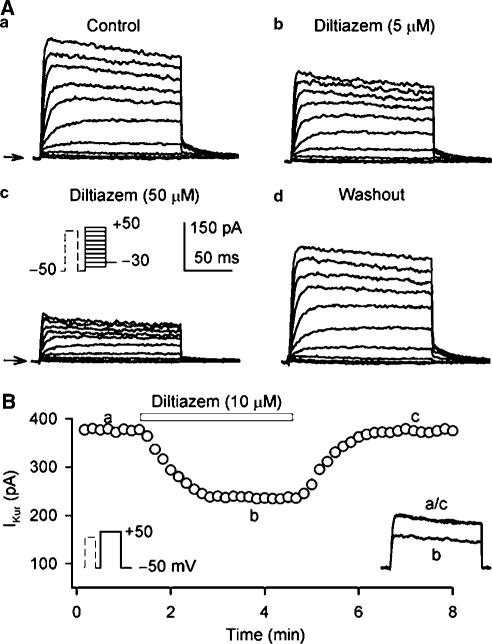
As described previously (Wang et al., 1993; Li et al., 1996a; Du et al., 2003; Gao et al., 2004), IKur was recorded with a 100-ms prepulse to +40 mV to partially inactivate Ito1, followed by 150-ms test pulses to between −40 and +50 from −50 mV after a 10-ms interval, then to −30 mV (as shown in the inset in Figure 5A). Figure 5A displays voltage-dependent IKur recorded by the voltage protocol in a typical experiment. Under control conditions the current was rapidly activated by depolarization steps with significant tail current at –30 mV. Diltiazem at 5 and 50 μM substantially inhibited both IKur and tail current. The effect was significantly recovered by the drug washout. Figure 5B shows the time-dependent effect of 10 μM diltiazem on IKur activated by the voltage protocol shown in the left inset in a representative myocyte. IKur measured from zero level to the current at the end of voltage step. IKur was gradually inhibited by diltiazem, and recovered upon the drug washout. The original IKur traces at corresponding time points are shown in the right inset of the panel.
Figure 5.
Effect of diltiazem on IKur. (A) Representative voltage-dependent IKur (capacitance compensated) recorded at 0.2 Hz in a typical experiment with a 100-ms prepulse to +40 mV to inactivate Ito1, followed by 150-ms test pulses to between –40 and +50 from –50 mV after a 10-ms interval, then to –30 mV (as shown in the inset of (c) under control conditions (a), in the presence of 5 and 50 μM diltiazem (b, c). IKur was substantially suppressed by the application of diltiazem, and the effect was significantly recovered by washout of the drug for 6 min (d). (B) Time-dependent effect of 10 μM diltiazem on IKur elicited by 150-ms voltage step to +50 from −50 mV (as shown in the left inset) delivered every 10 s. The original IKur races at corresponding time points are shown in the right inset.
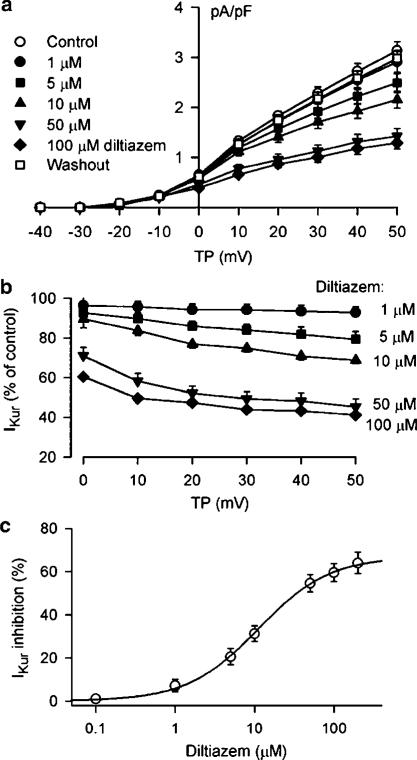
Figure 6a displays the I–V relationships of IKur (n=8) under control conditions, in the presence of 1, 5, 10, 50, and 100 μM diltiazem, and after washout of the drug, showing that diltiazem blocks IKur in a concentration-dependent manner. Figure 6b summarizes the percent reduction of IKur by diltiazem at voltages from 0 to +50 mV. Significant inhibitory effect of IKur by diltiazem was observed from the low concentration of 1 μM. At concentrations from 10 to 100 μM, diltiazem showed voltage-dependent effect on IKur, and the inhibition was stronger at voltages positive to +10 mV (P<0.05 or 0.01 vs 0 mV). Figure 6c shows the concentration–response relationships for suppression of IKur at +50 mV by diltiazem in seven cells completed all the concentrations from 0.1 to 200 μM. Mean IC50 was 11.2±0.9 μM with a Hill co-efficient of 0.96±0.07, and Emax was 64%. No use-dependent inhibition of IKur (+40 mV) by diltiazem (10 μM) was observed at frequencies from 1 to 3 Hz (n=6, P=NS).
Figure 6.
Concentration-dependent effect of diltiazem on IKur. (a) I–V relationships of IKur under control conditions, in the presence of 1, 5, 10, 50, and 100 μM diltiazem (6 min for each concentration), and after the drug washout for 10 min. Diltiazem inhibited IKur in a concentration-dependent manner, and the effect was reversed by 95% (at +50 mV) after the drug washout. (b) Percent reduction of IKur at 0 to +50 mV by diltiazem with multiple concentrations. Diltiazem significantly inhibited IKur at concentrations from 1 μM (P<0.05 vs control) to 5, 10, 50, and 100 μM (n=8, P<0.01 vs control). Significant voltage dependence was observed for the drug effect at 10–100 μM, and stronger effect was observed at potentials positive to +10 and +50 mV (P<0.05 or 0.01 vs 0 mV). The statistical significance was analyzed by repeated-measures ANOVA. (c) Concentration–response relationships of IKur block by diltiazem at +50 mV. The symbols are mean values of inhibitory effect in cells exposed to different concentrations (0.1–200 μM) of diltiazem. Solid lines were best fit to Hill equation. Mean IC50 was 11.2±0.9 μM, Hill co-efficient was 0.96±0.07, and Emax was 64% (n=7).
Nifedipine effect on Ito1
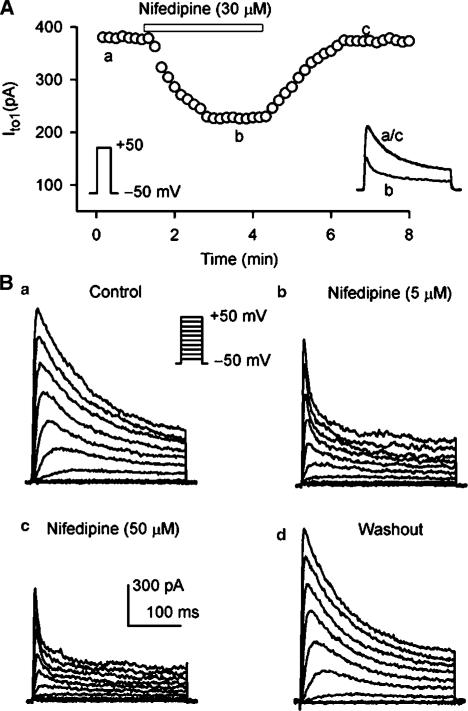
Figure 7A shows the time-dependent effect of nifedipine on Ito1 activated by a 300-ms voltage to +50 from –50 mV (as shown in the left inset) in a human atrial myocyte. Nifedipine gradually inhibited Ito1, and the effect recovered upon the drug washout. Figure 7B displays voltage-dependent Ito1 recorded with the voltage protocol as shown in the inset in a representative cell under control conditions, and after the application of nifedipine. Nifedipine at 5 and 50 μM substantially suppressed Ito1, and accelerated the inactivation of the current. These effects reversed upon drug washout.
Figure 7.
Inhibition of Ito1 by nifedipine. (A) Time-dependent effect of 30 μM nifedipine on Ito1 elicited by voltage step to +50 from −50 mV (as shown in the left inset) delivered every 10 s. Nifedipine reversibly suppressed Ito1. The original Ito1 traces at corresponding time points are shown in the right inset. (B) Voltage-dependent Ito1 traces recorded with the voltage protocol as shown in the inset in a typical experiment under control conditions (a), in the presence of 5 and 50 μM nifedipine (b, c) for 5 min. Ito1 was significantly inhibited by nifedipine, and the effect recovered upon the drug washout for 6 min.
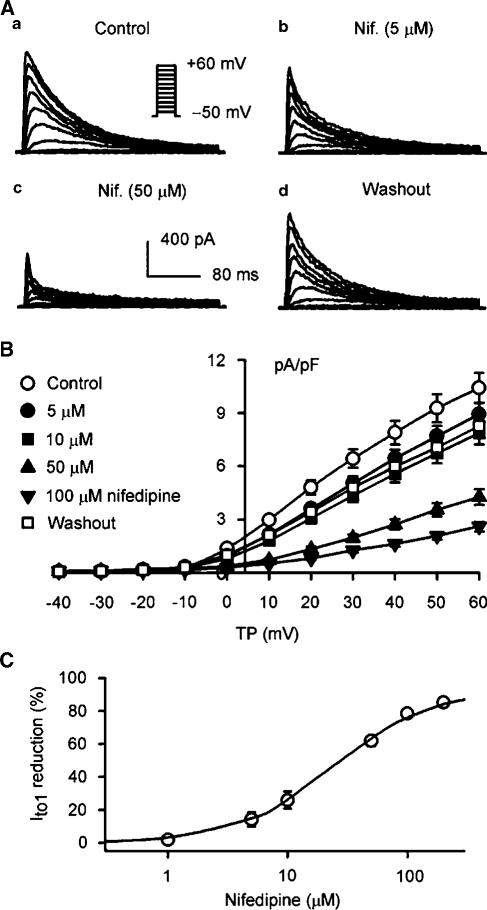
As diltiazem did, nifedipine suppressed both Ito1 and IKur. Verapamil at 10 μM was therefore used to inhibit IKur to obtain a relatively accurate effect of nifedipine on Ito1. Figure 8A displays representative recordings of Ito1 in the presence of 10 μM verapamil (control), co-presence of verapamil and 5 and 50 μM nifedipine, and washout of nifedipine. Figure 8B illustrates the I–V relationships of Ito1 in seven cells before and after the application of 5, 10, 50, and 100 μM. Ito1 was suppressed by nifedipine in a concentration-dependent manner, and recovered by 80.1% upon washout of nifedipine. Nifedipine significantly inhibited Ito1 at voltages from 0 to +60 mV (P<0.05 or P<0.01 vs control) with 5, 10, 50, and 100 μM nifedipine. The concentration–response relationship for inhibition of Ito1 by nifedipine is illustrated in Figure 8C. On the basis of cell-by-cell fits with the Hill equation in six cells, IC50 was 26.8±2.1 μM with a Hill co-efficient of 0.96±0.05 (n=6), and Emax was 85.1%.
Figure 8.
Effect of nifedipine on Ito1 under conditions of inhibiting IKur with 10 μM verapamil. (A) Ito1 traces recorded with the same voltage protocol as shown in the inset in a representative myocyte during control (a, 10 μM verapamil), in the co-presence of verapamil and 5 (b) and 50 (c) μM nifedipine (Nif.) for 6 min, and washout of nifedipine for 10 min (d). (B) I–V relationships of Ito1 under control conditions (10 μM verapamil), in the co-presence of verapamil and 5, 10, 50, 100 μM nifedipine (6 min for each concentration), and after the drug washout for 10 min. Nifedipine (5–100 μM) significantly inhibited Ito1 at voltages from 0 to +60 mV (n=7, P<0.05 or 0.01). The statistical significance was analyzed by repeated-measures ANOVA. (C) Concentration-dependent response of Ito1 to nifedipine. IC50 at +50 mV was 26.8±2.1 μM with a Hill co-efficient of 0.97±0.02 (n=6), and Emax was 85.1%.
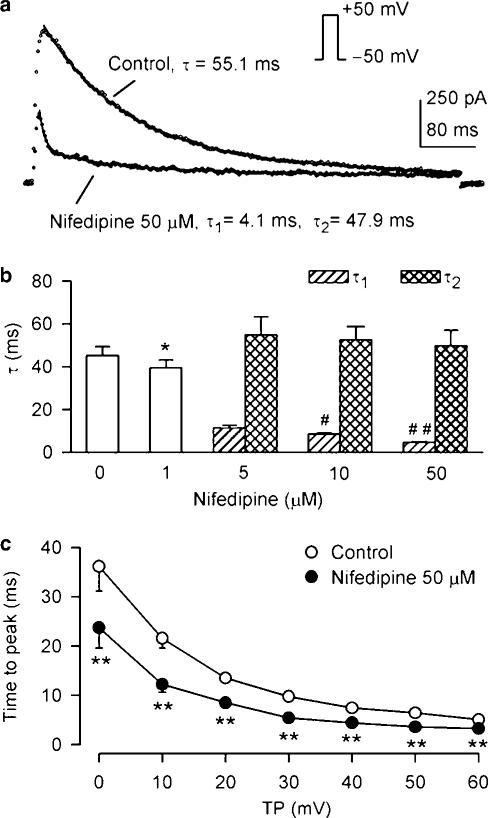
Effects of nifedipine on time-dependent inactivation of Ito1 were determined under conditions of IKur inhibition by 10 μM verapamil. Figure 9a displays the representative Ito1 traces (points) upon a 300-ms voltage step to +50 from –50 mV, well fitted by a monoexponential function (solid line) under control conditions, but only best fitted by a biexponential function after the application of 50 μM nifedipine with fast and slow time constants (τ1 and τ2) shown. Figure 9b summarizes mean values of the time constants studied in seven cells under control conditions, and after the application of 1, 5, 10, and 50 μM nifedipine. In the presence of 1 μM nifedipine, the monoexponential time constant reduced to 39.4±3.7 from 45.2±4.2 ms of control (n=7, P<0.05). At higher concentrations of nifedipine at 5, 10, and 50 μM, there was a slower component with a time constant (τ2) similar to that under control conditions, and a faster component whose time constant (τ1) decreased with increasing nifedipine concentration (P<0.01). Figure 9c illustrates mean values of the time to peak of the onset of Ito1 activation before and after the employment of 50 μM nifedipine, showing that nifedipine significantly reduces the time to peak of Ito1 at 0 to +60 mV (n=6, P<0.01 vs control). These results suggest that nifedipine inhibits Ito1 via open channel block.
Figure 9.
Effects of nifedipine on inactivation and time to peak of Ito1. (a) Ito1 traces recorded in a typical experiment upon a 300-ms voltage step to +50 from −50 mV in the presence of 10 μM verapamil (control), and co-presence of verapamil and 50 μM nifedipine. Raw data (points) of Ito1 under control conditions were well fit to a mono-exponential function (solid lines, superimposed with raw data) with time constant shown. The data after application of 50 μM nifedipine were only fit to a biexponential equation with fast and slow time constants (τ1 and τ2) shown. (b) Mean values of Ito1 inactivation time constants under control conditions, and in the presence of 1 (n=7, P<0.05 vs control), 5, 10 and 50 μM nifedipine (#P<0.05, ##P<0.01 vs 5 μM nifedipine). (c) Time to peak of Ito1 as a function of test potentials under control conditions and in the presence of 50 μM nifedipine. The time to peak of Ito1 was significantly reduced at 0 to +60 mV by the application of diltiazem (n=6, **P<0.01 vs control). The statistical significance was analyzed by repeated-measures ANOVA.
No change in voltage-dependent and recovery kinetics of Ito1 was observed with 50 μM nifedipine. V0.5's of voltage-dependent activation and inactivation of Ito1 were 16.4±2.1 and −28.1±2.4 mV under control conditions, and 18.7±2.8 (n=7) and –31.5±2.9 mV (n=6) after the application of 50 μM nifedipine (P=NS). The time constant (τ) of recovery of Ito1 from inactivation was 97.3±4.9 ms under control conditions, and 89.5±6.2 ms in the presence of 50 μM nifedipine (n=6, P=NS vs control). No use-dependent effect of nifedipine (50 μM) on Ito1 (+50 mV) was observed at frequencies from 1 to 3 Hz (n=6, P=NS).
Inhibition of IKur by nifedipine
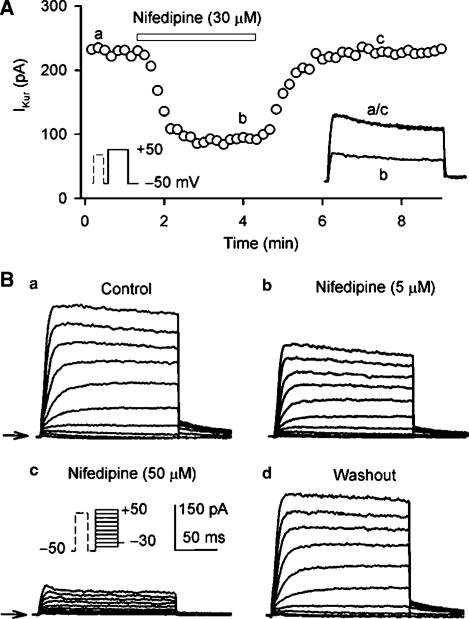
Figure 10A illustrates the time course of IKur during control and after applying 30 μM nifedipine, and washout of the drug in a typical experiment. IKur was reversibly decreased by nifedipine. Figure 10B displays the effect of nifedipine on voltage-dependent IKur in a representative myocyte. Nifedipine at 5 and 50 μM produced a substantial suppression on IKur, and the effect was recovered by the drug washout.
Figure 10.
Effect of nifedipine on IKur. (A) Time-dependent effect of 30 μM nifedipine on IKur elicited by voltage protocol shown in the left inset delivered every 10 s in a typical experiment. Nifedipine reversibly suppressed IKur. (B) Voltage-dependent IKur recorded in a representative myocyte by the voltage protocol shown in the inset under control conditions (a), in the presence of 5 and 50 μM nifedipine for 5 min (b, c), and after wash out of the drug for 6 min (d). Nifedipine substantially suppressed IKur, and the effect recovered upon the drug washout.
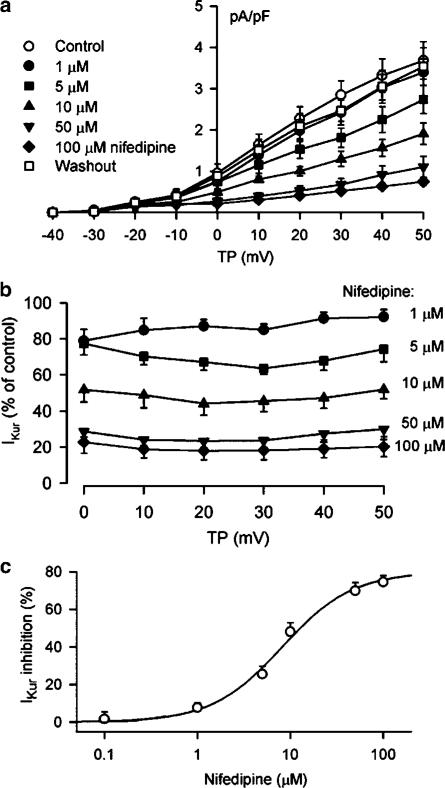
Figure 11a displays the I–V relationships of IKur under control conditions, and after the application of 1, 5, 10, 50, and 100 μM nifedipine. IKur was inhibited by nifedipine in a concentration-dependent manner, and recovered by 95% of control after washout of the drug. The percent reduction of IKur by nifedipine at potentials from 0 to +50 mV is shown in Figure 11b. Significant inhibition of IKur was observed from the low concentration of 1 μM. IKur at +50 mV was decreased by 7.7±2.6, 25.6±4.2, 48.1±4.8, 69.9±4.3, and 75.9±4.9% at 1, 5, 10, 50, and 100 μM nifedipine, respectively (n=8, P<0.05 or 0.01). Figure 11c shows the concentration-dependent response of IKur to nifedipine. On the basis of cell-by-cell fits with Hill equation completed in seven cells, all the concentrations from 0.1 to 200 μM, IC50 was 8.2±0.8 μM with a Hill co-efficient of 1.2±0.1, and Emax was 76%. No use-dependent effect of nifedipine (10 μM) on IKur (40 mV) was observed at frequencies from 1 to 3 Hz (n=6, P=NS).
Figure 11.
Nifedipine effect on voltage-dependent IKur. (a) I–V relationships of IKur under control conditions, in the presence of 1, 5, 10, 50, and 100 μM nifedipine (6 min for each concentration), and after the drug washout for 10 min. Nifedipine inhibited IKur in a concentration-dependent manner, and the effect was reversed by 95% (at +50 mV) by washout of the drug for 10 min. (b) Percent inhibition of IKur at voltages from 0 to +50 mV by nifedipine with multiple concentrations. Nifedipine significantly inhibited IKur at concentrations from 1 to 5, 10, 50, and 100 μM (n=8, P<0.05 or 0.01 vs control), and no voltage-dependent effect was observed for the drug action. The statistical significance was analyzed by the repeated measures ANOVA. (c) Concentration-dependent inhibition of IKur by nifedipine at +50 mV. The symbols are mean values of inhibitory effect in seven cells exposed to different concentrations of nifedipine. Solid lines were fit to Hill equation. Mean IC50 was 8.2±0.8 μM, Hill co-efficient was 1.2±0.2, and Emax was 76%.
Discussion
The present study demonstrates that the widely used Ca2+ channel blockers diltiazem and nifedipine substantially inhibit the repolarization currents Ito1 and IKur in human atrial myocytes. The blockade of human atrial Ito1 and IKur by the two Ca2+ channel blockers was concentration-dependent.
The benzothiazopine Ca2+ channel blocker diltiazem, the dihydropyridine Ca2+ channel blocker nifedipine, and the phenylalkylamine Ca2+ channel block verapamil were reported to block a variety of cloned K+ channels including Kv1.1, Kv1.2, Kv1.3, Kv1.4, Kv1.5, Kv3.1, Kv4.2, and HERG channel currents expressed in mammalian cell lines and/or Xenopus oocytes (Rampe et al., 1993; Grissmer et al., 1994; Zhang et al., 1997; Rolf et al., 2000; Calmels et al., 2001). Our recent study showed that verapamil inhibited IKur, but not Ito1, in human atrium (Gao et al., 2004). The present observation provides the novel information that diltiazem and nifedipine decrease both Ito1 and IKur in human atrial myocytes.
Our findings showed that diltiazem substantially inhibited Ito1 in human atrial myocytes, and significantly accelerated the inactivation of Ito1, and reduced the time to peak of the activation (Figures 1, 2 and 3), suggesting an open-channel block (Feng et al., 1997). No report is available in literature regarding the diltiazem effect on Ito1 to compare the results from the present observation. Ito1 may be encoded by the cloned channel Kv1.4 or Kv4.2/Kv4.3 (Tseng, 1999). A recent report described that Kv1.4 and Kv4.2 currents expressed in Xenopus oocytes were inhibited by 10 and 24% at +50 mV with 100 μM diltiazem (Rolf et al., 2000). The effect is much weaker than that (IC50=29.2 μM, Emax=65%) observed in human atrial native Ito1 (Figure 3).
IKur in human atrium is generally believed to be encoded by cloned channel Kv1.5 (Fedida et al., 1993; Wang et al., 1993). It was reported that diltiazem at 100 μM blocked the cloned Kv1.5 channel currents expressed in Xenopus oocytes only by 15% at +50 mV (Rolf et al., 2000), and the compound inhibited the Kv1.5 channel current expressed in mouse fibroblasts with a large Kd of 115 μM (Grissmer et al., 1994). However, diltiazem inhibited IKur with IC50 of 11.2 μM in human atrial myocytes (Figures 5 and 6), suggesting that the blocking effect is stronger in human atrial native IKur than that in cloned hKv1.5 channel expressed in Xenopus oocytes or mouse fibroblasts (Grissmer et al., 1994; Rolf et al., 2000).
The suppression of native Ito1 by nifedipine was initially reported in rabbit atrial cells (Gotoh et al., 1991), and rat ventricular myocytes (Jahnel et al., 1994). The present observation provides additional evidence that nifedipine also inhibits human atrial Ito1 (Figures 7 and 8). Inactivation of Ito1 was significantly accelerated by nifedipine in human atrial myocytes (Figure 9), suggesting an open-channel block, consistent with the reports from rabbit and rat cardiac myocytes (Gotoh et al., 1991; Jahnel et al., 1994), and cloned Sharker K+ channels expressed in Xenopus oocytes (Avdonin et al., 1997).
It has been reported that human atrial Ito1 is mainly encoded by Kv4.3 (Kong et al., 1998). Nifedipine had no significant effect on the kinetics of voltage-dependent activation and inactivation, and the rate of recovery from inactivation of Ito1 in human atrial myocytes. However, nicardipine, another DHP compound, negatively shifted V0.5 of activation and inactivation, and slowed down the rate of recovery from inactivation of rat Kv4.3L channel currents expressed in HEK 293 cell line (Hatano et al., 2003). These different responses of Kv4.3 to DHPs may be related to the subtle differences of the Kv4.3 sequences (human vs rat), the cell types (native human atrial cells vs HEK 293 cells), or the chemical structures (nifedipine vs nicardipine), etc.
It was reported that nifedipine substantially blocked hKv1.5 current expressed in HEK 293 cells (Zhang et al., 1997) and mouse fibroblast (Grissmer et al., 1994). The present study demonstrated that nifedipine inhibited human atrial IKur in a concentration-dependent manner, with an IC50 of 8.2 μM (Figures 10 and 11). The concentration is close to the Kd (6.2 μM) of hKv1.5 current expressed in HEK cells (Zhang et al., 1997), and lower than that of hKv1.5 current expressed in mouse fibroblasts (Kd=92 μM) (Grissmer et al., 1994). No report is available in literature from native cells to compare with the data obtained from the present observation in human atrial myocytes.
IKur is found to be functionally expressed in human atrium, but not ventricle (Li et al., 1996b). Therefore, the drugs that specifically inhibit the unique IKur may provide a means of preventing atrial fibrillation without the risk of ventricular proarrhythmia (Nattel, 2002). In the present study, we have found that the diltiazem inhibits IKur with an IC50 of 11.2 μM. The significant inhibitory effect on IKur was observed at low concentration of 1 μM, which is close to the therapeutically relevant plasma (50–300 ng ml−1) concentrations of diltiazem in the treatment of atrial arrhythmias (Singh et al., 1983; Dias et al., 1992; Kelly & O'Malley, 1994), and the ICa.L block concentration (1–15 μM) in myocardium (McDonald et al., 1994; Koidl et al., 1997). Nifedipine also significantly inhibited IKur at 1 μM, but the concentration is higher than the clinical relevant plasma (10–200 ng ml−1) concentrations (Singh et al., 1983; Kelly & O'Malley, 1994), and the ICa.L block concentration (0.05–0.2 μM) in myocardium (McDonald et al., 1994; Koidl et al., 1997). Whether the inhibition of IKur and Ito1 by diltiazem or nifedipine would exert a beneficial action on supraventricular arrhythmias remains to be studied.
In summary, the present study has provided the first information that the widely used Ca2+ antagonists diltiazem and nifedipine substantially inhibit the repolarization currents Ito1 and IKur in human atrial myocytes.
Acknowledgments
This work was supported by CRCG from the Research Committee of the University of Hong Kong. We thank Professor T.M. Wong in the Department of Physiology for his support.
Abbreviations
- 4-AP
4-aminopyridine
- IC50
the concentration for 50% maximum inhibition
- ICa.L
L-type Ca2+ current
- IKur
ultra-rapid delayed rectifier K+ current
- Ito1
transient outward K+ current
References
- AVDONIN V., SHIBATA E.F., HOSHI T. Dihydropyridine action on voltage-dependent potassium channels expressed in Xenopus oocytes. J. Gen. Physiol. 1997;109:169–180. doi: 10.1085/jgp.109.2.169. [DOI] [PMC free article] [PubMed] [Google Scholar]
- CALMELS T.P., FAIVRE J.F., CHEVAL B., JAVRE J.L., ROUANET S., BRIL A. hKv4.3 channel characterization and regulation by calcium channel antagonists. Biochem. Biophys. Res. Commun. 2001;281:452–560. doi: 10.1006/bbrc.2001.4396. [DOI] [PubMed] [Google Scholar]
- COURTEMANCHE M., RAMIREZ R.J., NATTEL S. Ionic mechanisms underlying human atrial action potential properties: insights from a mathematical model. Am. J. Physiol. 1998;275:H301–H321. doi: 10.1152/ajpheart.1998.275.1.H301. [DOI] [PubMed] [Google Scholar]
- COURTEMANCHE M., RAMIREZ R.J., NATTEL S. Ionic targets for drug therapy and atrial fibrillation-induced electrical remodeling: insights from a mathematical model. Cardiovasc. Res. 1999;42:477–489. doi: 10.1016/s0008-6363(99)00034-6. [DOI] [PubMed] [Google Scholar]
- DE LEEUW P.W., BIRKENHAGER W.H. The effects of calcium channel blockers on cardiovascular outcomes: a review of randomised controlled trials. Blood Press. 2002;11:71–78. doi: 10.1080/08037050211260. [DOI] [PubMed] [Google Scholar]
- DIAS V.C., WEIR S.J., ELLENBOGEN K.A. Pharmacokinetics and pharmacodynamics of intravenous diltiazem in patients with atrial fibrillation or atrial flutter. Circulation. 1992;86:1421–1428. doi: 10.1161/01.cir.86.5.1421. [DOI] [PubMed] [Google Scholar]
- DU X.L., LAU C.P., CHIU S.W., TSE H.F., GERLACH U., LI G.R. Effects of chromanol 293B on transient outward and ultra-rapid delayed rectifier potassium currents in human atrial myocytes. J. Mol. Cell. Cardiol. 2003;35:293–300. doi: 10.1016/s0022-2828(03)00007-5. [DOI] [PubMed] [Google Scholar]
- FEDIDA D., WIBLE B., WANG Z., FERMINI B., FAUST F., NATTEL S., BROWN A.M. Identity of a novel delayed rectifier current from human heart with a cloned K+ channel current. Circ. Res. 1993;73:210–216. doi: 10.1161/01.res.73.1.210. [DOI] [PubMed] [Google Scholar]
- FENG J., WANG Z., LI G.R., NATTEL S. Effects of class III antiarrhythmic drugs on transient outward and ultra-rapid delayed rectifier currents in human atrial myocytes. J. Pharmacol. Exp. Ther. 1997;281:384–392. [PubMed] [Google Scholar]
- GAO Z., LAU C.P., CHIU S.W., LI G.R. Inhibition of ultra-rapid delayed rectifier K+ current by verapamil in human atrial myocytes. J. Mol. Cell. Cardiol. 2004;36:257–263. doi: 10.1016/j.yjmcc.2003.11.003. [DOI] [PubMed] [Google Scholar]
- GOTOH Y., IMAIZUMI Y., WATANABE M., SHIBATA E.F., CLARK R.B., GILES W.R. Inhibition of transient outward K+ current by DHP Ca2+ antagonists and agonists in rabbit cardiac myocytes. Am. J. Physiol. 1991;260:H1737–H1742. doi: 10.1152/ajpheart.1991.260.5.H1737. [DOI] [PubMed] [Google Scholar]
- GRISSMER S., NGUYEN A.N., AIYAR J., HANSON D.C., MATHER R.J., GUTMAN G.A., KARMILOWICZ M.J., AUPERIN D.D., CHANDY K.G. Pharmacological characterization of five cloned voltage-gated K+ channels, types Kv1.1, 1.2, 1.3, 1.5, and 3.1, stably expressed in mammalian cell lines. Mol. Pharmacol. 1994;45:1227–1234. [PubMed] [Google Scholar]
- HATANO N., OHYA S., MURAKI K., GILES W., IMAIZUMI Y. Dihydropyridine Ca2+ channel antagonists and agonists block Kv4.2, Kv4.3 and Kv1.4 K+ channels expressed in HEK293 cells. Br. J. Pharmacol. 2003;139:533–544. doi: 10.1038/sj.bjp.0705281. [DOI] [PMC free article] [PubMed] [Google Scholar]
- HOHNLOSER S.H., KUCK K.H., LILIENTHAL J. Rhythm or rate control in atrial fibrillation – pharmacological intervention in atrial fibrillation (PIAF): a randomised trial. Lancet. 2000;356:1789–1794. doi: 10.1016/s0140-6736(00)03230-x. [DOI] [PubMed] [Google Scholar]
- JAHNEL U., KLEMM P., NAWRATH H. Different mechanisms of the inhibition of the transient outward current in rat ventricular myocytes. Naunyn-Schmiedeberg's Arch. Pharmacol. 1994;349:87–94. doi: 10.1007/BF00178211. [DOI] [PubMed] [Google Scholar]
- KELLY J.G., O'MALLEY K. Clinical pharmakinetics of calcium antagonists. An update. Clin. Pharmacokinet. 1994;22:416–433. doi: 10.2165/00003088-199222060-00002. [DOI] [PubMed] [Google Scholar]
- KOIDL B., MIYAWAKI N., TRITTHART H.A. A novel benzothiazine Ca2+ channel antagonist, semotiadil, inhibits cardiac L-type Ca2+ currents. Eur. J. Pharmacol. 1997;322:243–247. doi: 10.1016/s0014-2999(96)00995-8. [DOI] [PubMed] [Google Scholar]
- KONG W., PO S., YAMAGISHI T., ASHEN M.D., STETTEN G., TOMASELLI G.F. Isolation and characterization of the human gene encoding Ito: further diversity by alternative mRNA splicing. Am. J. Physiol. 1998;275:H1963–H1970. doi: 10.1152/ajpheart.1998.275.6.H1963. [DOI] [PubMed] [Google Scholar]
- KUMAR S., HALL R.J. Drug treatment of stable angina pectoris in the elderly: defining the place of calcium channel antagonists. Drugs Aging. 2003;20:805–815. doi: 10.2165/00002512-200320110-00002. [DOI] [PubMed] [Google Scholar]
- LI G.R., FENG J., WANG Z., FERMINI B., NATTEL S. Comparative mechanisms of 4-aminopyridine-resistant Ito in human and rabbit atrial myocytes. Am. J. Physiol. 1995;269:H463–H472. doi: 10.1152/ajpheart.1995.269.2.H463. [DOI] [PubMed] [Google Scholar]
- LI G.R., FENG J., WANG Z., FERMINI B., NATTEL S. Adrenergic modulation of ultrarapid delayed rectifier K+ current in human atrial myocytes. Circ. Res. 1996a;78:903–915. doi: 10.1161/01.res.78.5.903. [DOI] [PubMed] [Google Scholar]
- LI G.R., FENG J., YUE L., CARRIER M., NATTEL S. Evidence for two components of delayed rectifier K+ current in human ventricular myocytes. Circ. Res. 1996b;78:689–696. doi: 10.1161/01.res.78.4.689. [DOI] [PubMed] [Google Scholar]
- MCDONALD T.F., PELZER S., TRAUTWEIN W., PELZER D.J. Regulation and modulation of calcium channels in cardiac, skeletal, and smooth muscle cells. Physiol. Rev. 1994;74:365–507. doi: 10.1152/physrev.1994.74.2.365. [DOI] [PubMed] [Google Scholar]
- NATTEL S. New ideas about atrial fibrillation 50 years on. Nature. 2002;415:219–226. doi: 10.1038/415219a. [DOI] [PubMed] [Google Scholar]
- RAMPE D., WIBLE B., FEDIDA D., DAGE R.C., BROWN A.M. Verapamil blocks a rapidly activating delayed rectifier K+ channel cloned from human heart. Mol. Pharmacol. 1993;44:642–648. [PubMed] [Google Scholar]
- ROLF S., HAVERKAMP W., BORGGREFE M., MUSSHOFF U., ECKARDT L., MERGENTHALER J., SNYDERS D.J., PONGS O., SPECKMANN E.J., BREITHARDT G., MADEJA M. Effects of antiarrhythmic drugs on cloned cardiac voltage-gated potassium channels expressed in Xenopus oocytes. Naunyn-Schmiedeberg's Arch. Pharmacol. 2000;362:22–31. doi: 10.1007/s002100000257. [DOI] [PubMed] [Google Scholar]
- SHIBATA E.F., DRURY T., REFSUM H., ALDRETE V., GILES W. Contributions of a transient outward current to repolarization in human atrium. Am. J. Physiol. 1989;257:H1773–H1781. doi: 10.1152/ajpheart.1989.257.6.H1773. [DOI] [PubMed] [Google Scholar]
- SINGH B.N., NADEMANEE K., BAKY S.H. Calcium antagonists. Clinical use in the treatment of arrhythmias. Drugs. 1983;25:125–153. doi: 10.2165/00003495-198325020-00003. [DOI] [PubMed] [Google Scholar]
- TSENG G.N. Molecular structure of cardiac Ito channels: Kv4.2, Kv4.3, and other possibilities. Cardiovasc. Res. 1999;41:16–18. doi: 10.1016/s0008-6363(98)00282-x. [DOI] [PubMed] [Google Scholar]
- VAN WAGONER D.R. Pharmacologic relevance of K(+) channel remodeling in atrial fibrillation. J. Mol. Cell. Cardiol. 2000;32:1763–1766. doi: 10.1006/jmcc.2000.1224. [DOI] [PubMed] [Google Scholar]
- VAN WAGONER D.R., NERBONNE J.M. Molecular basis of electrical remodeling in atrial fibrillation. J. Mol. Cell. Cardiol. 2000;32:1101–1117. doi: 10.1006/jmcc.2000.1147. [DOI] [PubMed] [Google Scholar]
- WANG Z., FERMINI B., NATTEL S. Sustained depolarization-induced outward current in human atrial myocytes. Evidence for a novel delayed rectifier K+ current similar to Kv1.5 cloned channel currents. Circ. Res. 1993;73:1061–1076. doi: 10.1161/01.res.73.6.1061. [DOI] [PubMed] [Google Scholar]
- WHITE W.B. Clinical trial experience around the globe: focus on calcium-channel blockers. Clin. Cardiol. 2003;26:II7–II11. doi: 10.1002/clc.4960261404. [DOI] [PMC free article] [PubMed] [Google Scholar]
- ZHANG X., ANDERSON J.W., FEDIDA D. Characterization of nifedipine block of the human heart delayed rectifier, hKv1.5. J. Pharmacol. Exp. Ther. 1997;281:1247–1256. [PubMed] [Google Scholar]


