Abstract
Previous studies showed that ultrasound can mechanically remove tissue in a localized, controlled manner. Moreover, enhanced acoustic backscatter is highly correlated with the erosion process. “Initiation” and “extinction” of this highly backscattering environment were studied in this paper. The relationship between initiation and erosion, variability of initiation and extinction, and effects of pulse intensity and gas saturation on time to initiation (initiation delay time) were investigated. A 788-kHz single-element transducer was used. Multiple pulses at a 3-cycle pulse duration and a 20-kHz pulse repetition frequency were applied. ISPPA values between 1000 and 9000 W/cm2 and gas saturation ranges of 24%–28%, 39%–49%, and 77%–81% were tested. Results show the following: (1) without initiation, erosion was never observed; (2) initiation and extinction of the highly backscattering environment were stochastic in nature and dependent on acoustic parameters; (3) initiation delay times were shorter with higher intensity and higher gas saturation (e.g., the mean initiation delay time was 66.9 s at ISPPA of 4000 W/cm2 and 3.6 ms at ISPPA of 9000 W/cm2); and (4) once initiated by high-intensity pulses, the highly backscattering environment and erosion can be sustained using a significantly lower intensity than that required to initiate the process.
I. INTRODUCTION
Numerous studies have demonstrated the ability of producing a variety of biology effects using high-intensity pulsed ultrasound, e.g., creating cavities in the ventricular wall (Smith and Hynynen, 1998), lung hemorrhage (Child et al. 1990; Frizzell et al. 1994), intestinal hemorrhage (Dalecki et al. 1995), etc. Our previous studies showed that short, intense pulses (less than ten acoustic cycles) delivered at certain pulse repetition frequencies could achieve the most energy-efficient erosion and sharp, clearly defined perforations (Xu et al. 2004). This approach, which we call the controlled ultrasound tissue erosion (CUTE) technique, offers a potentially effective mechanism for the treatment of HLHS and other clinical problems where precise tissue removal is required.
This research was motivated by a need to noninvasively perforate the atrial septum of neonates with hypoplastic left heart syndrome (HLHS). HLHS is a congenital heart disease characterized by a dysfunctional left ventricle. It is usually fatal within 2 weeks after birth if not treated. A flow channel between the two atria (i.e., perforation of the atrial septum) must be created to extend patients’ survival until reconstructive surgery is performed. Currently, cardiac catheterization and balloon atrial septostomy is the only option, which carries a combined morbidity and mortality rate as high as 50%.
This problem differs from most applications of therapeutic ultrasound in that ultrasonic exposures producing eventual tissue necrosis is not the desired outcome. Tissue must be physically removed during treatment so as to produce a perforation in the atrial septum sufficient for a flow channel between two atria. The immediate tissue removal required in this application cannot be accomplished by the production of thermal coagulation necrosis. This suggested the exploration of acoustic cavitation as a mechanism for the necessary controlled tissue removal.
It is highly likely that transient cavitation is the primary mechanism of the erosion process based on our previous results (Xu et al. 2004). Transient cavitation is characterized by the initially explosive growth of a cavity from a small, stabilized bubble or gas pocket, followed by an appropriately energetic collapse in response to the pressure variation or stress (Leighton, 1994). Such collapses are high-energy events and can generate a wide range of potentially destructive effects [e.g., erosion (Lush and Angell 1984; Belahadji et al., 1991; Tomlinson and Matthews, 1994; Phillip and Ohl, 1995; Phillip and Lauterborn, 1998; Smith and Hynynen cell disruption (Jarman and Taylor, 1965; Dunn and Fry, 1971), and sonoluminescence (Ohl et al., 1998; Ohl, 2000; Chakravarty and Walton, 2001)].
Acoustic backscatter of the insonating sound field is often used to monitor cavitation. Researchers have successfully demonstrated the sudden increase of backscattering signals from cavitating bubbles after insonifying with high-amplitude ultrasound pulses (Fairbank and Scully, 1977; Roy et al., 1985; Atchley et al., 1988; Holland and Apfel, 1990; Roy et al., 1990a; 1990b; Madanshetty et al., 1991; Bouakaz et al., 1999; Shi et al., 2000; Chen et al., 2002). Variability of acoustic backscatter has also been used as a signature to detect cavitation (Kripfgans et al., 2000). Further efforts have been made to quantify inertial cavitaton (IC) dose through acoustic backscatter (Calabrese, 1996; Everbach et al., 1997; Poliachik et al., 1999) and relate IC dose to cavitational bioeffects (Everbach et al., 1997). In our experiments, we observed that an enhanced and rapidly changing acoustic backscatter was highly correlated with the erosion process. Accordingly, initiation and extinction of this highly backscattering environment were then investigated.
We hypothesize that the initiation of the highly backscattering environment we have seen is most likely due to generation of an ensemble of microbubbles (“bubble cloud”) which can be maintained by a train of appropriately designed acoustic pulses. Whenever subsequent pulses fail to maintain this bubble cloud, “extinction” occurs. This bubble cloud generated by acoustic pulses likely consists of a broad distribution of bubble sizes and temporal persistence. With an appropriately designed set of acoustic parameters, each pulse will affect the bubble population to produce an ensemble of effective cavitation nuclei for subsequent pulses and lead to more effective tissue erosion.
Matsumoto et al. have conducted research on modeling bubble cloud dynamics (Matsumoto et al., 2002). Among others, Jöchle et al. have used optical scattering and high-speed camera to monitor the bubble cloud generated by a lithotripter in the water (Jochle et al., 1996).
In this paper we describe our observations about the initiation and extinction of cavitation activity (possibly arising from a bubble cloud) when a tissue sample is irradiated with high-intensity, short-pulse acoustic fields. The tests detailed show how the occurrence of cavitation initiation, extinction, and the resulting cavitation-induced tissue erosion, depend on the acoustic field intensity, and the concentration of dissolved gas in the host water. We infer cavitation initiation and extinction based on the sudden appearance and disappearance of the enhanced, rapidly fluctuating, backscattered echoes received by a passive 5-MHz transducer. We have observed that without cavitation (as evidenced by the backscatter criteria for initiation) no erosion takes place.
We believe that initiation and maintenance of an appropriate set of cavitation nuclei (bubble clouds) are key to controlling the erosion process. As shown later in our results, without initiation, erosion was never observed. However, initiation is highly stochastic in nature (as is maintenance and extinction). We believe that all three processes depend strongly on acoustic parameters (e.g., pulse intensity, pulse duration, and pulse repetition frequency), and that the process can be optimized by simply changing acoustic pulse parameters. In this process, each pulse has at least two functions: (1) production of some fraction of the desired therapeutic effect, and (2) maintenance of the dynamic ensemble of caviation nuclei to optimally predispose the tissue for subsequent pulses. This approach can make the erosion process both controllable and predictable. By simple adjustment of acoustic parameters, the process might be optimized, even with feedback in real time, in order to achieve the most efficient erosion with the least possible propagated energy.
(Note that erosion, as referred to in this paper, is defined as obvious tissue removal that can be distinguished from the surrounding tissue.)
II. METHODS
A. Tissue samples
In vitro experiments were conducted on 33 porcine atrial wall samples. Porcine atrial wall was used because it is similar to the neonatal atrial septum and has a larger size. Fresh samples were obtained from a local slaughter house and used within 72 h of harvesting. All tissue specimens were preserved in a 0.9% sodium chloride solution at 4 °C prior to experimentation. A tissue holder was designed and built to fix the tissue in the exposure water tank. The atrial septum of an HLHS patient with an intact atrial septum is usually stretched due to the pressure difference between the two atria (10 mmHg and above). The tissue was stretched under tension to mimic the in vivo condition.
B. Experimental setup
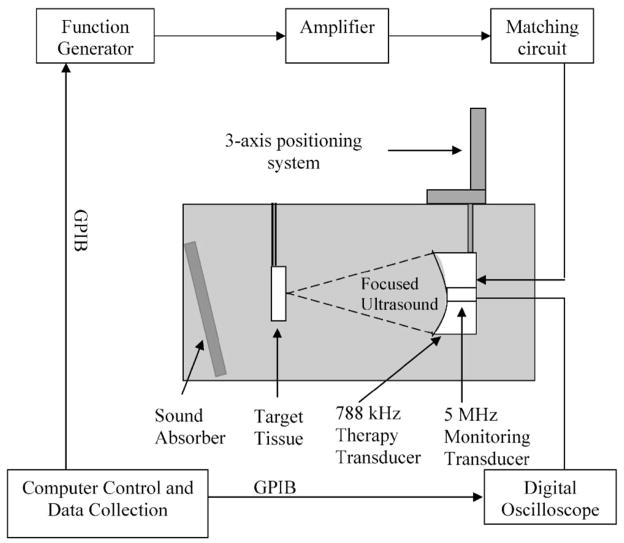
All ultrasound exposures occurred in a 61-cm-long×28-cm-wide×30.5-cm-high polycarbonate tank containing water degassed to a desired level prior to the experiment. The temperature in the tank was ~22 °C during the trials. A 788-kHz focused single-element therapy transducer (f number=1, Etalon Inc., Lebanon, IN) was mounted on a three-axis positioning system. The 788-kHz therapy transducer has an 8.8-cm aperture, an 8.8-cm focal length, and a 3.7-cm inner diameter hole for a monitoring transducer.
A focused single-element monitoring transducer with 5-MHz center frequency (f = 4, Valpey Fisher Corp., Hopkinton, MA) was mounted coaxially with the therapy transducer to receive the backscatter from the erosion zone. The 5-MHz transducer has a 2.5-cm aperture and a 10-cm focal length. The 5-MHz passive transducer is used because (1) its focal length is 10 cm and it is smaller (2.54-cm diameter) than the inner center hole (3.7-cm diameter) of the primary transducer so that we can conveniently align it confocally with the primary transducer by fixing it in the center hole; and (2) it has a wide bandwidth (−6-dB bandwidth of 4 MHz) that can detect the higher harmonic components as well as the primary frequency component.
The tissue was placed at the focus of the therapy transducer. The focus of the transducer was first found in calibration by 3D scanning and maximizing the output of the membrane hydrophone. During the experiments, the focus of the therapy transducer was then determined based on the time delay of the tissue echo received by the monitoring transducer matching the focal length of the therapy transducer obtained from the previous calibration. An angled sound absorber (40 Durometer, Sorbothane, Inc., OH) was placed behind the tissue to decrease the sound reflection from the side of the tank, thereby reducing the formation of standing waves. Figure 1 shows the experimental setup.
FIG. 1.
Experimental setup. Ultrasound pulses were delivered by the 788-kHz therapy transducer. Porcine atrial wall sample was positioned at the focus of the therapy transducer. Acoustic backscatter was received by the 5-MHz monitoring transducer.
C. Calibration
The spatial distribution of intensity of the 788-kHz transducer was measured in degassed water with a calibrated PVDF bilaminar shielded membrane hydrophone (GEC-Marconi Research Center, Chemlsford, UK). From transverse beam plots, a focal zone of 2.58-mm diameter is defined by the full width at half-maximum pressure points. The ISPPA stated in this paper is the free-field spatial peak pulse average value calculated from the pulse integral and pulse duration as prescribed by the AIUM (AIUM, 1998). Peak rarefractional pressures and peak compressional pressures corresponding to ISPPA’s between 1000–9000 W/cm2 are listed in Table I.
TABLE I.
Exposure parameters (pulse duration=3 cycles).
| ISPPA (W/cm2) | Peak compressional pressure (MPa) | Peak rarefractional pressure (MPa) |
|---|---|---|
| 1000 | 7.8 | 5.2 |
| 2000 | 11.7 | 6.6 |
| 3000 | 15.2 | 7.5 |
| 3500 | 16.7 | 7.9 |
| 4000 | 18.3 | 8.3 |
| 5000 | 21.4 | 9.0 |
| 7000 | 27.3 | 10.1 |
| 9000 | 36 | 11.6 |
D. Data collection
A total of 2000 20-μs-long waveforms was recorded using the sequence mode and single trigger of the digital oscilloscope (LeCroy 9354TM, Chestnut Ridge, NY). The oscilloscope trigger was synchronized with the therapy pulses, and the trigger time delay was adjusted such that the 20-μs-long backscattering signal was from the erosion zone. The interval between consecutive waveform recordings was set such that the whole initiation process could be recorded within the time span of the multiplication of the interval between consecutive recordings and 2000 (number of backscatter waveform collected). For example, with therapy pulses of PD 3 cycles at a PRF of 20 kHz, 2000 waveforms were recorded with a 200-μs interval between waveforms. The detected signals were digitized by the oscilloscope at a resolution of 40–100 ns. The recorded waveforms were then transferred to a computer through GPIB and processed by a MATLAB program (Mathworks, Natick, MA) to detect initiation based on criteria to be defined later. Then, the same procedures were repeated for extinction detection. But, the interval between consecutive recordings was adjusted to 240 ms so that backscatter during the 8-min ultrasound treatment could be recorded.
E. Statistical approach to detect “initiation” and “extinction”
The statistical properties of cavitation have been investigated. In particular, the probabilistic nature of cavitation using different acoustic parameters has been studied (Messino et al., 1963; Calabrese, 1996). Based on our experimental observations, the onset of initiation is accompanied by alterations in the backscatter signal, presumably associated with the onset of cavitation. One such change is a sudden increase in the backscatter amplitude at initiation. Further, this amplitude increase is followed by a chaotic fluctuation in the backscattering signal. Together, these two changes indicate an overall change in the variability of the signal as the transition is made between the uninitiated and initiated states. We developed a statistical method for the detection of initiation and extinction of the highly backscattering environment based on this change in variability.
To identify points of initiation and extinction based on variability in the backscattering signal, we applied a common technique from the area of statistical quality control of industrial processes, the Shewhart chart (Wetheril and Brown, 1991). Depending on the data, different Shewhart charts are used to identify changes in a time series process. For our particular situation, we used the s chart, where the sample standard deviation (SD) of the backscatter energy at point i in the time series is used as the measure of variability. However, for our data, a single measurement of the backscatter energy was made at each time point in a given experiment. For such “one-at-a-time” data, the SD at a single point cannot be directly estimated, and a moving SD approach is often employed.
In our situation, we used a moving window size of 3 to estimate the SD at each point i in the time series, SDi. For example, the estimate of SDi was calculated based on the backscatter energy at point i and the two points preceding it, i−1 and i−2. We define initiation to have occurred when five consecutive SDi’s exceed a threshold of four times the estimated SD of the uninitiated backscatter energy. We define extinction to have occurred when five consecutive SDi’s fall below a threshold of two times the SD of the uninitiated backscatter energy. The SD of the uninitiated backscatter energy was estimated from the first n frames of backscatter recorded prior to any high degree of variation in the signal potentially indicating initiation. The initiation threshold co-efficient of 4 and extinction threshold of 2 are used as starting values and need further investigation.
The backscattering signal was the output voltage of the monitoring transducer. Backscatter energy was calculated by integrating the square of this voltage over each line in fast time
| (1) |
where N is the number of points in one line of backscatter signal, and V(i) is the voltage value of the ith point within this line of backscatter signal.
The statistical procedure for identifying initiation and extinction consists of the following steps:
-
Step 1: the first n(10≤n≤100) frames of backscatter prior to initiation were collected. Then, the SD of backscatter energy while uninitiated could be estimated based on the first uninitiated n points using the Shewhart charts [Eq. (2)] (Wetheril and Brown, 1991)
(2) (3)
The purpose of choosing a moving range of 3 points to estimate the SD of backscatter energy while uninitiated is to be consistent with the window size used to calculate the moving SD.
Step 2: the moving SD of backscatter energy is calculated. Then, initiation and extinction can be detected based on the two previously described criteria. Both criteria are programed in MATLAB (Mathworks, Natick, MA), so initiation and extinction can be detected automatically.
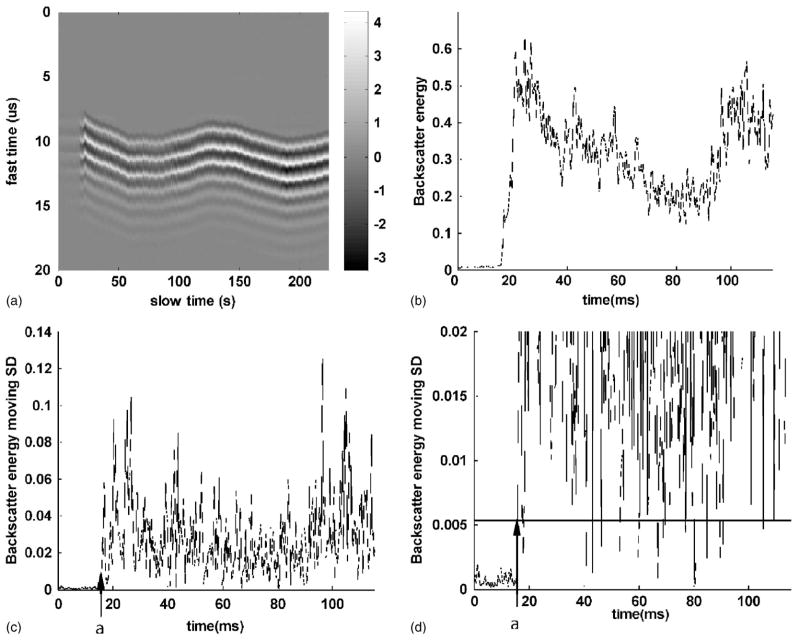
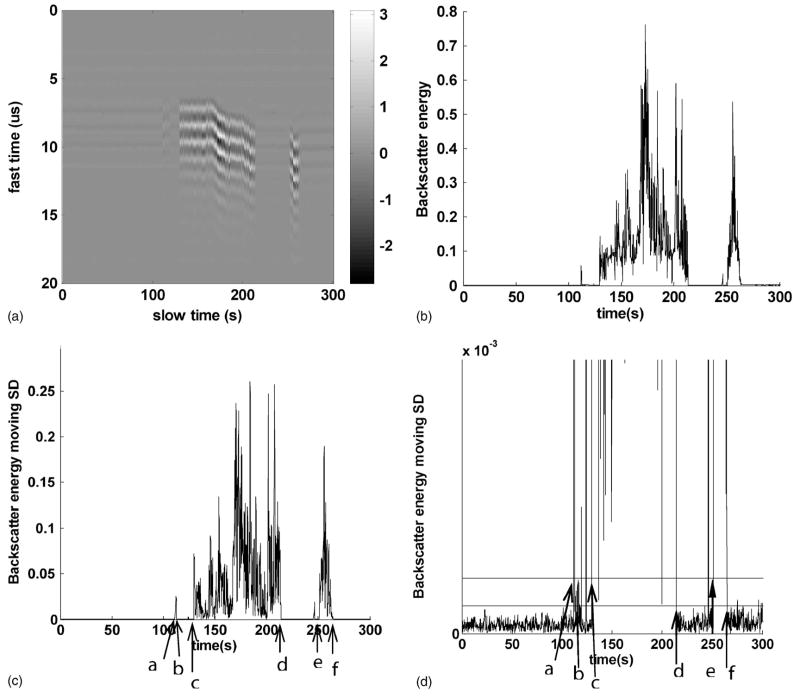
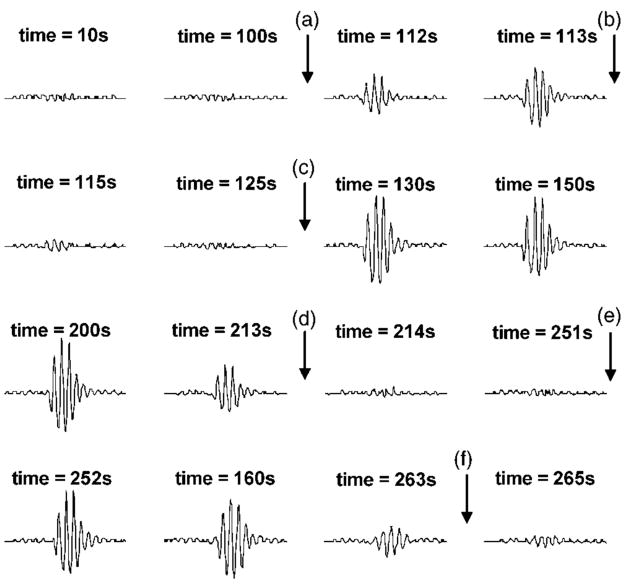
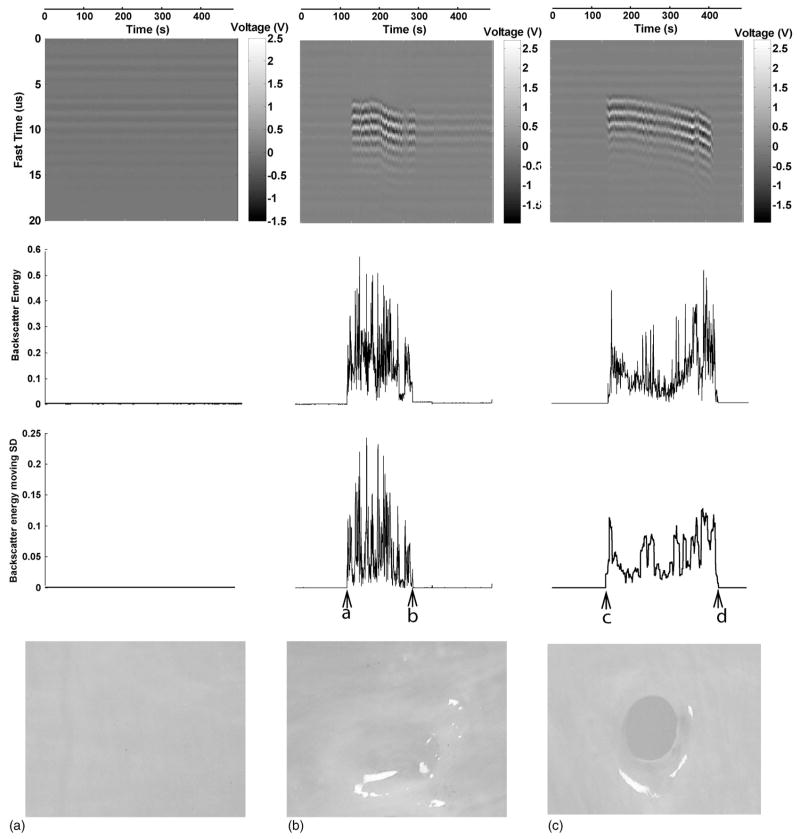
Figure 2 demonstrates the process of detecting initiation of a highly backscattering environment. Detection of extinction of a highly backscattering environment is demonstrated in figure 3. Figure 4 shows the actual waveforms of the acoustic backscatter before and after initiation and extinction. Figure 5 depicts the initiation and extinction phenomena and corresponding tissue effects generated.
FIG. 2.
Process to detect initiation of the highly backscattering environment. Panels (A), (B), (C), and (D) show the steps of initiation detection in sequence. Panel (A) shows the acoustic backscatter in fast time and slow time mode. Each vertical line shows backscatter recorded as the output voltage of the monitoring transducer in fast time. Panel (B) shows the backscatter energy versus time. Panel (C) shows the moving SD of backscatter energy versus time. Panel (D) is an expanded view of panel (C). The line is the initiation threshold, set by four times the SD estimation of uninitiated backscatter energy. In Panel (C) and (D), detected by the criteria defined for initiation, the highly backscattering environment was initiated at “a.” Ultrasound pulses with a pulse duration (PD) of 3 cycles, a pulse repetition frequency (PRF) of 20 kHz, an ISPPA of 5000 W/cm2, and gas saturation of 46% were applied.
FIG. 3.
Process to detect initiation and extinction. Panels (A), (B), (C), and (D) show the steps of initiation and extinction detection in sequence. Panel (A) shows the acoustic backscatter in fast time and slow time mode. Each vertical line shows backscatter recorded as the output voltage of the monitoring transducer in fast time. Panel (B) shows the backscatter energy versus time. Panel (C) shows the moving SD of backscatter energy versus time. Panel (D) is an expanded view of panel (C). The line above is the initiation threshold, set by four times the SD estimation of uninitiated backscatter energy. And, the line below is the extinction threshold, set by two times SD estimation of uninitiated backscatter energy. In panels (C) and (D), detected by the criteria defined for initiation and extinction, the highly backscattering environment was initiated at “a,” extinguished at “b,” spontaneously reinitiated at “c,” extinguished again at “d,” reinitiated again at “e,” and tissue was finally perforated at “f.” Ultrasound pulses with a PD of 3 cycles, a PRF of 20 kHz, an ISPPA of 4000 W/cm2, and gas saturation of 40% were applied.
FIG. 4.
Waveforms of acoustic backscatter corresponding to the data in Fig. 3. All the backscatter waveforms are 20-μs-long range gated from the erosion zone. “a”–“f” are the initiation and extinction points shown in Figs. 3(C) and (D). A highly backscattering environment was initiated at “a,” extinguished at “b,” spontaneously reinitiated at “c,” extinguished again at “d,” reinitiated again at “e,” and tissue was finally perforated at “f.” Ultrasound pulses with a PD of 3 cycles, a PRF of 20 kHz, an ISPPA of 4000 W/cm2, and gas saturation of 40% were applied.
FIG. 5.
The first row shows the acoustic backscatter in fast time and slow time mode. The second row shows the backscatter energy versus time. The third row shows the moving SD of backscatter energy versus time. The x axis (time) for each column is the same and shown above the column. The y axis for each row is the same and shown on the left side of each row. The fourth row depicts the tissue effects on porcine atrial wall tissue samples generated by the corresponding treatments. All the tissue samples were treated by a total of 8-min ultrasound pulses at an ISPPA of 3500 W/cm2, a PD of 3 cycles, a PRF of 20 kHz, and gas saturation of 40%–45%. In panel (A), neither initiation nor erosion was observed. In panel (B), initiation (“a”) and extinction (“b”) were detected and erosion was observed, but tissue was not perforated. In panel (C), initiation (“c”) was detected and erosion was observed, and tissue was perforated (“d”).
(Please note that when tissue is perforated, the backscatter variability is greatly reduced and is detected as extinction based on the above criteria.)
F. Experiment design
The initiation and extinction processes and the relationship of initiation to erosion were studied through observation of the acoustic backscatter and the tissue effects generated by the corresponding ultrasound pulses. Moreover, the effects of intensity and gas saturation on initiation delay time were investigated. Initiation delay time here is defined as the interval between the onset of acoustic pulses and the first initiation (as previously defined) of a highly backscattering environment. Initiation delay time reported in this paper only includes the cases when an initiation was detected. The initiation and extinction processes were monitored by the acoustic backscattering signal received by the 5-MHz transducer and detected by the methods described earlier.
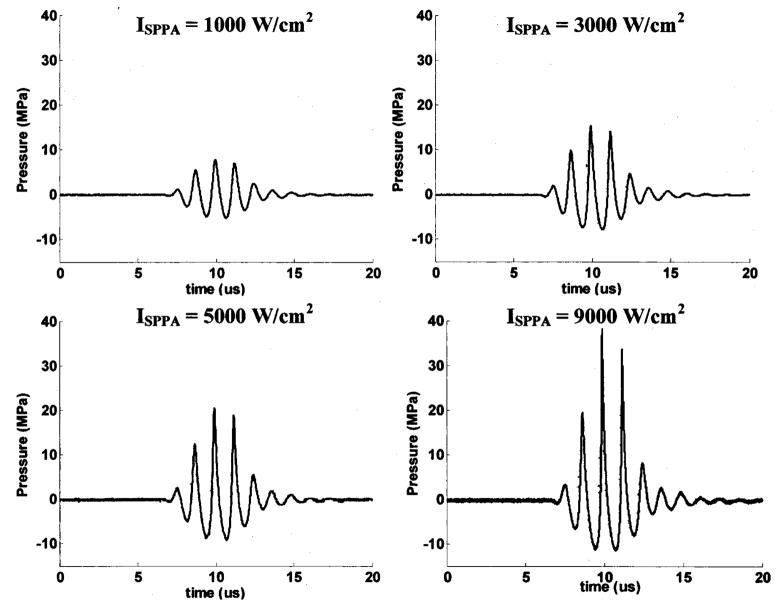
A pulse duration (PD) of 3 cycles and a pulse repetition frequency (PRF) of 20 kHz were used in all the ultrasound exposures. This set of parameters was chosen because it achieved the fastest erosion in our previous studies (Xu et al., 2004). Note that, except for the calculation of ISPPA, PD is defined as the number of cycles in the waveform at the output of the function generator (Fig. 6). The parameters used in the following experiments were randomized.
FIG. 6.
The waveform of the therapeutic ultrasound signal with a PD of 3 cycles and ISPPA’s of 1000, 3000, 5000, and 9000 W/cm2 delivered by the 788-kHz therapy transducer as recorded by a membrane hydrophone. PD used in this paper is given as the number of cycles in the waveform at output of the function generator. However, the calculation of ISPPA uses the appropriate definition of the PD.
For studies of the effects of intensity on the initiation delay time, gas saturation was set to 39%–49%. ISPPA’s of 1000, 2000, 3000, 4000, 5000, 7000, and 9000 W/cm2 were tested. For studies of the effects of gas saturation on initiation delay time, ISPPA was kept constant at 5000 W/cm2. Gas saturations of three different ranges of 24%–28%, 39%–49%, 77%–81% were used. All these data were also used in the study of the initiation and extinction processes and the relationship of initiation to erosion. The partial pressure of oxygen (PO2) in air was used as our metric for gas saturation and the PO2 level was measured with YSI dissolved oxygen instruments (YSI 5000, Yellow Springs, OH).
III. RESULTS
A total of 95 ultrasound treatments was applied to 33 pieces of 1–3-mm-thick porcine atrial wall. The acoustic backscattering signals recorded and tissue effects produced by the corresponding ultrasound treatments are included in the following analysis. The initiation phenomenon was observed in 62 of 95 treatments (Table II). The extinction (excluding perforation) phenomenon was observed in 17 of 95 treatments (Table III).
TABLE II.
Number of recorded initiation and erosion events.
| ISPPA (W/cm2) | Gas saturation | Number of treatments | Initiation and erosion | No initiation and no erosion | Initiation but no erosion | No initiation but erosion |
|---|---|---|---|---|---|---|
| 1000 | 39%–49% | 12 | 0 | 12 | 0 | 0 |
| 2000 | 39%–49% | 12 | 0 | 11 | 1 | 0 |
| 3000 | 39%–49% | 12 | 4 | 7 | 0 | 0 |
| 3500 | 39%–49% | 8 | 5 | 3 | 0 | 0 |
| 4000 | 39%–49% | 12 | 12 | 0 | 0 | 0 |
| 5000 | 24%–28% | 8 | 8 | 0 | 0 | 0 |
| 5000 | 39%–49% | 8 | 8 | 0 | 0 | 0 |
| 5000 | 77%–81% | 8 | 8 | 0 | 0 | 0 |
| 7000 | 39%–49% | 8 | 8 | 0 | 0 | 0 |
| 9000 | 39%–49% | 8 | 8 | 0 | 0 | 0 |
| Treatment number | 95 | 61 | 33 | 1 | 0 | |
| Success prediction rate | 98.9% | |||||
TABLE III.
Number of recorded extinction (excluding perforation) events.
| ISPPA (W/cm2) | Gas saturation | Number of treatments | Number of treatments with extinction (excluding perforation) | Number of extinction events |
|---|---|---|---|---|
| 1000 | 39%–49% | 12 | 0 | 0 |
| 2000 | 39%–49% | 12 | 1 | 1 |
| 3000 | 39%–49% | 11 | 4 | 5 |
| 3500 | 39%–49% | 8 | 4 | 13 |
| 4000 | 39%–49% | 12 | 6 | 8 |
| 5000 | 24%–28% | 8 | 1 | 1 |
| 5000 | 39%–49% | 8 | 0 | 0 |
| 5000 | 77%–81% | 8 | 0 | 0 |
| 7000 | 39%–49% | 8 | 1 | 1 |
| 9000 | 39%–49% | 8 | 0 | 0 |
| Treatment number | 95 | 17 | 29 | |
A. Relationship between initiation and erosion
Results show that the initiation and the erosion processes are highly correlated. As shown in Table II, no erosion was observed in any of the 33 treatments where initiation was not detected. Among 61 of 62 treatments where initiation was detected, visible erosion was also observed in the tissue. Therefore, initiation predicted erosion, or lack or erosion, successfully at a rate of 98.9% (94 out of 95 treatments).
Figure 5 graphically depicts the correlation between initiation and erosion. All three tissue samples were treated for 8 min by ultrasound pulses with a PD of 3 cycles, a PRF of 20 kHz, an ISPPA of 3500 kHz, and gas saturation of 40%–45%. The first three rows show the backscatter in fast time and slow time mode, backscatter energy versus time, and the moving SD of backscatter energy versus time, respectively. The pictures in the last row show the tissue effects generated by the corresponding ultrasound treatments. In panel (A), a nearly flat backscatter energy moving SD trace indicates that no initiation occurred, and there was no erosion in the tissue. In panels (B) and (C), the backscatter energy moving SD increased significantly and remained high for a period of time. Correspondingly, erosion appeared in both tissue samples.
B. Variability of initiation and extinction
Initiation was highly stochastic in nature, particularly at intermediate intensities (~3000 W/cm2). For example, at ISPPA’s of 3000 and 3500 W/cm2, initiation occurred in an unpredictable manner (Table IV). The same 8-min ultrasound exposure (3-cycle PD, 20-kHz PRF and 39%–49% gas saturation) was applied to all the treatments reported in Table IV. In 10 of 19 treatments, however, neither initiation nor erosion was observed (Table IV). Both initiation and erosion were observed in the other nine cases.
TABLE IV.
Number of recorded initiation, erosion, and perforation events at ISPPA’s of 3000–3500 W/cm2.
| ISPPA (W/cm2) | Number of treatments | No initiation and no erosion | Initiation and erosion | Initiation and erosion, no perforation | Initiation and perforation | No initiation, but erosion | Initiation, but no erosion |
|---|---|---|---|---|---|---|---|
| 3000 | 11 | 7 | 4 | 4 | 0 | 0 | 0 |
| 3500 | 8 | 3 | 5 | 1 | 4 | 0 | 0 |
| Treatment number | 19a | 10a | 9a | 5 | 4 | 0 | 0 |
Marks the columns referred to in the text.
After initiation, extinction also occurred in a random manner at intermediate intensities. An 8-min ultrasound exposure (ISPPA’s of 3000–4000 W/cm2, 3-cycle PD, 20-kHz PRF, 39%–49% gas saturation) was applied to all the treatments in Table V. But, out of 21 treatments during which initiation was observed, extinction was detected in 14 cases (Table V).
TABLE V.
Number of recorded extinction and reinitation events at ISPPA’s of 3000–4000 W/cm2.
| ISPPA (W/cm2) | Number of treatments | Initiation and erosion | Extinction | Extinction, no reinitiation, and no perforation | Extinction, reinitiation, but no perforation | Extinction, reinitiation, and perforation |
|---|---|---|---|---|---|---|
| 3000 | 11 | 4 | 4 | 3 | 1 | 0 |
| 3500 | 8 | 5 | 4 | 0 | 1 | 3 |
| 4000 | 12 | 12 | 6 | 0 | 0 | 6 |
| Treatment number | 31 | 21a | 14a | 3a | 2a | 9a |
Marks the columns referred to in the text.
Furthermore, in some treatments, extinction events and subsequent reinitiation of the highly backscattering environment occurred in an unpredictable manner (Table V). In 3 out of the 14 treatments where extinction was detected, no subsequent reinitiation occurred. Erosion was observed; none of these tissue samples was perforated. In two treatments, multiple extinction and reinitiation events occurred, and erosion without perforation was observed. In the remaining nine treatments, multiple extinction and reinitiation events were observed, and tissue was eventually perforated.
Figure 5 demonstrates the variability of initiation and extinction resulting in different tissue effects even when the same acoustic parameters were applied. In panel (A), neither initiation nor erosion was seen. In panel (B), both initiation and extinction were detected, and the tissue was eroded, although no perforation occurred within the 8-min exposure. In panel (C), initiation without extinction was observed, and the tissue was perforated.
C. Initiation delay time versus intensity
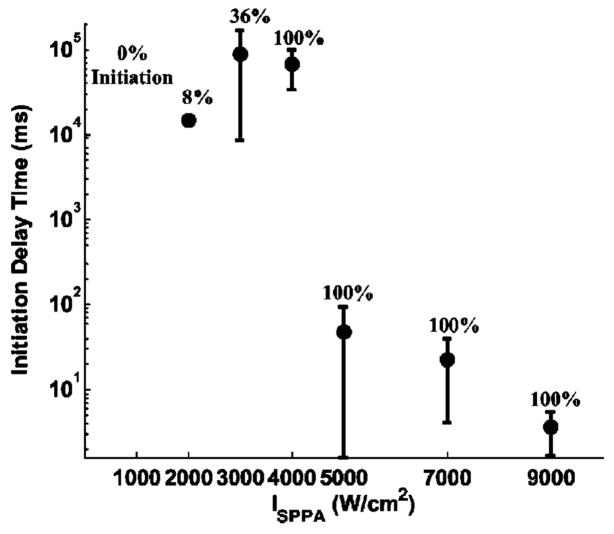
Multiple pulses at a PD of 3 cycles, a PRF of 20 kHz, and ISPPA’s of 1000, 2000, 3000, 4000, 5000, 7000, and 9000 W/cm2 were applied. Gas saturation was kept at 39%–49%. At ISPPA’s of 1000 and 2000 W/cm2, initiation was almost never observed within the 8-min ultrasound exposure (Fig. 7). At an ISPPA of 3000 W/cm2, initiation sometimes occurred after one or more minutes (Fig. 7). At an ISPPA at or above 4000 W/cm2, initiation always occurred (Fig. 7).
FIG. 7.
Initiation delay time as a function of ISPPA. ISPPA’s of 1000, 2000, 3000, 4000, 5000, 7000, and 9000 W/cm2 were tested. A PD of 3 cycles, a PRF of 20 kHz, and gas saturation range of 39%–49% were used for all the ultrasound exposures. Initiation delay time was plotted as mean and standard deviation values. The sample size is listed as number of treatments in Table VI. The number above each data point is the percentage of trial in which initiation was detected for this same set of parameters. Initiation delay time was shorter with high intensity. For example, the mean initiation delay time was 66.9 s at an ISPPA of 4000 W/cm2 and 3.6 ms at an ISPPA of 9000 W/cm2, a 4-order-of-magnitude difference (p<0.0001; t-test).
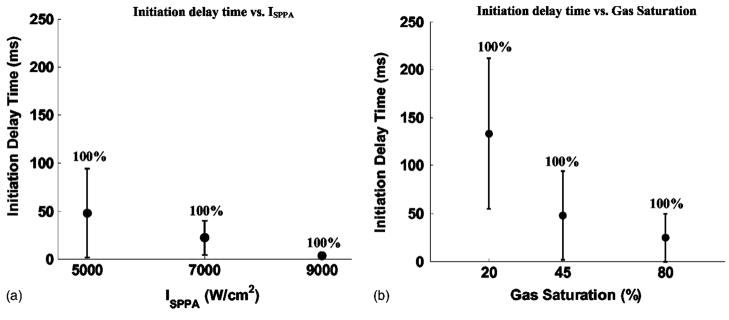
The initiation delay time is dependent upon intensity. It was shorter with higher intensity [Fig. 7, Fig. 8(A)]. The sample size for each ISPPA is listed in Table VI. For example, the mean initiation delay time was 66.9 s at an ISPPA of 4000 W/cm2 and 3.6 ms at an ISPPA of 9000 W/cm2, a 4-order-of-magnitude difference (p<0.0001; T-test) (Table VI). Variances in the initiation delay times were also lower with higher intensity. For example, the standard deviation in initiation delay time was 33.3 s at an ISPPA of 4000 W/cm2 and 1.9 ms at an ISPPA of 9000 W/cm2, a 4-order-of-magnitude difference (Table VI).
FIG. 8.
Panel (A) shows the initiation delay time as a function of intensity. ISPPA’s of 5000, 7000, and 9000 W/cm2 were tested. A PD of 3 cycles, a PRF of 20 kHz, and gas saturation of 39%–49% were applied to all the exposures in panel (A). Initiation delay times and variances in initiation delay times were shorter with higher intensity. For example, the mean initiation delay time was 48.0 ms at an ISPPA of 5000 W/cm2 and 3.6 ms at an ISPPA of 9000 W/cm2. Panel (B) shows the initiation delay time as a function of gas saturation. Gas saturation ranges of 24%–28%, 39%–49%, 77%–81% were tested and plotted as gas saturations of 25%, 45%, and 80% for convenience of display. A PD of 3 cycles, a PRF of 20 kHz, and an ISPPA of 5000 W/cm2 were applied to all the exposures in panel (B). Initiation delay times and variances in initiation delay times were shorter with higher gas saturation. For example, the mean initiation delay time was 133.1, 48.0, and 24.7 ms at gas saturation ranges of 21%–24%, 39%–49%, and 77%–81%, respectively. Initiation delay time was plotted as mean and standard deviation values (N=8) in both panels. The number above each data point is the percentage of trial in which initiation was detected for the same set of parameters.
TABLE VI.
Initiation delay time.
| Initiation delay time (ms) |
||||||
|---|---|---|---|---|---|---|
| ISPPA (W/cm2) | Gas saturation | Treatment | Initiation | Initiation percentage | Mean | Standard deviation |
| 1000 | 39%–49% | 12 | 0 | 0 | … | … |
| 2000 | 39%–49% | 12 | 1 | 8.3% | 14 459.2 | 0 |
| 3000 | 39%–49% | 11 | 4 | 36.4% | 88 429.9 | 79 879.6 |
| 4000 | 39%–49% | 12 | 12 | 100% | 66 865.3 | 33 287.4 |
| 5000 | 24%–28% | 8 | 8 | 100% | 133.1 | 78.3 |
| 5000 | 39%–49% | 8 | 8 | 100% | 48.0 | 46.4 |
| 5000 | 77%–81% | 8 | 8 | 100% | 24.7 | 25.0 |
| 7000 | 39%–49% | 8 | 8 | 100% | 22.1 | 18.0 |
| 9000 | 39%–49% | 8 | 8 | 100% | 3.6 | 1.9 |
D. Initiation delay time versus gas saturation
Multiple pulses at a PD of 3 cycles, a PRF of 20 kHz, and an ISPPA of 5000 W/cm2 were applied. Gas saturation in the ranges of 24%–28%, 39%–49%, and 77%–81% were used to study the effects of gas saturation on initiation delay time. The sample size was eight for each gas saturation range. Results show that the initiation delay time was shorter with higher gas saturation [Fig. 8(B)]. For example, the mean initiation delay times were 133.1, 48.0, and 24.7 ms at gas saturation ranges of 21%–24%, 39%–49%, and 77%–81%, respectively (Table VI). The variances of initiation delay times were lower with higher gas saturation. For example, the standard deviations of initiation delay time were 78.3, 46.4, and 25.0 ms at gas saturation ranges of 21%–24%, 39%–49%, and 77%–81%, respectively (Table VI).
E. High-intensity initiating sequences
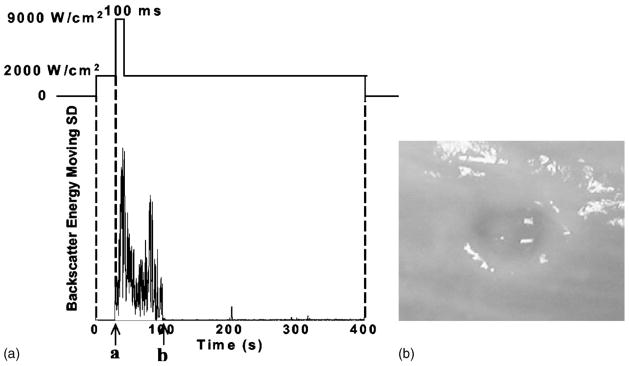
Our results also show that, once initiated, the highly backscattering environment can be maintained at significantly lower pulse intensities than that required to initiate the process. Figure 9 demonstrates that, after initiation with 100-ms 9000 W/cm2 pulses, a highly backscattering environment associated with observed erosion could be continued with 2000-W/cm2 pulses. Among 12 treatments at 2000 W/cm2, without an initiation sequence at 9000 W/cm2, initiation occurred only once and no erosion was observed in any of the 12 cases (Table II). A PD of 3 cycles and a PRF of 20 kHz were used in both the high-intensity initiating pulses and low-intensity sustaining pulses.
FIG. 9.
In panel (A), acoustic pulses with an ISPPA of 2000 W/cm2 were applied from time 0 to 400 s. Panel (A) shows the moving SD of backscatter energy versus time. No initiation was detected until 100-ms 9000 W/cm2 pulses were applied at “a” (initiation). The highly backscattering environment was continued by 2000-W/cm2 pulses and extinguished at “b” (extinction). Panel (B) shows the erosion observed in the porcine wall tissues produced by the corresponding acoustic pulses. Please note that no erosion was produced at 2000 W/cm2 alone among 12 treatments tested (Table II). (All the pulses applied were at a PD of 3 cycles, a PRF of 20 kHz, and gas saturation of 42%–43%).
IV. DISCUSSION
In this paper, we show that without initiation of a highly backscattering environment, there is no erosion. The initiation predicted erosion or lack of erosion successfully at a rate of 98.9% (Table II). Initiation and extinction phenomena were also observed in the in vivo experiments performed by our colleague Tran (Tran et al., 2003). Tran et al. show that without initiation, no lesion was created in kidney tissues. We believe that initiation is the key to decreasing the variability of cavitational bioeffects often reported in the literature (Fry et al., 1995).
We hypothesize that initiation of a highly backscattering environment is due to the generation of a dynamic ensemble of microbubbles (“bubble cloud”) which are maintained over time by an appropriately designed series of acoustic pulses. A bubble cloud likely contains microbubbles of various sizes and temporal persistence, many of which are effective cavitation nuclei. Whenever subsequent pulses fail to maintain a “predisposing” bubble cloud, extinction occurs. This bubble cloud is easily detected through observation of an enhanced rapidly changing acoustic backscattering environment.
Our hypothesis is consistent with the results that initiation delay times and variances in initiation delay times are shorter with higher gas saturation. With higher gas content, more nuclei are available to initiate the ensemble of microbubbles. Therefore, it takes less time to initiate the bubble cloud, and the probability of initiation is high. A similar explanation can be applied to results showing that initiation delay times and variances in initiation delay times are shorter with higher ISPPA. With higher ISPPA, the volume where the pulse intensities are greater than the cavitation threshold is larger. The size range of microbubbles that can be utilized as effective cavitation nuclei also increases as intensity increases (Apfel and Holland, 1991). As a result, with higher ISPPA, more cavitation nuclei are available to initiate the bubble cloud.
Furthermore, a cooperative environment between the acoustic pulses and the bubble cloud is also required to achieve the desired tissue outcome. This is supported by our results showing that the extinction was observed and perforation was not generated at some intermediate intensities (e.g., an ISPPA of 3000 W/cm2). The failure to achieve perforation is possibly due to the inability of acoustic pulses to maintain the bubble cloud.
We hypothesize that, with appropriately adjusted acoustic pulse parameters, each pulse arrives to find appropriate cavitation nuclei within the bubble cloud to produce some desired tissue effect after the bubble cloud is initiated. Other bubbles in the bubble cloud, along with “fragments” of microbubbles generated from previous energetic collapses, undergo dynamic changes (e.g., grow, decay, or spatially move) to form more cavitation nuclei at the focus, therefore predisposing the cloud for subquent pulses. Our goal is to design a set of acoustic parameters, perhaps temporally changing based on real-time feedback, in order to create an optimum cooperative condition where each pulse can both generate desired tissue effects and provide sufficient cavitation nuclei for the next pulse.
Tissue erosion by high-intensity ultrasound is a very complex process. We postulate that tissue erosion can be achieved through several mechanisms, including cavitational and noncavitational mechanisms. The high correlation between the backscatter behavior and erosion seen in these studies suggests that under the conditions used here, the mechanism is likely associated with cavitation including fluid effects such as water jets and microstreaming. However, this does not preclude a contribution from other noncavitational effects. At this point, we do not have a detailed understanding of the mechanism for the tissue erosion and how the activity of the bubble cloud changes temporally and spatially with acoustic parameters. In order to understand the mechanisms responsible for this erosion process, we are planning experiments using optical attenuation and scattering methods and high-speed camera to monitor the activity of bubble cloud generated by ultrasound pulses and interaction between the bubble cloud and the tissue.
Our results also show that once the highly backscattering environment (and erosion) is initiated by high-intensity pulses, it can be maintained, and erosion can be continued by significantly lower intensity pulses than that required for initiation. This suggests a strategy where short, high-intensity pulses are used to initiate the highly backscattering environment, low-intensity pulses are used to maintain it, and high-intensity pulses are used again (when necessary) to reinitiate it when extinction is detected. We believe this strategy will allow us to operate the erosion process at a lower intensity, thus minimizing propagated energy and perhaps preventing thermal damage to the overlying tissue and the transducer.
An attempt has been made to develop a statistical approach to detect initiation and extinction based on backscatter variability. It should not be surprising that a violently cavitating environment associated with tissue erosion is highly correlated with high backscatter variability. High variability, particularly related to cavitational bioeffects, has been an impediment to the development of therapeutic applications (Fry et al., 1995). Understanding and controlling the variability, particularly the “initiation” and “extinction” phenomena, may be the key to making cavitational therapy predictable and controllable.
It is also worth noting that extinction may provide a useful means for perforation detection. If tissue is not perforated, reinitiation can be easily achieved by high-intensity pulses. Therefore, a reinitiation test after extinction may serve as a way to detect perforation. Color-flow Doppler imaging would also be used for this purpose. Perforation of atrial septum can be determined by the detection of a blood flow between two atria in the in vivo situation (Xu et al., 2004).
In summary, we believe that a thorough understanding of initiation and extinction are the key to controlling the erosion process as well as other therapeutic bioeffects produced by cavitation. Proper maintenance of a synergistic interaction between insonation and the dynamically changing ensemble of microbubbles can be controlled by adjustment of acoustic parameters (e.g., pulse intensity, PD, and PRF). Our goal is to make the maintenance of the synergistic environment controllable and predictable with a minimum of propagated energy. Furthermore, it may be possible to achieve this control using easily obtained variations in acoustic pulse parameters under real-time feedback condition.
V. CONCLUSIONS
There is a high correlation between the enhanced, rapidly changing backscatter and the erosion process. The presence and absence of initiation of the highly backscatter environment successfully predict erosion and lack of erosion at a rate of 98.9%. Initiation delay time, presumably the formation time of the bubble cloud, decreases significantly with higher intensity. Further, once initiated, erosion can be maintained at a lower intensity than that required for initiation. We believe that understanding of the underlying mechanism of initiation (and possible extinction) of an ensemble of predisposing microbubbles is the key to controlling the erosion process as well as many other therapeutic effects due to cavitation.
Acknowledgments
We would like thank Dr. Achi Ludomirsky for his consultation in HLHS and other congenital cardiac diseases. We also thank Dr. Oliver Kripfgans and Jessica Parsons for their help with the calibration procedure. This research has been funded by grants from the National Institutes of Health RR14450.
Contributor Information
Zhen Xu, Department of Biomedical Engineering, University of Michigan, Ann Arbor, Michigan 48109.
J. Brian Fowlkes, Department of Radiology and Biomedical Engineering, University of Michigan, Ann Arbor, Michigan 48109.
Edward D. Rothman, Department of Statistics, University of Michigan, Ann Arbor, Michigan 48109
Albert M. Levin, Department of Epidemiology, University of Michigan, Ann Arbor, Michigan 48109
Charles A. Cain, Department of Biomedical Engineering, University of Michigan, Ann Arbor, Michigan 48109
References
- AIUM (1998). Acoustic Output Measurement Standard for Diagnostic Ultrasound Equipment, AIUM/NEMA.
- Apfel RE, Holland CK. Gauging the likelihood of cavitation from short-pulse, low-duty cycle diagnostic ultrasound. Ultrasound Med Biol. 1991;17:179–185. doi: 10.1016/0301-5629(91)90125-g. [DOI] [PubMed] [Google Scholar]
- Atchley AA. Thresholds for cavitation produced in water by pulsed ultrasound. Ultrasonics. 1988;26:xxx–xxx. doi: 10.1016/0041-624x(88)90018-2. [DOI] [PubMed] [Google Scholar]
- Belahadji B, Franc JP, Michel JM. A statistical analysis of cavitation erosion pits. J Fluids Eng. 1991;113:700–706. [Google Scholar]
- Bouakaz A, Frinking PJA, Jong ND, Bom N. Noninvasive measurement of the hydrostatic pressure in a fluid-filled cavity based on the disappearance time of micrometer-sized free gas bubbles. Ultrasound Med Biol. 1999;25:1407–1415. doi: 10.1016/s0301-5629(99)00109-x. [DOI] [PubMed] [Google Scholar]
- Calabrese AM. PhD. thesis: “Threshold measurements and production rates for inertial cavitation due to pulsed, megahertz-frequency ultrasound“. Chaps. 5 and 6. The University of Mississippi; 1996. [Google Scholar]
- Chakravarty A, Walton AJ. Light emission from collapsing superheated steam bubbles in water. J Lumin. 2001;92:27–33. [Google Scholar]
- Chen WS, Matula TJ, Crum LA. The disappearance of ultrasound contrast bubbles: Observations of bubble dissolution and cavitation nucleation. Ultrasound Med Biol. 2002;28:793–803. doi: 10.1016/s0301-5629(02)00517-3. [DOI] [PubMed] [Google Scholar]
- Child SZ, Hartman CL, Schery LA, Carstensen EL. Lung damage from exposure to pulsed ultrasound. Ultrasound Med Biol. 1990;16:817–825. doi: 10.1016/0301-5629(90)90046-f. [DOI] [PubMed] [Google Scholar]
- Dalecki D, Raeman CH, Child SZ, Carstensen EL. Intestinal hemorrhage from exposure to pulsed ultrasound. Ultrasound Med Biol. 1995;21:1067–1072. doi: 10.1016/0301-5629(95)00041-o. [DOI] [PubMed] [Google Scholar]
- Dunn F, Fry FJ. Ultrasonic threshold dosages for the mammalian central nervous system. IEEE Trans Biomed Eng. 1971;18:253–256. doi: 10.1109/tbme.1971.4502847. [DOI] [PubMed] [Google Scholar]
- Everbach EC, Makin I, Azadniv M, Meltzer RS. Correlation of ultrasound-induced hemolysis with cavitation detector output in vitro. Ultrasound Med Biol. 1997;23:619–624. doi: 10.1016/s0301-5629(97)00039-2. [DOI] [PubMed] [Google Scholar]
- Fairbank WM, Scully MO. A new non-invasive technique for cardiac pressure measurement resonant scattering of ultrasound from bubble. IEEE Trans Biomed Eng BME-24. 1977:107–110. doi: 10.1109/TBME.1977.326112. [DOI] [PubMed] [Google Scholar]
- Frizzell LA, Chen E, Lee C. Effects of pulsed ultrasound on the mouse neonate: Hind limb paralysis and lung hemorrhage [Comment] Ultrasound Med Biol. 1994;20:53–63. doi: 10.1016/0301-5629(94)90017-5. [DOI] [PubMed] [Google Scholar]
- Fry FJ, Sanghvi NT, Foster RS, Bihrle R, Hennige C. Ultrasound and microbubbles: Their generation, detection, and potential utilization in tissue and organ therapy—experimental. Ultrasound Med Biol. 1995;21:1227–1237. doi: 10.1016/0301-5629(96)89519-6. [DOI] [PubMed] [Google Scholar]
- Holland CK, Apfel RE. Thresholds for transient cavitation produced by pulsed ultrasound in a controlled nuclei environment. J Acoust Soc Am. 1990;88:2059–2069. doi: 10.1121/1.400102. [DOI] [PubMed] [Google Scholar]
- Jarman PD, Taylor KJ. Light flashes and shocks from a cavitation flow. Br J Appl Phys. 1965;16:675–682. [Google Scholar]
- Jochle K, Debus J, Lorenz WJ, Huber P. A new method of quantitative cavitation assessment in the field of a lithotripter. Ultrasound Med Biol. 1996;22:329–338. doi: 10.1016/0301-5629(96)00031-2. [DOI] [PubMed] [Google Scholar]
- Kripfgans OD, Fowlkes JB, Miller DL, Eldevik OP, Carson PL. Acoustic droplet vaporization for therapeutic and diagnostic applications. Ultrasound Med Biol. 2000;26:1177–1189. doi: 10.1016/s0301-5629(00)00262-3. [DOI] [PubMed] [Google Scholar]
- Leighton TG. The Acoustic Bubble. Academic; London: 1994. [Google Scholar]
- Lush PA, Angell B. Correlation of cavitation erosion and sound pressure level. J Fluids Eng. 1984;106:347–351. [Google Scholar]
- Madanshetty SI, Roy RA, Apfel RE. Acoustic microcavitation: Its active and passive acoustic detection. J Acoust Soc Am. 1991;90:1515–1526. doi: 10.1121/1.401891. [DOI] [PubMed] [Google Scholar]
- Matsumoto Y, Yoshizawa S, Teiichiro I. Dynamics of bubble cloud in focused ultrasound. International Symposium on Therapeutic Ultrasound; Seattle, WA. 2002. pp. 290–299. [Google Scholar]
- Messino CD, Sette D, Wanderlingh F. Statistical approach to ultrasonic cavitation. J Acoust Soc Am. 1963;35:1575–1583. [Google Scholar]
- Ohl CD. Luminescence from acoustic-driven laser-induced cavitation bubbles. Phys Rev E. 2000;61:1497–1500. doi: 10.1103/physreve.61.1497. [DOI] [PubMed] [Google Scholar]
- Ohl CD, Lindau O, Lauterborn W. Luminescence from spherically and aspherically collapsing laser induced bubbles. Phys Rev Lett. 1998;80:393–396. [Google Scholar]
- Phillip A, Lauterborn W. Cavitation erosion by single laser-produced bubbles. J Fluid Mech. 1998;361:75–116. [Google Scholar]
- Phillip A, Ohl CD. Single bubble erosion on a solid surface. Interational Symposium on Cavitation, CAV’95; Deuville, France. 1995. pp. 297–303. [Google Scholar]
- Poliachik SL. Effect of high-intensity focused ultrasound on whole blood with and without microbubble contrast agent. Ultrasound Med Biol. 1999;25:991–998. doi: 10.1016/s0301-5629(99)00043-5. [DOI] [PubMed] [Google Scholar]
- Roy RA, Church CC, Calabrese A. Cavitation produced by short pulses of ultrasound. In: Blackstock DT, Hamilton MF, editors. Frontiers of Nonlinear Acoustics, 12 ISNA. Elsevier; Amsterdam: 1990a. pp. 476–491. [Google Scholar]
- Roy RA, Madanshetty SI, Apfel RE. An acoustic backscattering technique for the detection of transient cavitation produced by microsecond pulses of ultrasound. J Acoust Soc Am. 1990b;87:2451–2458. doi: 10.1121/1.399091. [DOI] [PubMed] [Google Scholar]
- Roy RA, Atchley AA, Crum LA, Fowlkes JB, Reidy JJ. A precise technique for the measurement of acoustic cavitation thresholds and some preliminary results. J Acoust Soc Am. 1985;78:1799–1805. doi: 10.1121/1.392767. [DOI] [PubMed] [Google Scholar]
- Shi WT, Forsberg F, Tornes A, Ostensen J, Goldberg BB. Destruction of contrast microbubbles and the association with inertial cavitation. Ultrasound Med Biol. 2000;26:1009–1019. doi: 10.1016/s0301-5629(00)00223-4. [DOI] [PubMed] [Google Scholar]
- Smith NB, Hynynen K. The feasibility of using focused ultrasound for transmyocardial revascularization. Ultrasound Med Biol. 1998;24:1045–1054. doi: 10.1016/s0301-5629(98)00086-6. [DOI] [PubMed] [Google Scholar]
- Tomlinson WJ, Matthews SJ. Cavitation erosion of aluminium alloys. J Mater Sci. 1994;29:1101–1108. [Google Scholar]
- Tran BC. In Vivo Comparison of Multiple Pulse and CW strategies for Microbubble-Enhanced Ultrasound Therapy. IEEE Ultrasonics Symposium; Hawaii. 2003. pp. 1J–4. [Google Scholar]
- Wetheril GB, Brown DW. Statistical Process Control Theory and Practice. Chapman and Hall; London: 1991. [Google Scholar]
- Xu Z. Controlled ultrasound tissue erosion. IEEE Trans Ultrason Ferroelectr Freq Control. 2004;51:726–736. doi: 10.1109/tuffc.2004.1308731. [DOI] [PMC free article] [PubMed] [Google Scholar]


