

Abstract
The extent to which occupational exposure to ozone in ambient air can affect lung function remains unclear. We conducted a panel study in 43 mail carriers by measuring their peak expiratory flow rates (PEFRs) twice daily for 6 weeks in 2001. The daily exposure of each mail carrier to O3, particulate matter < 10 μm in aerodynamic diameter (PM10), and nitrogen dioxide was estimated by one air monitoring station in the center of the mail carrier’s delivery area. Hourly concentrations of air pollutants during their exposure periods were 6–96 ppb for O3, 11–249 μg/m3 for PM10, and 14–92 ppb for NO2. Linear mixed-effects models were used to estimate the association between air pollution exposures and PEFR after adjusting for subject’s sex, age, and disease status and for temperature and humidity. We found that night PEFR and the deviation in night PEFR were significantly decreased in association with 8-hr O3 exposures with a lag 0–2 days and by daily maximum O3 exposures with a lag of 0–1 day in our multipollutant models. By contrast, neither PM10 nor NO2 was associated with a PEFR reduction. Daily 8-hr mean concentrations of O3 had greater reduction effects on PEFR than did daily maximum concentrations. For a 10-ppb increase in the 8-hr average O3 concentration, the night PEFR was decreased by 0.54% for a 0-day lag, 0.69% for a 1-day lag, and 0.52% for a 2-day lag. We found that an acute lung function reduction occurs in mail carriers exposed to O3 concentrations below current ambient air quality standards and occupational exposure limits.
Keywords: deviation, lung function, mail carrier, ozone exposure, peak expiratory flow rate
Epidemiologic evidence suggests that exposures to short-term ambient ozone are associated with consistent and reversible decrements in lung function among children (Burnett et al. 2001; Chen et al. 1999; Hoppe et al. 2003; Jalaludin et al. 2000), the elderly (Hoppe et al. 1995, 2003), and people with a history of respiratory diseases (Hoppe et al. 1995, 2003; Jorres et al. 1996; Kehrl et al. 1999). Recent studies also found that exposures to O3 are related to healthy adults’ decreases in lung function, such as forced expiratory volume in 1 sec (FEV1), forced vital capacity (FVC), and peak expiratory flow rate (PEFR) (Kinney and Lippmann 2000; Korrick et al. 1998; Naeher et al. 1999; Spektor et al. 1988). These effects usually occur at ambient O3 concentrations between 30 and 80 ppb during high O3 hours between 0900 and 1700 hr. Such O3 concentrations are lower than the U.S. ambient air quality standards for O3, which are an 8-hr average at 80 ppb and a 1-hr maximum at 120 ppb, and below the permissible exposure level for workers promulgated by the U.S. Occupational Safety and Health Administration (2004), which is an 8-hr time-weighted average of 100 ppb. Incidentally, the exposure duration between 0900 and 1700 hr described in previous studies happens to be the time when most mail carriers travel door to door to deliver mail and packages in Taiwan. Daytime ambient O3 concentrations these mail carriers experience, therefore, are expected to be very close to their occupational exposures. Because potential health effects due to this particular exposure scenario have not been reported before, we conducted this study to assess whether exposure to O3 at concentrations below current permissible levels will reduce mail carriers’ lung function.
Materials and Methods
Study population.
The study group consisted of 43 mail carriers who were randomly selected from 215 full-time mail carriers working in a main post office of Taichung City, Taiwan. To cover a service area of approximately 10 km2 and a half million residents, these mail carriers use either motorcycles or bicycles to deliver mail from 0900 to 1700 hr daily on preassigned delivery routes. A face-to-face questionnaire survey was performed in advance in September 2001 to obtain data from each mail carrier, including age; height; weight; smoking status; disease history of doctor-diagnosed asthma, bronchitis, and pneumonia; and incense burning and environmental tobacco smoke (ETS) exposures at home. Our field study took place from 14 November to 31 December 2001. The Institutional Review Board of National Taiwan University College of Public Health approved the research protocol, and written informed consent was obtained from each participant.
Lung function measurement.
We chose PEFR as the outcome variable for lung function because it is highly correlated with FEV1 in clinical diagnosis (Nowak et al. 1982) and widely used in epidemiology studies (Jalaludin et al. 2000; Krzyzanowski et al. 1992; Naeher et al. 1999; Peters et al. 1999). Each mail carrier was provided with a Midget peak expiratory flow meter (Medget Quan-ding Inc., Taipei City, Taiwan) to measure morning PEFR after awakening and night PEFR between 1000 and 1200 hr daily. Each mail carrier was trained to take three consecutive PEFR readings in the standing position in each measurement. The PEFR measurement was considered valid when the variation of three consecutive readings was < 10%. The best value of three readings was selected for use in further analysis. Our PEFR measurements were conducted between 14 November and 31 December 2001. The PEFR data of the first 3 days were used solely to validate our study subjects’ PEFR measuring technique and were not used in further data analyses. A daily maximum PEFR and daily deviation of PEFR for both morning and night PEFR data were used as outcome variables in our statistical models. Daily deviation of PEFR was defined as the difference between the daily highest PEFR reading and the 6-week average PEFR calculated according to the methods of Pope and Dockery (1992). We present here only the findings of night PEFR to keep our results as concise and informative as possible.
Monitoring of ambient air pollutants.
To estimate the daily exposure of each mail carrier to air pollutants, we abstracted hourly air pollution levels of O3, particulate matter < 10 μm in aerodynamic diameter (PM10), and nitrogen dioxide from one air monitoring station in the center of each mail carrier’s delivery area according to their daily working hours. The air monitoring station operated in Taichung City, Taiwan, by the Taiwan Environmental Protection Administration (2005) also provided hourly meteorologic data on wind direction, wind speed, temperature, dew point, and precipitation. The locations of the air monitoring station and post office in this study are shown in Figure 1. The environmental data were not used in further data analyses if there were > 20% of hourly values missing in a single day. The 8-hr average and maximum values for O3, NO2, and PM10 between 0900 and 1700 hr were calculated from the data obtained from this monitoring station to represent each subject’s daily exposures to air pollutants. We also summarized meteorologic variables of temperature and relative humidity for the same time segments.
Figure 1. Map of Taichung City.

Statistical methods.
We used a two-step statistical model to estimate the association between PEFR and O3 exposures. Multiple linear regressions (MLR) without air pollutants were first used to screen key PEFR-related personal covariates with a p-value < 0.25 for further analyses according to the methods of Peters et al. (1999) and Krzyzanowski et al. (1992). In the second step, linear mixed-effects models were used to estimate the pollution effects on PEFR adjusting for personal and meteorologic variables. Such mixed-effects models have the advantage of adjusting for invariant variables by fixed-effects models and accounting for individual differences by random-effects models. We treated subject’s sex; age; body mass index; history of diagnosed respiratory disease; smoking status; air pollutants O3, PM10, and NO2; ambient temperature; and relative humidity as fixed effects and each subject as a random effect in the mixed-effects models. Each of the three air pollutants considered was first put into the linear mixed-effects models separately as single-pollutant models. All of the three pollutants were then jointly put into the linear mixed-effects models as multipollutant models. Air pollution levels with 0- to 3-day lags were used to estimate the time course of pollution effects. Statistical analyses were performed using general additive procedures in the S-PLUS 2000 program (MathSoft Inc., Cambridge, MA, USA). Model selection was based on minimizing Akaike’s information criterion (Akaike 1974).
Results
Study population.
As shown in Table 1, there were 39 (91%) males and 4 females (9%) among the 43 mail carriers who participated in the study. The average age was 39 years, and employment duration averaged 13 years. Fifteen (35%) male mail carriers were current smokers. Only a few subjects had a history of doctor-diagnosed respiratory diseases, such as asthma (n = 0), bronchitis (n = 2), and pneumonia (n = 1). Among 43 mail carriers, 15 (35%) were exposed to incense-burning smoke and 9 (21%) were exposed to ETS in their homes.
Table 1.
Basic characteristics of 43 mail carriers participating in the study (PEFR measurement period from 17 November through 31 December 2001).
| Characteristic | Male | Female | Total |
|---|---|---|---|
| No. of subjects (%) | 39 (91) | 4 (9) | 43 |
| Age [years (mean ± SD)] | 38.1 ± 9.6 | 39.7 ± 4.4 | 39 ± 8 |
| Work [years (mean ± SD)] | 12.2 ± 6.7 | 11.3 ± 0.5 | 13 ± 6 |
| Height [cm (mean ± SD)] | 169.0 ± 4.9 | 160.4 ± 8.4 | 167.9 ± 5.5 |
| Weight [kg (mean ± SD)] | 66.8 ± 9.6 | 62.8 ± 5.3 | 65.8 ± 7.1 |
| Disease history | |||
| Asthma [n (%)] | 0 (0) | 0 (0) | 0 (0) |
| Bronchitis [n (%)] | 2 (5) | 0 (0) | 2 (5) |
| Pneumonia [n (%)] | 1 (3) | 0 (0) | 1 (2) |
| Smoking status | |||
| Current smoker [n (%)] | 15 (38) | 0 (0) | 15 (35) |
| Nonsmoker [n (%)] | 24 (57) | 4 (100) | 28 (60) |
| ETS at home [n (%)] | 9 (23) | 0 (0) | 9 (21) |
| Incense burning at home [n (%)] | 13 (33) | 2 (50) | 15 (35) |
| No. of PEFR measurements | 986 | 87 | 1,073 |
Levels of ambient air pollutants and meteorologic parameters.
Table 2 summarizes the O3, PM10, and NO2 concentrations, temperature, and relative humidity. The 8-hr average concentrations (mean ± SD) of air pollutants during the study period were 36 ± 12 ppb for O3, 75 ± 38 μg/m3 for PM10, and 30 ± 10 ppb for NO2. The meteorologic conditions were generally mild during the study period with an 8-hr daytime temperature of 19 ± 3°C and a relative humidity of 72 ± 7%. Hourly concentrations of air pollutants in the exposure period were 6–96 ppb for O3, 11–249 μg/m3 for PM10, and 14–92 ppb for NO2 during mail carriers’ exposure periods. Pearson correlation coefficients among air pollutants and meteorologic parameters are shown in Table 3. The O3 level was not significantly correlated with the other two pollutants, but PM10 was highly correlated with NO2 (r = 0.85). Temperature was also moderately correlated with relative humidity (r = 0.46).
Table 2.
Summarized statistics for air pollutants and meteorologic data during the study period (14 November through 31 December 2001).
| Variable | No. | Mean ± SD | Minimum | Maximum |
|---|---|---|---|---|
| 8-hr average during exposure periodsa | ||||
| O3 (ppb) | 44 | 35.6 ± 12.1 | 7.6 | 65.1 |
| PM10 (μg/m3) | 43 | 74.7 ± 37.9 | 19.1 | 213.8 |
| NO2 (ppb) | 43 | 30.0 ± 10.1 | 17.3 | 65.9 |
| Temperature (°C) | 45 | 19.1 ± 3.4 | 12.2 | 24.2 |
| Relative humidity (%) | 45 | 71.5 ± 6.6 | 59.0 | 88.0 |
| Maximum during exposure periods | ||||
| O3 (ppb) | 44 | 52.6 ± 18.8 | 5.6 | 95.5 |
| PM10 (μg/m3) | 43 | 106.8 ± 44.8 | 11.4 | 249.0 |
| NO2 (ppb) | 43 | 52.9 ± 21.8 | 14.0 | 91.6 |
Mail carriers’ exposure periods are about 8 hr between 0900 and 1700 hr every working day.
Table 3.
Pearson correlation coefficients for air pollutants and meteorologic data during the study period (14 November through 31 December 2001).
| Pearson correlation coefficients | O3 | PM10 | NO2 | Temperature | Relative humidity |
|---|---|---|---|---|---|
| O3 | 1.000 | ||||
| PM10 | 0.211 | 1.000 | |||
| NO2 | 0.093 | 0.854** | 1.000 | ||
| Temperature | 0.010 | 0.402** | 0.353* | 1.000 | |
| Relative humidity | −0.413** | 0.088 | −0.063 | 0.460** | 1.000 |
p < 0.05;
p < 0.01.
PEFR parameters, and O3.
We included sex, age, disease history, temperature, relative humidity and smoking status in the mixed-effects models because our MLR models without air pollutants found that these covariates were associated with PEFR. By contrast, covariates of incense burning and ETS were not included in our second-step models because they were not significantly associated with PEFR. Table 4 lists the results of single-pollutant mixed-effects models separately for O3, PM10, and NO2. Only O3 was consistently associated with decreases in night PEFR and the deviation in night PEFR among these three air pollutants. The night PEFR of the mail carriers was significantly reduced in association with 8-hr average O3 concentrations with 0- to 2-day lags and maximum O3 concentrations during exposure periods with 0- to 1-day lags. The deviation in night PEFR was reduced in association with both 8-hr and maximum O3 concentrations with 0- to 2-day lags. Instead of consistent correlation between O3 and PEFR, we found NO2 effects on both night PEFR and night PEFR deviation at the 2-day lag only, and no PM10 effects on either night PEFR or night PEFR deviation.
Table 4.
Regression coefficients (95% CIs) of individual pollutants on PEFR estimated by single-pollutant linear mixed-effects models.
| 8-hr average for exposure period
|
Hourly maximum for 8-hr exposure period
|
|||||
|---|---|---|---|---|---|---|
| O3 | PM10 | NO2 | O3 | PM10 | NO2 | |
| Night PEFR | ||||||
| Lag 0 | −0.33* (−0.44 to −0.18) | 0.02 (−0.03 to 0.07) | 0.09 (−0.06 to 0.23) | −0.20* (−0.26 to −0.08) | −0.01 (−0.03 to 0.06) | −0.01 (−0.09 to 0.05) |
| Lag 1 | −0.38** (−0.50 to −0.22) | 0.04 (−0.03 to 0.06) | 0.19 (0.04 to 0.34) | −0.22* (−0.26 to −0.08) | 0.01 (−0.04 to 0.04) | 0.08 (−0.02 to 0.15) |
| Lag 2 | −0.32* (−0.42 to −0.15) | −0.04 (−0.10 to −0.01) | −0.26 (−0.46 to −0.10) | −0.17 (−0.23 to −0.04) | −0.05 (−0.05 to 0.01) | −0.18* (−0.27 to −0.10) |
| Lag 3 | −0.22 (−0.34 to −0.05) | 0.02 (−0.01 to 0.07) | 0.08 (−0.11 to 0.25) | −0.09 (−0.17 to 0.00) | −0.02 (−0.06 to 0.01) | 0.08 (−0.02 to 0.17) |
| Night PEFR deviation | ||||||
| Lag 0 | −0.32* (−0.43 to −0.18) | −0.00 (−0.04 to 0.04) | 0.11 (−0.03 to 0.25) | −0.19* (−0.27 to −0.11) | −0.02 (−0.05 to 0.02) | −0.01 (−0.08 to 0.06) |
| Lag 1 | −0.38** (−0.51 to −0.26) | 0.02 (−0.03 to 0.06) | 0.17 (0.02 to 0.32) | −0.20* (−0.29 to −0.12) | −0.02 (−0.05 to 0.02) | 0.06 (−0.01 to 0.13) |
| Lag 2 | −0.32* (−0.44 to −0.19) | −0.07 (−0.12 to −0.03) | −0.26 (−0.41 to −0.11) | −0.16* (−0.25 to −0.08) | −0.04 (−0.07 to 0.00) | −0.18* (−0.25 to −0.11) |
| Lag 3 | −0.22 (−0.35 to −0.09) | 0.01 (−0.04 to 0.05) | 0.06 (−0.10 to 0.22) | −0.11 (−0.20 to −0.03) | −0.01 (−0.04 to 0.02) | 0.07 (0.00 to 0.15) |
p < 0.05;
p < 0.01.
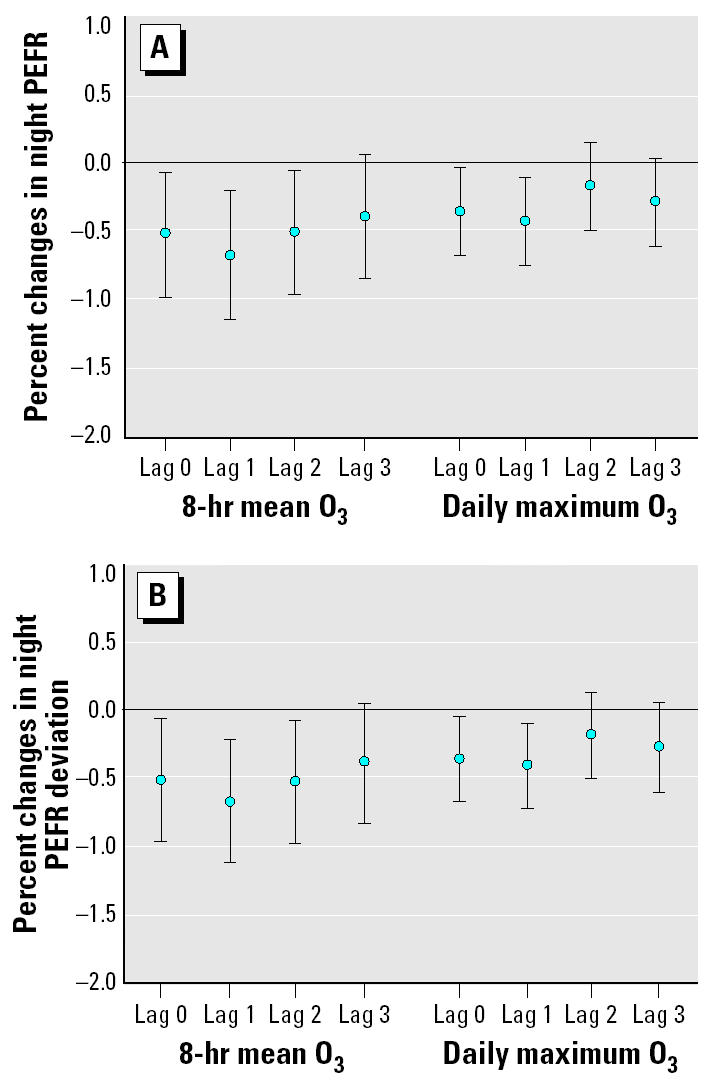
We then put O3, PM10, and NO2 with 0- to 3-day lags in the multipollutant mixed-effects models to estimate the pollution effects on decrease in PEFR by adjusting co-pollutants and key meteorologic factors. We found that O3 was associated with PEFR after adjusting for PM10, NO2, and other covariates. By contrast, PEFR reduction was not associated with either PM10 or NO2 in the multipollutant models. As shown in Figure 2A, night PEFR and deviation in night PEFR were significantly decreased by O3 exposures up to a 2-day lag after adjusting for co-pollutants and key personal covariates. Night PEFR was decreased by 0.54% for 0-day lag, 0.69% for 1-day lag, and 0.52% for 2-day lag. Compared with 8-hr O3, 1-hr O3 had comparatively less effect on decreasing night PEFR, which was 0.36% for 0-day lag and 0.44% for 1-day lag. As shown in Figure 2B, the effect of O3 exposure on the deviation in night PEFR had the same time course as its effects on night PEFR. However, the effects of O3 exposure on the deviation in night PEFR were smaller compared with its effects on night PEFR for the same time lag. Our multipollutant mixed-effects models thus showed that ambient 8-hr O3 concentrations had greater and longer effects on decreasing PEFR than did maximum O3 concentrations during exposure periods. No other covariate except ambient temperature was significantly related to night PEFR and the deviation in night PEFR in our multipollutant mixed-effects models. In addition, subjects’ disease history, including asthma, bronchitis, and pneumonia, had a negative but statistically insignificant influence on PEFR in our multipollutant mixed-effects models. We also found similar O3 effects on morning PEFR deviation but not morning PEFR in our multipollutant mixed-effects models (data not shown).
Figure 2. Percent changes in night PEFR (A) and night PEFR deviation (B) per 10 ppb for 8-hr O3 and maximum O3. Error bars indicate mean ± SD.
Discussion
This is the first study to demonstrate that there are effects of occupational O3 exposures lagged 0–2 days on reducing mail carriers’ lung function. Such effects can be detected by using either PEFR or PEFR deviation as an indicator of lung function. After occupational exposures during daytime work, night PEFR measurements seem to be more sensitive to O3 exposures than are morning PEFR measurements. Because none of our study subject’s daily O3 exposure exceeded the hourly standard of 120 ppb, our study supports previous findings from studies in the United States and Canada of a dose–response relationship between lung function change and O3 exposure at relatively low daytime ambient concentrations for healthy adults. Exercising healthy adults in New York City (USA) who were exposed to < 80 ppb O3 were reported to have a 0.55-L/min decrease in their PEFR per 1 ppb O3 (Spektor et al. 1988); healthy women exposed to 8-hr O3 at 54 ppb in Connecticut and Virginia (USA) were reported to have a 0.083-L/min/ppb decrease in their PEFR per 1 ppb O3 (Naeher et al. 1999); farm workers in Fraser Valley (Canada) who were exposed to a 1-hr daily maximum O3 of 40 ppb were reported to have 3.3-mL and 4.7-mL decreases in their FEV1.0 and FVC, respectively, per 1 ppb O3 (Brauer et al. 1996). A similar dose–response relationship between O3 and PEFR reduction was also reported in some European studies. Male cyclists in the Netherlands who were exposed to < 60 ppb O3 were reported to have 0.57-L/min decreases in PEFR per 1 ppb O3 (Brunekreef et al. 1994); healthy workers and athletes in Germany who were exposed to < 80 ppb O3 were also reported to have decrements in their FEV1 (Hoppe et al. 1995). Our study also further confirmed that time-weighted O3 exposures had greater effects on decreasing lung function than did daily peak concentrations as reported in previous studies (Castillejos et al. 1992; Jalaludin et al. 2000).
Several limitations in our study should be noted. First, the personal O3 exposures of mail carriers were not directly measured in this study but were represented by ambient monitoring data. However, the use of fixed-site monitoring data to represent personal O3 exposures was not expected to bias our results because the delivery areas of each mail carrier were located within 5 km of the fixed-site monitoring station in this study, and previous studies have shown relatively high spatial representativeness of ambient O3 measurements in similar urban environments (Chan and Hwang 1996; Romieu et al. 1998). The lack of personal exposure data could misclassify mail carriers’ actual O3 exposures. It has been reported that exposures misclassification can produce biases in both directions for outcomes with multiple risk factors and where exposures are correlated (Zeger et al. 2000; Zeka and Schwartz 2004). Therefore, we cannot entirely rule out the effects of PM10 and NO2 on reducing mail carriers’ PEFR in this study. PM10 does not distribute throughout an air shed as thoroughly as O3, and its use may have introduced more exposure misclassification for that pollutant. This may partially explain the lack of an observed effect on PEFR by relatively high acute PM10 exposures in this study. Another potential confounding factor of our findings was that some unmeasured air pollutants, such PM2.5 and volatile organic compounds from tailpipe emissions, could also have been responsible for lowering lung function rather than O3 alone in our study.
Despite these limitations, our data generally support the finding that a lung function reduction occurred among mail carriers exposed to daily O3 concentrations below current ambient air quality standards and occupational exposure limits. O3 is a strong oxidant that can induce pulmonary function impairment at low levels via several toxicologic mechanisms. For example, O3 can trigger the neutral receptors of the airway by inducing lipid peroxidation and the production of cycloxygenase (Hazucha et al. 1996) or increase respiratory allergy or reduce resistance to respiratory tract infections by suppressing TH1 cells in the immune system (Van Loveren et al. 1996). More recently, O3 exposure was found to induce mild and moderate respiratory response among children in Taipei by causing DNA breaks and impairing pulmonary cells (Cheng et al. 2003). Because O3 pollution is still widespread in major metropolitan areas worldwide, more studies are needed to elucidate clinical significance of O3 effects on lung function at low exposure levels, especially for susceptible populations.
References
- Akaike H. A new look at the statistical model identification. IEEE Trans Auto Control. 1974;19:716–723. [Google Scholar]
- Brauer M, Blair J, Vedal S. Effect of ambient ozone exposure on lung function in farm workers. Am J Respir Crit Care Med. 1996;154:981–987. doi: 10.1164/ajrccm.154.4.8887595. [DOI] [PubMed] [Google Scholar]
- Brunekreef B, Hoek G, Breugelmans O, Leentvaar M. Respiratory effects of low-level photochemical air pollution in amateur cyclists. Am J Respir Crit Care Med. 1994;150:962–966. doi: 10.1164/ajrccm.150.4.7921470. [DOI] [PubMed] [Google Scholar]
- Burnett RT, Smith-Doiron M, Stieb D, Raizenne ME, Brook JR, Dales RE, et al. Association between ozone and hospitalization for acute respiratory diseases in children less than 2 years of age. Am J Epidemiol. 2001;153:444–452. doi: 10.1093/aje/153.5.444. [DOI] [PubMed] [Google Scholar]
- Castillejos M, Gold DR, Dockery D, Tosteson T, Baum T, Speizer FE. Effects of ambient ozone on respiratory function and symptoms in Mexico City schoolchildren. Am Rev Respir Dis. 1992;145:276–282. doi: 10.1164/ajrccm/145.2_Pt_1.276. [DOI] [PubMed] [Google Scholar]
- Chan CC, Hwang JS. Site representativeness of urban air monitoring stations. J Air Waste Manage Assoc. 1996;46:755–760. doi: 10.1080/10473289.1996.10467510. [DOI] [PubMed] [Google Scholar]
- Chen PC, Lai YM, Chan CC, Hwang JS, Yang CY, Wang JD. Short-term effect of ozone on the pulmonary function of children in primary school. Environ Health Perspect. 1999;107:921–925. doi: 10.1289/ehp.99107921. [DOI] [PMC free article] [PubMed] [Google Scholar]
- Cheng TJ, Kao HP, Chan CC, Chang WP. Effects of ozone on DNA single-strand breaks and 8-oxoguanine formation in A549 cells. Environ Res. 2003;93:279–284. doi: 10.1016/s0013-9351(03)00041-0. [DOI] [PubMed] [Google Scholar]
- Hazucha MJ, Madden M, Pape G, Becker S, Devlin R, Koren HS, et al. Effects of cyclo-oxygenase inhibition on ozone-induced respiratory inflammation and lung function changes. Eur J Appl Physiol Occup Physiol. 1996;73:17–27. doi: 10.1007/BF00262805. [DOI] [PubMed] [Google Scholar]
- Hoppe P, Peters A, Rabe G, Praml G, Lindner J, Jakobi G, et al. Environmental ozone effects in different population subgroups. Int J Hyg Environ Health. 2003;206:505–516. doi: 10.1078/1438-4639-00250. [DOI] [PubMed] [Google Scholar]
- Hoppe P, Praml G, Rabe G, Lindner J, Fruhmann G, Kessel R. Environmental ozone field study on pulmonary and subjective responses of assumed risk groups. Environ Res. 1995;71:109–121. doi: 10.1006/enrs.1995.1072. [DOI] [PubMed] [Google Scholar]
- Kehrl HR, Peden DB, Ball B, Folinsbee LJ, Horstman D. Increased specific airway reactivity of persons with mild allergic asthma after 7.6 hours of exposure to 0.16 ppm ozone. J Allergy Clin Immunol. 1999;104:1198–1204. doi: 10.1016/s0091-6749(99)70013-8. [DOI] [PubMed] [Google Scholar]
- Kinney PL, Lippmann M. Respiratory effects of seasonal exposure to ozone and particulate. Arch Environ Health. 2000;55:210–216. doi: 10.1080/00039890009603408. [DOI] [PubMed] [Google Scholar]
- Korrick SA, Neas LM, Dockery DW, Gold DR, Allen GA, Hill LB, et al. Effects of ozone and other pollutants on the pulmonary function of adult hikers. Environ Health Perspect. 1998;106:93–99. doi: 10.1289/ehp.9810693. [DOI] [PMC free article] [PubMed] [Google Scholar]
- Krzyzanowski M, Quackenboss JJ, Lebowitz MD. Relation of peak expiratory flow rates and symptoms to ambient ozone. Arch Environ Health. 1992;47:107–115. doi: 10.1080/00039896.1992.10118763. [DOI] [PubMed] [Google Scholar]
- Jalaludin BB, Chey T, O’Toole BI, Smith WT, Capon AG, Leeder SR. Acute effects of low levels of ambient ozone on peak expiratory flow rate in a cohort of Australian children. Int J Epidemiol. 2000;29:549–557. [PubMed] [Google Scholar]
- Jorres R, Nowak D, Magnussen H. The effect of ozone exposure on allergen responsiveness in subjects with asthma or rhinitis. Am J Respir Crit Care Med. 1996;153:56–64. doi: 10.1164/ajrccm.153.1.8542163. [DOI] [PubMed] [Google Scholar]
- Naeher LP, Holford TR, Beckett WS, Belanger K, Triche EW, Bracken MB, et al. Healthy women’s PEF variations with ambient summer concentrations of PM10, PM2.5, SO42−, H+, and O3. Am J Respir Crit Care Med. 1999;160:117–125. doi: 10.1164/ajrccm.160.1.9808153. [DOI] [PubMed] [Google Scholar]
- Nowak RM, Pensler MI, Sarkar DD, Anderson JA, Kvale PA, Ortiz AE, et al. Comparison of peak expiratory flow and FEV1 admission criteria for acute bronchial asthma. Ann Emerg Med. 1982;11:64–69. doi: 10.1016/s0196-0644(82)80298-9. [DOI] [PubMed] [Google Scholar]
- Occupational Safety and Health Administration 2004. OSHA Permissible Exposure Limit (PEL) for General Industry. Limits for Air Contaminants. 29 CFR 1910.1000 Z-1 Table. Washington, DC:U.S. Department of Labor.
- Peters JM, Avol E, Gauderman WJ, Linn WS, Navidi W, London SJ, et al. A study of twelve southern California communities with differing levels and types of air pollution. II. Effects on pulmonary function. Am J Respir Crit Care Med. 1999;159:768–775. doi: 10.1164/ajrccm.159.3.9804144. [DOI] [PubMed] [Google Scholar]
- Pope CA, III, Dockery DW. Acute health effects of PM10 pollution on symptomatic and asymptomatic children. Am Rev Respir Dis. 1992;145:1123–1128. doi: 10.1164/ajrccm/145.5.1123. [DOI] [PubMed] [Google Scholar]
- Romieu I, Lugo MC, Colome S, Garica AM, Avila MH, Geyh A, et al. Evaluation of indoor ozone concentration and predictors of indoor-outdoor ratio in Mexico City. J Air Waste Manage Assoc. 1998;48:327–335. [Google Scholar]
- Spektor DM, Lippmann M, Thurston GD, Lioy PJ, Stecko J, O’Connor G, et al. Effects of ambient ozone on respiratory function in healthy adults exercising outdoors. Am Rev Respir Dis. 1988;138:821–828. doi: 10.1164/ajrccm/138.4.821. [DOI] [PubMed] [Google Scholar]
- Taiwan Environmental Protection Administration 2005. EPA Air Monitoring Sites [in Chinese]. Taichung City, Taiwan:Taiwan Environmental Protection Administration. Available: http://taqm.epa.gov.tw/emc/default.aspx?pid=b0101&cid=b0102 [accessed 15 April 2005].
- Van Loveren H, Steerenberg PA, Garssen J, Van Bree L. Interaction of environmental chemicals with respiratory sensitization. Toxicol Lett. 1996;86:163–167. doi: 10.1016/0378-4274(96)03686-7. [DOI] [PubMed] [Google Scholar]
- Zeger SL, Thomas D, Dominici F, Samet JM, Schwartz J, Dockery D, et al. Exposure measurement error in time-series studies of air pollution: concepts and consequences. Environ Health Perspect. 2000;108:419–426. doi: 10.1289/ehp.00108419. [DOI] [PMC free article] [PubMed] [Google Scholar]
- Zeka A, Schwartz J. Estimating the independent effects of multiple pollutants in the presence of measurement error: an application of a measurement-error-resistant technique. Environ Health Perspect. 2004;112:1686–1690. doi: 10.1289/ehp.7286. [DOI] [PMC free article] [PubMed] [Google Scholar]