

Abstract
The effects of age, subcortical vascular disease, apolipoprotein E (APOE) ɛ4 allele and hypertension on entorhinal cortex (ERC) and hippocampal atrophy rates were explored in a longitudinal MRI study with 42 cognitively normal (CN) elderly subjects from 58 to 87 years old. The volumes of the ERC, hippocampus, and white matter hyperintensities (WMH) and the presence of lacunes were assessed on MR images. Age was significantly associated with increased atrophy rates of 0.04 ± 0.02% per year for ERC and 0.05 ± 0.02% per year for hippocampus. Atrophy rates of hippocampus, but not that of ERC increased with presence of lacunes, in addition to age. WMH, APOE ɛ4 and hypertension had no significant effect on atrophy rates. In conclusion, age and presence of lacunes should be taken into consideration in imaging studies of CN subjects and AD patients to predict AD progression and assess the response to treatment trials.
Keywords: Atrophy rate, Normal aging, Subcortical vascular disease, Hypertension, APOE ɛ4, The entorhinal cortex, The hippocampus
1. Introduction
The entorhinal cortex (ERC) and hippocampus are thought to be important structures in differentiating Alzheimer’s disease (AD) from normal aging. Cross-sectional MRI studies have shown that AD patients have significantly greater ERC and hippocampal atrophy than cognitively normal (CN) subjects [9,21,26,48,57]. Longitudinal MRI studies have suggested that the rates of ERC and hippocampal atrophy may be useful in predicting AD before the onset of clinical symptoms and in assessing the potential usefulness of pharmacological interventions in treatment trials [10,22,24,27,43]. However, CN subjects often display ERC and hippocampal atrophy rates that are significantly greater than zero, although substantially less than that seen in AD patients [10,22]. Moreover, hippocampal atrophy rates tend to increase with age in CN subjects [41,42,44]. Raz and co-workers reported that normal aging has a greater effect on hippocampal than ERC atrophy rates and that ERC atrophy rate is not related to age [41,42]. Together these results suggest that hippocampal atrophy may be more closely associated with normal aging while ERC atrophy may be more closely associated with incipient AD pathologic processes. On the other hand, ERC and hippocampus are both strongly associated with memory function [51]. Since memory impairment typically increases with age [2,31], it is unclear why normal aging would differentially affect atrophy rates of ERC and hippocampus. Therefore, the first goal of this study was to examine the relationship between age and atrophy rates of the ERC and hippocampus. In an attempt to replicate the results of Raz and co-workers [41,42], we also examined whether the relationship between age and atrophy rates is different for ERC and hippocampus.
Another risk factor for cognitive impairment, in addition to advanced age, is subcortical cerebral vascular disease, manifested as subcortical infarcts/lacunes and white matter hyperintensities (WMH) on MRI images [8,13,37,46,50,58]. A recent clinical study demonstrated that elderly individuals with silent brain infarcts were at greater risk for dementia and cognitive decline than elderly individuals without such lesions [53]. In addition to the subcortical cerebral vascular lesions visible on MRI, microinfarctions, which are usually not visible on MRI, may also be present, especially in subjects with hypertension [28]. Hypertension has been shown as a risk factor for late-life cognitive impairment [12,32]. Because cognitive decline is related to cerebral atrophy [15,36], cerebral vascular disease and hypertension may accelerate cerebral atrophy in CN subjects. Therefore, the second goal of this study was to determine if subcortical vascular disease and hypertension, independent of age, contribute to greater ERC and hippocampal atrophy rates.
The apolipoprotein E (APOE) ɛ4 allele is a genetic risk factor for AD and vascular dementia [7,18]. APOE ɛ4 lowers the age of AD onset [1], and healthy older women with APOE ɛ4 have greater hippocampal atrophy rates than those without APOE ɛ4 [6]. However, it is not known if APOE ɛ4 is also associated with greater ERC atrophy rate in normal aging. Therefore, the third goal of this study was to examine if APOE ɛ4 contributes to greater ERC and hippocampal atrophy rates in CN subjects.
2. Subjects and methods
2.1. Subjects
All subjects were recruited from the community by flyers and advertisements in local newspapers as control subjects for a dementia study and had undergone two MRI and two neuropsychological evaluations approximately 3.5 ± 0.8 years apart. The subjects received standard neurological examinations [35] at the Memory and Aging Clinic at the University of California at San Francisco and the Alzheimer Center at the University of California at Davis. Global cognitive function assessed with the mini-mental state examination (MMSE) [17] and hippocampal-dependent memory function assessed with the delayed list recall (DLR) score from the memory assessment scales (MAS) word list learning test [56] were included in this study. Total 54 subjects with MMSE ≥ 26 and clinical dementia rating (CDR) score of 0 were initially included. Two subjects had diabetes mellitus and eight subjects had hypertension (blood pressure ≥ 140/90 mmHg) at baseline. All subjects had no other major neuropathological findings except lacunes and WMH based on the evaluation of MRI images. Thirty-six subjects had no lacunes and 18 subjects had lacunes at baseline. After follow-up, five subjects without lacunes and five subjects with lacunes converted CDR score to 0.5; therefore, they were excluded in the final analysis. In addition, two subjects with diabetes mellitus were also excluded in the final analysis. Thus, the final analysis included 30 subjects without lacunes and 12 subjects with lacunes with age from 58 to 87 years old. The lacunes were located in the caudate nucleus (two subjects), putamen (three subjects), thalamus (four subjects), globus pallidus (three subjects), and white matter (three subjects). Three of 30 subjects without lacunes and four of 12 subjects with lacunes had hypertension. Except for hypertension, no other apparent cardiovascular condition existed in subjects without lacunes. In addition, six subjects without lacunes and six subjects with lacunes had at least an APOE ɛ4 allele. Age and gender were matched between subjects with APOE ɛ4 allele (six men and six women, age 73.4 ± 6.4 years) and subjects without APOE ɛ4 allele (13 men and 17 women, age 73.6 ± 7.6 years). The demographics of all subjects are depicted on Table 1. Atrophy rates of ERC and hippocampus of 11 out of the 42 subjects had been reported earlier [10]. All subjects provided written informed consent, approved by the Committees of Human Research at the University of California, San Francisco and Davis, prior to participating in the study.
Table 1.
Demographics
| CN without lacunes |
CN with lacunes |
|||
|---|---|---|---|---|
| Non-HTN | HTN | Non-HTN | HTN | |
| N (F/M) | 27 (17/0) | 3 (1/2) | 8 (4/4) | 4 (1/3) |
| Age (years)* | 71.9 ± 7.6 | 74.3 ± 6.5 | 76.7 ± 4.8 | 78.2 ± 6.2 |
| Interval (years) | 3.6 ± 0.9 | 2.7 ± 1.0 | 3.5 ± 1.2 | 3.0 ± 0.6 |
| APOE ɛ4 | 6 | 0 | 5 | 1 |
| MMSE | 29.4 ± 0.8 | 30.0 ± 0.0 | 29.0 ± 0.9 | 28.5 ± 1.7 |
| ΔMMSE (per year) | 0.02 ± 0.22 | 0.14 ± 0.25 | 0.02 ± 1.0 | −0.4 ± 0.5 |
| DLR | 10.6 ± 1.4 | 10.5 ± 2.2 | 10.0 ± 1.7 | 9.7 ± 1.5 |
| ΔDLR (per year) | −0.08 ± 0.79 | −0.21 ± 0.31 | 0.11 ± 0.90 | −0.52 ± 1.18 |
| WMH (cm3)* | 7.4 ± 10.5 | 2.5 ± 1.9 | 5.9 ± 2.6 | 17.7 ± 8.8 |
HTN: hypertension, MMSE: mini-mental state examination, DLR: delayed list recall. Twelve words need to be remembered in the DLR test, ΔMMSE: (first MMSE score – second MMSE score)/scan interval, ΔDLR: (first DLR score – second DLR score)/scan interval.
p < 0.05, t-test, between subjects with and without lacunes.
2.2. MRI
MRI data were obtained on a 1.5 T Siemens VisionTM System (Siemens Inc., Iselin, NJ). The protocol for structural MRI included axially oblique double spin echo (DSE) images with repetition time (TR)/echo time (TE)1/TE2 = 2500/20/80 ms, 1.0 × 1.4 mm2 inplane resolution, and 3-mm thick sections with no section gap. In addition, volumetric magnetization-prepared rapid gradient echo (MPRAGE) images were acquired with TR/TE/inversion time (TI) = 10/7/300 ms, 15° flip angle, 1.0 × 1.0 mm2 inplane resolution, and 1.4-mm thick coronal partitions, oriented orthogonally to the long axis of the hippocampus. One rater (A.-T.D.) performed all ERC and hippocampal measurements blinded to demographical information and chronological order of scans. ERC volumes were manually measured on T1-weighted images. The MR images of each subject obtained at timepoints 1 and 2 were co-registered and simultaneously displayed so that the ERC boundaries could be measured in a pair-wise fashion, as described earlier [11]. In contrast, hippocampal volumes were measured separately for each timepoint using a semi-automated high dimensional brain-warping algorithm (Medtronic Surgical Navigation Technologies, Louisville, CO) [20], which only measures gray matter of hippocampus. While measurements of ERC volumes were conducted in pairs with the rater blinded to chronological order to reduce scoring errors, semi-automated measurements of hippocampal volumes were conducted individually, because susceptibility to rater errors was substantially reduced with automation and whether performed individually or in pairs did not matter. Finally, results of the warping were visually inspected and hippocampal masks including non-hippocampal tissue in four subjects were manually corrected. Intraclass correlation coefficients of ERC and hippocampal measurements were 0.99 for ERC and 0.94 for hippocampus, as reported in detail earlier [10]. The ERC and hippocampal measurements over time are depicted on Fig. 1. WMH volumes were assessed based on semi-automatic segmentation using T1-, proton density- and T2-weighted images together [3]. WMH was defined as regions that are hyperintense on proton density-and T2-weighted images and are anatomically located in white matter (WM) region. WMH are usually not apparent or appear isointense to gray matter (GM) on T1-weighted image. The lacunes were defined based on MRI images. The definition of lacunes was based on original work of Fisher [16], combined with current clinical concepts [34]. Lacunes occur generally in the basal ganglia, capsular and thalamic regions and appear as hyperintense foci on T2-weighted images, ranging from 3 to 15 mm in diameter. Lacunes are usually hypointense on T1-weighted image and can be either hyperintense or isointense to CSF on proton density-weighted images, depending on whether they are cavitated. Lacunes can also be located in WM, although this is rare. When appearing in WM, lacunes were differentiated from WMH by an isointense signal to CSF and lesion size ranging from 3 to 15 mm. Because perivascular spaces may be particularly large and prominent in the anterior commissure and the infraputaminal regions, all hyperintense lesions in these areas were arbitrarily categorized as perivascular spaces.
Fig. 1.
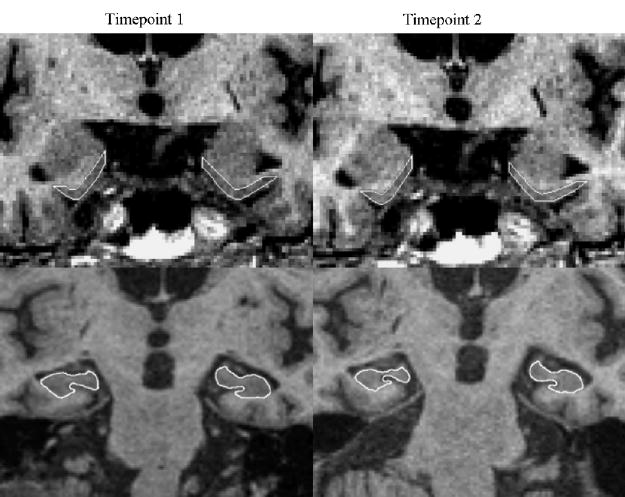
ERC and hippocampal measurements on a 73-year-old cognitively normal subject with a scan interval of 2.1 years.
2.3. Statistics
Atrophy rate is expressed as the annual percentage change from baseline volume [11]. Linear regression models were used to determine the effects of age on ERC and hippocampal atrophy rates. In order to reduce the confounding effects of subcortical vascular disease and hypertension on atrophy rates, we initially analyzed data from only CN subjects without lacunes and hypertension in the linear model. Subsequently, the presence or absence of subcortical lacunes, baseline WMH volume, APOE ɛ4 status, and presence or absence of hypertension were added to the linear model to evaluate the contribution of these additional factors to increased atrophy rates with aging. An analysis of variance (ANOVA) analysis was used to test the different effects of aging on ERC and hippocampal atrophy rates. The level of significance was set at p < 0.05.
3. Results
3.1. Effect of normal aging on atrophy rates of ERC and hippocampus
Fig. 2 shows ERC and hippocampal atrophy rates as a function of age in 27 CN subjects without lacunes and hypertension. ERC atrophy rate significantly increased with age by 0.04 ± 0.02% per year (r = 0.38, p < 0.05). After accounting for baseline WMH volume and APOE ɛ4 status, the relationship between atrophy rate of ERC and age reduced to a trend (p = 0.06); however, both baseline WMH volume and APOE ɛ4 status did not significantly contribute (F-tests, both p > 0.1) to increased atrophy rate of ERC. Therefore, the simpler model directly relating atrophy rate of ERC to age was chosen to estimate variations of atrophy rate of ERC with age. Similarly, hippocampal atrophy rate also increased significantly with age by 0.05 ± 0.02% per year (r = 0.47, p < 0.05). After accounting for baseline WMH volume and APOE ɛ4 status, the relationship between hippocampal atrophy rate and age remained significant (p < 0.05). Neither baseline WMH volume nor APOE ɛ4 status contributed significantly to increased atrophy rate of hippocampus (all p > 0.1). Atrophy rates of ERC and hippocampus were significantly correlated with each other (r = 0.54, p < 0.01) in the subjects without lacunes. There was no significant difference (paired t-test, p > 0.5) between atrophy rates of ERC and hippocampus; furthermore, there was no significant difference in the relationships between hippocampal and ERC atrophy rates and age (F1,50 = 0.2, p > 0.5). Based on the current sample size, however, there was virtually no power to detect significant differences of atrophy rates between ERC and hippocampus in relation to age. In addition, atrophy rates of both ERC and hippocampus were not related to baseline total brain tissue (both p > 0.2). In contrast to atrophy rates of the ERC and hippocampus, baseline volumes of the ERC and hippocampus were not significantly related (both p > 0.5) to age. Similar to volumes at baseline, there was no significant cross-sectional correlation between volumes of the ERC or hippocampus and age at follow-up (both p > 0.1).
Fig. 2.
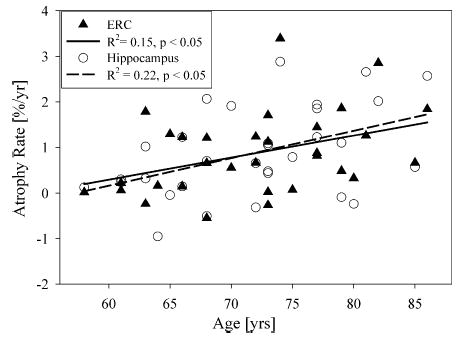
The relationship of atrophy rates of entorhinal cortex (ERC) and hippocampus and age in cognitively normal subjects without lacunes and hypertension.
3.2. Effect of other confounding factors on atrophy rates of ERC and hippocampus
In order to explore the extent to which atrophy rates of ERC and hippocampus in CN subjects were related to presence of lacunes, baseline WMH volume, APOE ɛ4 status and presence of hypertension in addition to age, all subjects were combined in a larger linear model analysis. Atrophy rate of hippocampus was positively related with presence of lacunes (p < 0.05) in addition to age, suggesting that atrophy rate of hippocampus increases with presence of lacunes. After corrected for the age effect, atrophy rates of hippocampus was 1.0 ± 0.9% per year in subjects without lacunes and 2.0 ± 0.9% per year in subjects with lacunes. In contrast to the hippocampus, atrophy rate of ERC did not increase with presence of lacunes (p > 0.3). Atrophy rate of ERC was 1.0 ± 0.8% per year in subjects without lacunes and only 1.1 ± 1.4% per year in the subjects with lacunes after corrected for the age effect. The minimum difference in ERC atrophy rate between subjects with and without lacunes that could be detected with this sample size at 80% statistical power was 8% per year (α = 0.05). Furthermore, atrophy rates of ERC were no longer related to age (p > 0.05) after accounting for lacunes. WMH volumes, APOE ɛ4 status and hypertension had no significant effect on atrophy rates of ERC and hippocampus (all p > 0.1) independent of age. Considering that the number of subjects who had each secondary condition (the presence of lacunes, APOE ɛ4 or hypertension) was small, the analyses were repeated by successively removing subjects with the various conditions. The results remained the same. Fig. 3 shows atrophy rates of ERC and hippocampus in CN subjects with and without lacunes, after accounting for age. In contrast to atrophy rates of ERC and hippocampus, baseline volumes of both ERC and hippocampus were not significantly related (both p > 0.4) to presence of lacunes. Furthermore, no significant relationship was found between volumes of the ERC and hippocampus and baseline WMH volumes, APOE ɛ4 status and hypertension (all p > 0.3). In order to explore whether atrophy rates of ERC and hippocampus were related with cognitive function, measured with MMSE and DLR scores, all subjects were combined. Atrophy rates of ERC or hippocampus were not related to baseline MMSE scores or annual decline of MMSE scores (both p > 0.3). In contrast, baseline DLR scores were negatively related to atrophy rates of ERC (p < 0.01) and marginally negatively related to atrophy rates of hippocampus (p = 0.08). When conditioned for presence/absence of lacunes, the relation between atrophy rate of ERC and DLR scores remained (p < 0.01) while the relation between atrophy rate of hippocampus and DLR score no longer existed (p > 0.2). In contrast to DLR at baseline, annual changes of DLR scores were not related to atrophy rates of ERC and hippocampus (both p > 0.3).
Fig. 3.
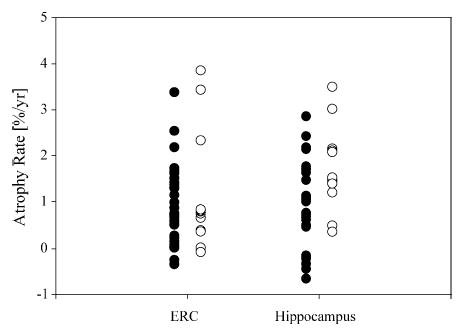
Atrophy rates of entorhinal cortex (ERC) and hippocampus in cognitively normal subjects with (○) and without (•) lacunes after correcting for age.
4. Discussion
The main findings of this study were: (1) age was associated with increased ERC and hippocampal atrophy rates; (2) atrophy rate of hippocampus, but not atrophy rate of ERC increased with presence of lacunes; (3) WMH, APOE ɛ4 and hypertension had no effect on atrophy rates of ERC and hippocampus.
The first finding was that ERC and hippocampal atrophy rates increased with increasing age in normal controls. Memory impairment is a prominent symptom of AD. Moreover, the ERC and hippocampus are both critical structures in the medial temporal lobe system that supports memory [51]. Thus, atrophy of the ERC and hippocampus could potentially be useful in predicting the future onset of dementia [22,27,43], and it will be important to know how normal aging affects these structures. For purposes of early detection, atrophy of a structure that is least affected by normal aging will have more utility than atrophy of a structure more greatly affected by normal aging. Over the last decade, modern stereological techniques to quantify the neuronal number suggested that there is minimal age-associated neuronal loss in the entorhinal cortex [19,40], but significant age-associated neuronal loss in hippocampal subiculum and CA1 [49,54,55]. Therefore, our finding that the rate of hippocampal atrophy is associated with age is consistent with these autopsy studies [49,54,55]. However, we also found that rate of ERC atrophy was increased with age, which contrasts with stereological evidence of minimal age-associated neuronal loss [19,40]. This may be due to the fact that structural MRI reflects the volume of all types of tissue, while stereological techniques quantify the neuronal number in the ERC. Raz and co-workers reported no relationship between age and ERC atrophy rates for subjects from age 26 to 82 years old [41,42], whereas our study included only 58–87 years old subjects. It is possible that rates of ERC atrophy increase disproportionately with age, which may explain the different findings. Furthermore, in our analysis of age effects, we excluded subjects with lacunes and hypertension that could have confounding effects. When subjects with lacunes and hypertension were included, we found that ERC atrophy rate was no longer related to age, similar to the report of Raz et al. [41,42]. In this study, we found that atrophy rates of ERC and hippocampus correlated with each other, suggests that common mechanisms, likely age, were driving the changes in ERC and hippocampus in CN elderly.
There are numerous imaging studies concerning the effects of age on brain structure [5,25,38,41,42,44,47,52], but most of them are cross-sectional studies [5,25,38,47,52]. Several cross-sectional studies, but not all found hippocampal volume decreases with age [5,25,38,47]. However, an aging effect is difficult to be determined in cross-sectional studies, because the volumes at baseline in individual subjects remain an unknown confound. In contrast, longitudinal studies can eliminate the baseline volume as a confounding factor. In this study, we performed both cross-sectional and longitudinal analyses in the same 27 elderly subjects from 58 to 87 years old and found a significant longitudinal, but not cross-sectional aging effect on hippocampal atrophy. This suggests that the longitudinal study may be more sensitive than the cross-sectional study to detect the aging effect on brain structure change.
The second finding was that atrophy rate of hippocampus, but not atrophy rate of ERC increased with presence of lacunes. This finding is consistent with previous human and animal studies showing that the hippocampus is selectively vulnerable to ischemia/hypoxia [4,29,30]. Furthermore, since an effect of lacunes on the rate of ERC atrophy was not detectable, our finding suggests that ERC atrophy rate may be more specific for AD pathology than hippocampal atrophy rate. However, AD patients have often co-existing cerebrovascular pathology, and further, AD and cerebrovascular disease may have an additional or even synergetic effect on dementia development [37,58]. Effect of lacunes on hippocampal atrophy rate but not ERC atrophy rate suggests that hippocampal atrophy rate may be a better marker for predicting the onset of dementia in subjects with cerebrovascular diseases than ERC atrophy rate. Furthermore, it may provide a possibility to separate AD pathology from concomitant vascular pathology leading to dementia. However, more data are needed to further explore this possibility. Lacunes have been shown to be a significant risk factor for dementia and cognitive impairment [53]. In this study, we found greater hippocampal atrophy rates in CN subjects with lacunes than those without lacunes, which suggests that lacunes may accelerate the deterioration of brain reserve in CN subjects before cognitive decline becomes apparent. This may explain at least in part why subjects with lacunes are at increased risk for AD [53]. In contrast to lacunes, there were no significant relationships between WMH and atrophy rate of ERC or hippocampus. Lacunes are small, deep cerebral infarcts attributed from microatheroma, lipohyalinosis and emboli [16]; however, the cause of age-related WMH remains uncertain. Histological study showed that some of age-related WMH were not associated with ischemia [14] and therefore may not be a specific marker for generalized cerebrovascular disease. In addition, we did not find a relationship between hypertension and atrophy rate of ERC or hippocampus.
Previous reports concerning effects of APOE ɛ4 on hippocampal atrophy from cross-sectional MRI are quite variable [23,33,39,45]. The longitudinal MRI study by Cohen et al. showed that atrophy rate of hippocampus was higher in CN subjects with APOE ɛ4 than those without APOE ɛ4 [6]. However, in the current longitudinal MRI study, we did not find a significant relationship between APOE ɛ4 status and increased hippocampal atrophy rate in CN. Further, we did not find a significant relationship between APOE ɛ4 status and increased ERC atrophy rate. Differences in subject demographics may partially explain the discrepant findings. Subjects without APOE ɛ4 in the longitudinal MRI study by Cohen et al. were 60.6 ± 10.2 years old and subjects with APOE ɛ4 were 55.1 ± 6.0 years old [6]. In contrast, subjects in the present study were much older (i.e., CN without APOE ɛ4: 73.6 ± 7.6 years old; CN with APOE ɛ4: 73.4 ± 6.4 years old). Previous cross-sectional MRI studies suggest that APOE ɛ4 only affect hippocampal volume loss in subjects who are younger than 70 years old [23,33]. Thus, the effects of APOE ɛ4 on ERC and hippocampal atrophy rates may be modulated by age.
Studies on the effects of normal aging on brain structures are very influenced by sample selection. One problem is to distinguish the effects of normal aging per se from the age-associated disease. In this study, we have attempted to determine the effect of normal aging on atrophy rates of ERC or hippocampus, separately from age-associated disease processes, such as lacunes, WMH, or hypertension in a highly selected elderly population who had – based on clinical examinations – no diseases, normal cognition and no cognitive decline at follow-up over more than 3 years as well as no neuropathological lesions on MRI except WMH. Therefore, our finding should truly reflect the effect of normal aging on ERC and hippocampal atrophy. However, despite our efforts, there still remains the possibility that the development of pre-clinical AD, cerebrovascular disease, or other age-associated disease processes may be, in part, responsible for our findings. In this study, we assumed that the increase of atrophy rate of ERC and hippocampus with age was linear, but this may not be the case. Rodrigue and Raz found a quadratic relationship between atrophy rate of hippocampus and age in a group of CN subjects from 26 to 82 years old [42]. Adding a quadratic term for age in this study, however, made no significant contribution. The different findings between this study and that by Rodrigue et al. may be related to the fact that age range in our study was limited from 58 to 87 years old, while atrophy rate of hippocampus starts to increase in subjects who are around 40 years old, as shown by Rodrigue et al. Although we found a significant effect of lacunes on atrophy rate of hippocampus, it has to be aware that lacunes were not confirmed by pathological evaluation but merely by their morphological appearance and signal intensity on MRI data. In addition, the small number of subjects, who had lacunes in each subcortical location, prevented a rigorous analysis of an association between lacunar location and atrophy rates.
In summary, our results suggest that both ERC and hippocampal atrophy rates increase with increasing age and presence of lacunes increase atrophy rate of hippocampus in CN subjects. Therefore, age and presence of lacunes should be considered in the analysis of longitudinal MRI studies for early diagnosis and treatment assessment of AD.
Acknowledgments
This work was supported in part by VA Research Service (MIRECC), VA REAP, NIH/NIA RO1 AG10897, and NIH/NIA PO1 AG12435. We thank Ms. Diana Sacrey and Ms. Meera Krishnan.
References
- 1.Blacker D, Tanzi RE. The genetics of Alzheimer disease: current status and future prospects. Arch Neurol. 1998;55:294–6. doi: 10.1001/archneur.55.3.294. [DOI] [PubMed] [Google Scholar]
- 2.Brayne C, Gill C, Paykel ES, Huppert F, O’Connor DW. Cognitive decline in an elderly population—a two wave study of change. Psychol Med. 1995;25:673–83. doi: 10.1017/s0033291700034930. [DOI] [PubMed] [Google Scholar]
- 3.Cardenas VA, Ezekiel F, Di SV, Gomberg B, Fein G. Reliability of tissue volumes and their spatial distribution for segmented magnetic resonance images. Psychiatry Res. 2001;106:193–205. doi: 10.1016/s0925-4927(01)00075-0. [DOI] [PubMed] [Google Scholar]
- 4.Cervos-Navarro J, Diemer NH. Selective vulnerability in brain hypoxia. Crit Rev Neurobiol. 1991;6:149–82. [PubMed] [Google Scholar]
- 5.Coffey CE, Wilkinson WE, Parashos IA, Soady SA, Sullivan RJ, Patterson LJ, et al. Quantitative cerebral anatomy of the aging human brain: a cross-sectional study using magnetic resonance imaging. Neurology. 1992;42:527–36. doi: 10.1212/wnl.42.3.527. [DOI] [PubMed] [Google Scholar]
- 6.Cohen RM, Small C, Lalonde F, Friz J, Sunderland T. Effect of apolipoprotein E genotype on hippocampal volume loss in aging healthy women. Neurology. 2001;57:2223–8. doi: 10.1212/wnl.57.12.2223. [DOI] [PubMed] [Google Scholar]
- 7.Corder EH, Saunders AM, Strittmatter WJ, Schmechel DE, Gaskell PC, Small GW, et al. Gene dose of apolipoprotein E type 4 allele and the risk of Alzheimer’s disease in late onset families. Science. 1993;261:921–3. doi: 10.1126/science.8346443. [DOI] [PubMed] [Google Scholar]
- 8.de Groot JC, de Leeuw FE, Oudkerk M, Hofman A, Jolles J, Breteler MM. Cerebral white matter lesions and subjective cognitive dysfunction: the Rotterdam scan study. Neurology. 2001;56:1539–45. doi: 10.1212/wnl.56.11.1539. [DOI] [PubMed] [Google Scholar]
- 9.Du AT, Schuff N, Amend D, Laakso MP, Hsu YY, Jagust WJ, et al. Magnetic resonance imaging of the entorhinal cortex and hippocampus in mild cognitive impairment and Alzheimer’s disease. J Neurol Neurosurg Psychiatry. 2001;71:441–7. doi: 10.1136/jnnp.71.4.441. [DOI] [PMC free article] [PubMed] [Google Scholar]
- 10.Du AT, Schuff N, Kramer JH, Ganzer S, Zhu XP, Jagust WJ, et al. Higher atrophy rate of entorhinal cortex than hippocampus in AD. Neurology. 2004;62:422–7. doi: 10.1212/01.wnl.0000106462.72282.90. [DOI] [PMC free article] [PubMed] [Google Scholar]
- 11.Du AT, Schuff N, Zhu XP, Jagust WJ, Miller BL, Reed BR, et al. Atrophy rates of entorhinal cortex in AD and normal aging. Neurology. 2003;60:481–6. doi: 10.1212/01.wnl.0000044400.11317.ec. [DOI] [PMC free article] [PubMed] [Google Scholar]
- 12.Elias MF, Wolf PA, D’Agostino RB, Cobb J, White LR. Untreated blood pressure level is inversely related to cognitive functioning: the Framingham study. Am J Epidemiol. 1993;138:353–64. doi: 10.1093/oxfordjournals.aje.a116868. [DOI] [PubMed] [Google Scholar]
- 13.Esiri MM, Nagy Z, Smith MZ, Barnetson L, Smith AD. Cerebrovascular disease and threshold for dementia in the early stages of Alzheimer’s disease. Lancet. 1999;354:919–20. doi: 10.1016/S0140-6736(99)02355-7. [DOI] [PubMed] [Google Scholar]
- 14.Fazekas F, Schmidt R, Scheltens P. Pathophysiologic mechanisms in the development of age-related white matter changes of the brain. Dement Geriatr Cogn Disord. 1998;9:2–5. doi: 10.1159/000051182. [DOI] [PubMed] [Google Scholar]
- 15.Fein G, Di Sclafani V, Tanabe J, Cardenas V, Weiner MW, Jagust WJ, et al. Hippocampal and cortical atrophy predict dementia in subcortical ischemic vascular disease. Neurology. 2000;55:1626–35. doi: 10.1212/wnl.55.11.1626. [DOI] [PMC free article] [PubMed] [Google Scholar]
- 16.Fisher CM. Lacunar strokes and infarcts: a review. Neurology. 1982;32:871–6. doi: 10.1212/wnl.32.8.871. [DOI] [PubMed] [Google Scholar]
- 17.Folstein MF, Folstein SE, McHugh PR. “Mini-mental state”: a practical method for grading the cognitive state of patients for the clinician”. J Psychiatr Res. 1975;12:189–98. doi: 10.1016/0022-3956(75)90026-6. [DOI] [PubMed] [Google Scholar]
- 18.Frisoni GB, Calabresi L, Geroldi C, Bianchetti A, D’Acquarica AL, Govoni S, et al. Apolipoprotein E epsilon 4 allele in Alzheimer’s disease and vascular dementia. Dementia. 1994;5:240–2. doi: 10.1159/000106730. [DOI] [PubMed] [Google Scholar]
- 19.Gazzaley AH, Thakker MM, Hof PR, Morrison JH. Preserved number of entorhinal cortex layer II neurons in aged macaque monkeys. Neurobiol Aging. 1997;18:549–53. doi: 10.1016/s0197-4580(97)00112-7. [DOI] [PubMed] [Google Scholar]
- 20.Hsu YY, Schuff N, Du AT, Mark k, Zhu X, Hardin D, et al. Comparison of automated and manual MRI volumetry of hippocampus in normal aging and dementia. J Magn Reson Imaging. 2002;16:305–10. doi: 10.1002/jmri.10163. [DOI] [PMC free article] [PubMed] [Google Scholar]
- 21.Jack CR, Jr, Petersen RC, O’Brien PC, Tangalos EG. MR-based hippocampal volumetry in the diagnosis of Alzheimer’s disease. Neurology. 1992;42:183–8. doi: 10.1212/wnl.42.1.183. [DOI] [PubMed] [Google Scholar]
- 22.Jack CR, Jr, Petersen RC, Xu Y, O’Brien PC, Smith GE, Ivnik RJ, et al. Rates of hippocampal atrophy correlate with change in clinical status in aging and AD. Neurology. 2000;55:484–9. doi: 10.1212/wnl.55.4.484. [DOI] [PMC free article] [PubMed] [Google Scholar]
- 23.Jack CR, Jr, Petersen RC, Xu YC, O’Brien PC, Waring SC, Tangalos EG, et al. Hippocampal atrophy and apolipoprotein E genotype are independently associated with Alzheimer’s disease. Ann Neurol. 1998;43:303–10. doi: 10.1002/ana.410430307. [DOI] [PMC free article] [PubMed] [Google Scholar]
- 24.Jack CR, Jr, Slomkowski M, Gracon S, Hoover TM, Felmlee JP, Stewart K, et al. MRI as a biomarker of disease progression in a therapeutic trial of milameline for AD. Neurology. 2003;60:253–60. doi: 10.1212/01.wnl.0000042480.86872.03. [DOI] [PMC free article] [PubMed] [Google Scholar]
- 25.Jernigan TL, Archibald SL, Fennema-Notestine C, Gamst AC, Stout JC, Bonner J, et al. Effects of age on tissues and regions of the cerebrum and cerebellum. Neurobiol Aging. 2001;22:581–94. doi: 10.1016/s0197-4580(01)00217-2. [DOI] [PubMed] [Google Scholar]
- 26.Juottonen K, Laakso MP, Partanen K, Soininen H. Comparative MR analysis of the entorhinal cortex and hippocampus in diagnosing Alzheimer disease. AJNR Am J Neuroradiol. 1999;20:139–44. [PubMed] [Google Scholar]
- 27.Kaye JA, Swihart T, Howieson D, Dame A, Moore MM, Karnos T, et al. Volume loss of the hippocampus and temporal lobe in healthy elderly persons destined to develop dementia. Neurology. 1997;48:1297–304. doi: 10.1212/wnl.48.5.1297. [DOI] [PubMed] [Google Scholar]
- 28.Kemper T, Moss MB, Hollander W, Prusty S. Microinfarction as a result of hypertension in a primate model of cerebrovascular disease. Acta Neuropathol (Berl) 1999;98:295–303. doi: 10.1007/s004010051083. [DOI] [PubMed] [Google Scholar]
- 29.Kirino T, Sano K. Selective vulnerability in the gerbil hippocampus following transient ischemia. Acta Neuropathol (Berl) 1984;62:201–8. doi: 10.1007/BF00691853. [DOI] [PubMed] [Google Scholar]
- 30.Kohmura E, Yamada K, Hayakawa T, Kinoshita A, Matsumoto K, Mogami H. Hippocampal neurons become more vulnerable to glutamate after subcritical hypoxia: an in vitro study. J Cereb Blood Flow Metab. 1990;10:877–84. doi: 10.1038/jcbfm.1990.144. [DOI] [PubMed] [Google Scholar]
- 31.Korten AE, Henderson AS, Christensen H, Jorm AF, Rodgers B, Jacomb P, et al. A prospective study of cognitive function in the elderly. Psychol Med. 1997;27:919–30. doi: 10.1017/s0033291797005217. [DOI] [PubMed] [Google Scholar]
- 32.Launer LJ, Masaki K, Petrovitch H, Foley D, Havlik RJ. The association between midlife blood pressure levels and late-life cognitive function. The Honolulu-Asia aging study. JAMA. 1995;274:1846–51. [PubMed] [Google Scholar]
- 33.Lehtovirta M, Soininen H, Laakso MP, Partanen K, Helisalmi S, Mannermaa A, et al. SPECT and MRI analysis in Alzheimer’s disease: relation to apolipoprotein E epsilon 4 allele. J Neurol Neurosurg Psychiatry. 1996;60:644–9. doi: 10.1136/jnnp.60.6.644. [DOI] [PMC free article] [PubMed] [Google Scholar]
- 34.Longstreth WT, Jr, Bernick C, Manolio TA, Bryan N, Jungreis CA, Price TR. Lacunar infarcts defined by magnetic resonance imaging of 3660 elderly people: the cardiovascular health study. Arch Neurol. 1998;55:1217–25. doi: 10.1001/archneur.55.9.1217. [DOI] [PubMed] [Google Scholar]
- 35.Mungas D, Jagust WJ, Reed BR, Kramer JH, Weiner MW, Schuff N, et al. MRI predictors of cognition in subcortical ischemic vascular disease and Alzheimer’s disease. Neurology. 2001;57:2229–35. doi: 10.1212/wnl.57.12.2229. [DOI] [PMC free article] [PubMed] [Google Scholar]
- 36.Mungas D, Reed BR, Jagust WJ, DeCarli C, Mack WJ, Kramer JH, et al. Volumetric MRI predicts rate of cognitive decline related to AD and cerebrovascular disease. Neurology. 2002;59:867–73. doi: 10.1212/wnl.59.6.867. [DOI] [PMC free article] [PubMed] [Google Scholar]
- 37.Nagy Z, Esiri MM, Jobst KA, Morris JH, King EM, McDonald B, et al. The effects of additional pathology on the cognitive deficit in Alzheimer disease. J Neuropathol Exp Neurol. 1997;56:165–70. doi: 10.1097/00005072-199702000-00007. [DOI] [PubMed] [Google Scholar]
- 38.Pfefferbaum A, Mathalon DH, Sullivan EV, Rawles JM, Zipursky RB, Lim KO. A quantitative magnetic resonance imaging study of changes in brain morphology from infancy to late adulthood. Arch Neurol. 1994;51:874–87. doi: 10.1001/archneur.1994.00540210046012. [DOI] [PubMed] [Google Scholar]
- 39.Plassman BL, Welsh-Bohmer KA, Bigler ED, Johnson SC, Anderson CV, Helms MJ, et al. Apolipoprotein E epsilon 4 allele and hippocampal volume in twins with normal cognition. Neurology. 1997;48:985–9. doi: 10.1212/wnl.48.4.985. [DOI] [PubMed] [Google Scholar]
- 40.Price JL, Ko AI, Wade MJ, Tsou SK, McKeel DW, Morris JC. Neuron number in the entorhinal cortex and CA1 in preclinical Alzheimer disease. Arch Neurol. 2001;58:1395–402. doi: 10.1001/archneur.58.9.1395. [DOI] [PubMed] [Google Scholar]
- 41.Raz N, Rodrigue KM, Head D, Kennedy KM, Acker JD. Differential aging of the medial temporal lobe: a study of a five-year change. Neurology. 2004;62:433–8. doi: 10.1212/01.wnl.0000106466.09835.46. [DOI] [PubMed] [Google Scholar]
- 42.Rodrigue KM, Raz N. Shrinkage of the entorhinal cortex over five years predicts memory performance in healthy adults. J Neurosci. 2004;24:956–63. doi: 10.1523/JNEUROSCI.4166-03.2004. [DOI] [PMC free article] [PubMed] [Google Scholar]
- 43.Rusinek H, De Santi S, Frid D, Tsui WH, Tarshish CY, Convit A, et al. Regional brain atrophy rate predicts future cognitive decline: 6-year longitudinal MR imaging study of normal aging. Radiology. 2003;229:691–6. doi: 10.1148/radiol.2293021299. [DOI] [PubMed] [Google Scholar]
- 44.Scahill RI, Frost C, Jenkins R, Whitwell JL, Rossor MN, Fox NC. A longitudinal study of brain volume changes in normal aging using serial registered magnetic resonance imaging. Arch Neurol. 2003;60:989–94. doi: 10.1001/archneur.60.7.989. [DOI] [PubMed] [Google Scholar]
- 45.Schmidt H, Schmidt R, Fazekas F, Semmler J, Kapeller P, Reinhart B, et al. Apolipoprotein E e4 allele in the normal elderly: neuropsychologic and brain MRI correlates. Clin Genet. 1996;50:293–9. doi: 10.1111/j.1399-0004.1996.tb02377.x. [DOI] [PubMed] [Google Scholar]
- 46.Schmidt R, Fazekas F, Kapeller P, Schmidt H, Hartung HP. MRI white matter hyperintensities: three-year follow-up of the Austrian stroke prevention study. Neurology. 1999;53:132–9. doi: 10.1212/wnl.53.1.132. [DOI] [PubMed] [Google Scholar]
- 47.Schuff N, Amend D, Knowlton R, Tanabe J, Norman D, Fein G, et al. Age-related metabolite changes and volume loss in hippocampus by proton MR spectroscopic imaging and MRI neurobiology of aging. Neurobiol Aging. 1999;10:279–85. doi: 10.1016/s0197-4580(99)00022-6. [DOI] [PMC free article] [PubMed] [Google Scholar]
- 48.Seab JP, Jagust WJ, Wong ST, Roos MS, Reed BR, Budinger TF. Quantitative NMR measurements of hippocampal atrophy in Alzheimer’s disease. Magn Reson Med. 1988;8:200–8. doi: 10.1002/mrm.1910080210. [DOI] [PubMed] [Google Scholar]
- 49.Simic G, Kostovic I, Winblad B, Bogdanovic N. Volume and number of neurons of the human hippocampal formation in normal aging and Alzheimer’s disease. J Comp Neurol. 1997;379:482–94. doi: 10.1002/(sici)1096-9861(19970324)379:4<482::aid-cne2>3.0.co;2-z. [DOI] [PubMed] [Google Scholar]
- 50.Snowdon DA, Greiner LH, Mortimer JA, Riley KP, Greiner PA, Markesbery WR. Brain infarction and the clinical expression of Alzheimer disease. The Nun Study JAMA. 1997;277:813–7. [PubMed] [Google Scholar]
- 51.Squire LR, Zola-Morgan S. The medial temporal lobe memory system. Science. 1991;253:1380–6. doi: 10.1126/science.1896849. [DOI] [PubMed] [Google Scholar]
- 52.Sullivan EV, Marsh L, Mathalon DH, Lim KO, Pfefferbaum A. Age-related decline in MRI volumes of temporal lobe gray matter but not hippocampus. Neurobiol Aging. 1995;16:591–606. doi: 10.1016/0197-4580(95)00074-o. [DOI] [PubMed] [Google Scholar]
- 53.Vermeer SE, Prins ND, den Heijer T, Hofman A, Koudstaal PJ, Breteler MM. Silent brain infarcts and the risk of dementia and cognitive decline. N Engl J Med. 2003;348:1215–22. doi: 10.1056/NEJMoa022066. [DOI] [PubMed] [Google Scholar]
- 54.West MJ. Regionally specific loss of neurons in the aging human hippocampus. Neurobiol Aging. 1993;14:287–93. doi: 10.1016/0197-4580(93)90113-p. [DOI] [PubMed] [Google Scholar]
- 55.West MJ, Coleman PD, Flood DG, Troncoso JC. Differences in the pattern of hippocampal neuronal loss in normal ageing and Alzheimer’s disease. Lancet. 1994;344:769–72. doi: 10.1016/s0140-6736(94)92338-8. [DOI] [PubMed] [Google Scholar]
- 56.Williams JM. Memory Assessment Scales. Odessa, FL: Psychological Assessment Resources; 1991. [Google Scholar]
- 57.Xu Y, Jack CJ, O’Brien PC, Kokmen E, Smith GE, Ivnik RJ, et al. Usefulness of MRI measures of entorhinal cortex versus hippocampus in AD. Neurology. 2000;54:1760–7. doi: 10.1212/wnl.54.9.1760. [DOI] [PubMed] [Google Scholar]
- 58.Zekry D, Duyckaerts C, Moulias R, Belmin J, Geoffre C, Herrmann F, et al. Degenerative and vascular lesions of the brain have synergistic effects in dementia of the elderly. Acta Neuropathol (Berl) 2002;103:481–7. doi: 10.1007/s00401-001-0493-5. [DOI] [PubMed] [Google Scholar]