

Abstract
OBJECTIVES Our objective in this study was to evaluate Tpeak-Tend interval (Tp-e) and other electrocardiographic parameters as risk factors for recurrence of life-threatening cardiac events in patients with the Brugada syndrome (BS).
BACKGROUND The Tp-e interval in the electrocardiogram (ECG) has been reported to predict life-threatening arrhythmias in the long QT syndrome.
METHODS Twenty-nine patients with the ECG pattern of BS and 29 healthy age- and gender-matched controls were studied. The follow-up period was 42.65 ± 24.42 months (range 11 to 108 months).
RESULTS Upon presentation, five patients had suffered aborted sudden death, five syncope, and two presyncope. Eleven patients with the ECG pattern of BS had a prolonged (>460 ms) QTc in V2 but usually not in inferior or left leads. No patient had abnormally prolonged QT dispersion. Programmed electrical stimulation induced ventricular tachycardia/fibrillation in 5 out of 26 patients. Inducibility did not predict recurrence of events. Cardioverter-defibrillators were implanted in 14 patients (all symptomatic and two asymptomatic). During follow-up, nine symptomatic patients experienced recurrences. Previous cardiac events and a QTc >460 ms in V2 were significant risk factors (p = 0.00002 and p = 0.03, respectively). Tp-e and Tp-e dispersion were significantly prolonged in patients with recurrences versus patients without events (104.4 and 35.6 ms vs. 87.4 and 23.2 ms; p = 0.006 and p = 0.03, respectively) or controls (90.7 and 17.9 ms; p = 0.02 and p = 0.001, respectively).
CONCLUSIONS Our study demonstrates significant correlation between previous events, QTc >460 ms in V2, Tp-e, and Tp-e dispersion and occurrence of life-threatening arrhythmic events, suggesting that these parameters may be useful in risk stratification of patients with the Brugada syndrome. (J Am Coll Cardiol 2006;47:1828-34)
Brugada syndrome (BS) is characterized by a coved-type ST-segment elevation in leads V1 to V3 of the electrocardiogram (ECG) and a high incidence of sudden cardiac death or syncope secondary to ventricular tachycardia (VT)/ ventricular fibrillation (VF) in structurally normal hearts (1). Risk stratification is controversial, especially in asymptomatic individuals (2-4). Among the recently reported risk factors associated with VT/VF are a spontaneous coved-type ST-segment elevation, male gender, history of syncope or aborted sudden death, and programmed electrical stimulation (PES)-induced VT/VF (5). The present study was designed to examine the Tpeak-Tend interval (Tp-e) and Tp-e dispersion as risk factors for arrhythmic events in BS patients.
METHODS
Between November 1995 and February 2004, we enrolled 29 consecutive patients (4 female, 12 symptomatic, mean age 42.3 ± 12.2 years) referred to the Arrhythmia Unit and diagnosed with ECG pattern of Brugada syndrome (Table 1) and 29 healthy age-matched subjects for the purpose of comparison of ECG parameters. The study was approved by the ethical committee of the Cardiovascular Surgery and Cardiology Institute, Havana, Cuba. Clinical history, ECG, and echocardiogram were performed in all patients. Programmed electrical stimulation was carried out in all asymptomatic and nine symptomatic patients with the ECG pattern of BS in one or more right precordial leads. We used a standard PES protocol in the first nine patients: three cycle length basic (600, 500, and 400 ms) and three extra stimuli from the right ventricular apex, with coupling interval not <200 ms, and used the protocol suggested in the recent consensus report (6) in all other patients.
Table 1.
Clinical Characteristics of 29 Consecutive Patients Identified With the Brugada Syndrome Electrocardiogram
| Patient # | Inducible | Symptomatic | Age(yrs) | Gender | QTc Lead II(ms) | QTc V2(ms) | QTc V5 (ms) | Tp-e Interval (ms) | Tp-e Dispersion(ms) | QT Dispersion(ms) |
|---|---|---|---|---|---|---|---|---|---|---|
| 1-JCB | No | Yes | 45 | Male | 380 | 380 | 380 | 80 | 20 | 20 |
| 2-LSR | - | Yes | 36 | Male | 401 | 401 | 401 | 120 | 20 | 40 |
| 3-NLC | No | Yes | 33 | Male | 454 | 475 | - | 120 | 40 | 60 |
| 4-MGC | Yes | Yes | 47 | Male | 469 | 492 | 469 | 80 | 20 | 40 |
| 5-OGC | Yes | Yes | 37 | Male | 447 | 492 | 469 | 100 | 40 | 60 |
| 6-RMA | No | Yes | 29 | Male | 425 | 458 | 425 | 100 | 40 | 40 |
| 7-JMR | – | Yes | 49 | Male | 469 | 492 | 447 | 120 | 40 | 60 |
| 8-ARL | No | Yes | 47 | Male | 400 | 380 | 400 | 80 | 20 | 40 |
| 9-GRA | – | Yes | 37 | Male | 441 | 490 | 441 | 120 | 60 | 40 |
| 10-PGP | No | Yes | 44 | Male | 438 | 438 | 415 | 100 | 40 | 20 |
| 11-GPT | Yes | Yes | 53 | Male | 433 | 487 | 433 | 80 | 20 | 40 |
| 12-RRG | No | Yes | 46 | Male | 402 | 402 | 380 | 80 | 20 | 40 |
| 13-JLLS | No | No | 35 | Male | 360 | 360 | 360 | 80 | 20 | 20 |
| 14-EGT | No | No | 27 | Male | 392 | 415 | 392 | 80 | 20 | 20 |
| 15-GMH | Yes | No | 38 | Male | 389 | 389 | 389 | 80 | 20 | 20 |
| 16-RHG | No | No | 51 | Male | 380 | 380 | 380 | 80 | 20 | 20 |
| 17-PBL | No | No | 58 | Male | 389 | 454 | 389 | 100 | 20 | 60 |
| 18-RMV | No | No | 34 | Male | 392 | 441 | 392 | 80 | 20 | 40 |
| 19-DCC | Yes | No | 59 | Female | 469 | 514 | 469 | 100 | 20 | 40 |
| 20-MFS | No | No | 28 | Female | 402 | 447 | 402 | 100 | 20 | 60 |
| 21-OPG | No | No | 61 | Female | 400 | 400 | 400 | 100 | 20 | 20 |
| 22-EGC | No | No | 36 | Male | 437 | 416 | 416 | 80 | 20 | 20 |
| 23-RPA | No | No | 56 | Male | 442 | 471 | 442 | 80 | 20 | 20 |
| 24-NRJ | No | No | 44 | Male | 405 | 452 | 405 | 80 | 20 | 40 |
| 25-FMH | No | No | 39 | Male | 447 | 492 | 447 | 120 | 60 | 60 |
| 26-GPB | No | No | 27 | Male | 400 | 440 | 400 | 80 | 20 | 40 |
| 27-ADB | No | No | 20 | Male | 439 | 490 | 439 | 80 | 20 | 40 |
| 28-LBM | No | No | 22 | Female | 416 | 441 | 416 | 80 | 40 | 20 |
| 29-EQM | No | No | 68 | Male | 484 | 531 | 484 | 100 | 20 | 40 |
Patient #26 is the son of Patient #11. Patients #11, #23, and #27 had heart rates ≥ 100 beats/min.Tp-e Tpeak-Tend interval.
Pharmacologic challenge with intravenous ajmaline (1 mg/kg body weight) or procainamide (10 mg/kg body weight) was performed in 7 symptomatic and 11 asymptomatic patients who did not display the ECG pattern of BS in more than one lead at the time of PES. The QT, QTc, QT dispersion, Tp-e, and Tp-e dispersion (defined as the difference between the maximum and minimum Tp-e interval in the precordial leads V1 to V6 during a single beat) were manually measured. The ECG was recorded with a standard digital recorder as 12 simultaneous leads at a paper speed of 25 mm/s. The QTc was obtained using Bazett’s formula (7). The QT interval was measured from the beginning of the QRS to the end of T-wave, defined as the intersection of the tangent to the downslope of the T-wave and the isoelectric line (8). The QT dispersion was defined as the difference between the maximum and minimum QT interval of the 12 leads (9). The Tp-e was measured in each precordial lead and obtained from the difference between QT interval and QTpeak interval; measured from the beginning of the QRS until the peak of the T-wave (Fig. 1). In the case of negative or biphasic T waves, QTpeak was measured to the nadir of the T-wave. T waves smaller than 1.5 mm in amplitude were not measured. The Tp-e value reported was the maximum obtained by two observers in all precordial leads.
Figure 1.
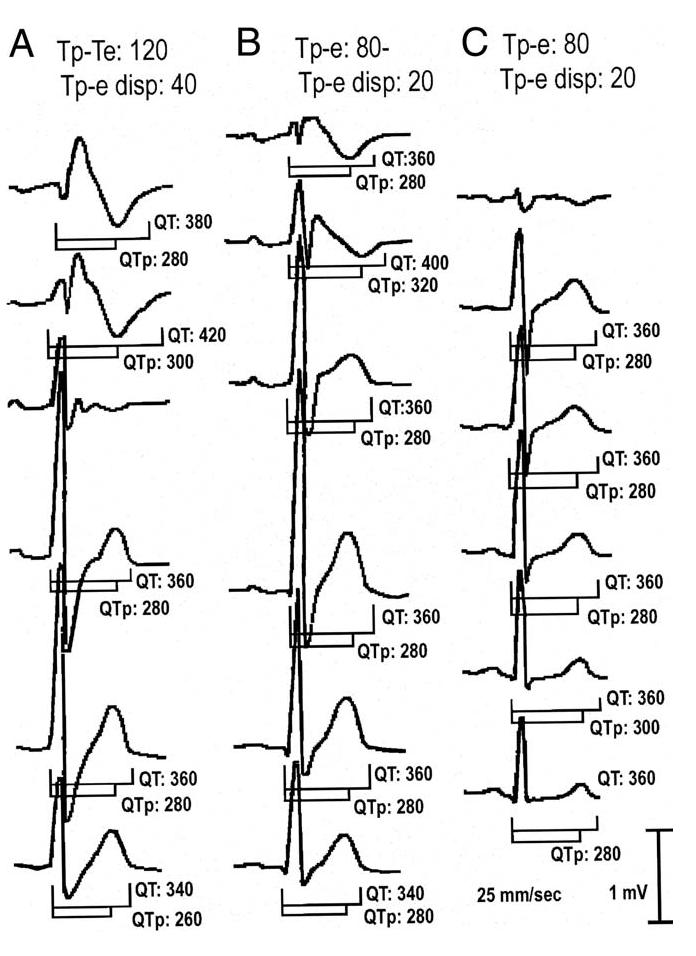
Precordial leads of the electrocardiogram (ECG) of a patient with the Brugada syndrome with recurrences (A), a Brugada-type ECG (B), and a control case (C). Numbers depict measured values for QT, QTpeak (QTp) and Tpeak-Tend interval (Tp-e). All values are in ms. T waves <1.5 mm were not measured.
The measurement of each parameter was obtained by averaging three consecutive beats. Two independent experts obtained the measurements and in case of a difference of >20 ms in each measurement, an agreement was obtained or a third expert was recruited.
The end point of the study was clinical (syncope, aborted sudden death) and/or documented VT/VF. Follow-up of patients with BS consisted of two visits per year, during which an ECG was performed and the implantable cardioverter-defibrillator (ICD) checked; most patients with BS-pattern ECG were contacted only by telephone, whereas some were more closely followed. The control group did not have follow-up.
Statistics. Categorical variables were compared using chi-squared test. Group differences were analyzed by one-way ANOVA followed by Scheffé’s multiple comparison test. Numeric variables were compared using dependent-samples t test. To examine prognostic value from Tp-e and Tp-e dispersion and determine cutoff values, analysis of receiver-operating characteristic (ROC) curves were made according to standard procedures (10). Kaplan-Meier survival curves were plotted, and log rank test was used to compare the curves. Data are expressed as mean ± SD. A value of p < 0.05 was considered statistically significant.
RESULTS
Table 1 presents the clinical characteristics of the 29 consecutive patients in which a BS-pattern ECG was identified. Fifteen patients were classified as BS, 12 of them symptomatic (5 aborted sudden death, 5 syncope, and 2 pre-syncope) and 3 asymptomatic (VT/VF was induced in 2, and 1 was the son of a symptomatic BS patient). Eight symptomatic patients displayed a type 1 basal ECG in more than one lead and two in one lead, and two displayed a normal basal ECG; one asymptomatic patient had a type 1 basal ECG in more than one lead, one displayed a coved-type basal ECG in one lead but with a J point elevation of <2 mV, and another had type 1 basal ECG but only in one lead.
With regard to BS-pattern ECG, eight displayed a type 1 basal ECG in more than one lead and five in only one lead, and one had a coved-type basal ECG in one lead but with a J point elevation of <2 mV. No patient displayed abnormally prolonged QT dispersion.
A pharmacologic challenge was performed in nine BS patients, seven of them symptomatic and two asymptomatic. All tested patients displayed a type 1 ECG in at least two leads following challenge with a sodium-channel blocker. Thus, all BS patients displayed a type 1 ECG in at least two leads with or without drugs, except one patient who had type 1 ECG in one lead and in whom the pharmacologic test was not performed.
Pharmacologic challenge was performed in nine patients with a BS-pattern ECG; seven displayed a type 1 ECG in more than one lead, and two had a type 1 ECG in only one lead.
Seven patients with BS and four with BS-type ECG had a maximal QTc >460 ms (Table 2). The longest QT and QTc values measured under basal conditions (maxQT and maxQTc) were observed in V2 in 27 and in lead II in 2 of the 29 patients with a type I ECG. In the presence of sodium-channel blockers, the longest QT and QTc values were observed in V2 in 29 out of 29 patients. In contrast, the longest QT and QTc was typically observed in lead II in controls. Among the patients in which a sodium-channel block test was performed, QT and QTc values were greater in the right precordial leads (V2) than in the inferior (II) or left precordial (V5) leads before challenge with a sodium-channel blocker, and this difference was further pronounced after drug (Table 3).
Table 2.
Electrocardiographic Parameters
| maxQT | maxQTc | Tp-e | Tp-e Dispersion | Cardiac Events or Recurrences | Total | |
|---|---|---|---|---|---|---|
| Control | ||||||
| Asymptomatic | ||||||
| maxQTc≤ 460 | 369 ± 24.4 | 404 ± 24.8] | 91 ± 12.7 | 18 ± 12.6 | 0 | 29 |
| maxQTc> 460 | 0 | 0 | 0 | 0 | 0 | 0 |
| BS-type ECG | ||||||
| Asymptomatic | ||||||
| maxQTc≤ 460 | 382 ± 28.9 | 436 ± 19.5 | 87 ± 10.0 | 22 ± 6.3 | 0 | 10 |
| maxQTc > 460* | 390 ± 52.9 | 488 ± 12.2 | 95 ± 19.1 | 30 ± 20 | 0 | 4 |
| BS patients (spontaneous type 1 ECG in more than one lead) | ||||||
| Symptomatic | ||||||
| maxQTc≤ 460 | 367 ± 11.5 | 418 ± 9.8 | 93 ± 11.5 | 33 ± 11.5 | 2 | 3 |
| maxQTc > 460 | 416 ± 32.8 | 479 ± 11.4 | 108 ± 17.8 | 40 ± 14.1 | 5 | 5 |
| Asymptomatic | ||||||
| maxQTc ≤ 460 | 0 | 0 | 0 | 0 | 0 | 0 |
| maxQTc > 460 | 440 ± 0.0 | 492 ± 0.0 | 100 ± 0.0 | 20 ± 0.0 | 0 | 1 |
| BS patients (sodium-channel blocker induced type 1 ECG in more than one lead) | ||||||
| Symptomatic | ||||||
| maxQTc ≤ 460 | 395 ± 7.0 | 403 ± 18.4 | 80 ± 0.0 | 20 ± 0.0 | 0 | 2 |
| maxQTc > 460† | 440 ± 0.0 | 492 ± 0.0 | 80 ± 0.0 | 20 ± 0.0 | 1 | 1 |
| Asymptomatic | ||||||
| maxQTc ≤ 460 | 390 ± 42.4 | 411 ± 12.7 | 80 ± 0.0 | 20 ± 0.0 | 0 | 2 |
| maxQTc > 460 | 0 | 0 | 0 | 0 | 0 | 0 |
All values are in ms. maxQT and maxQTc represent the longest QT and QTc intervals in any of the 12 leads (usually in V2). One BS patient (who suffered recurrences) had a spontaneous type 1 ECG in one lead and the pharmacologic test was not performed. QT: 440; QTc: 401; Tp-e: 120; Tp-e dispersion: 20.
Two asymptomatic patients and
one symptomatic Brugada patient had heart rate 100 beats/min at time of ECG measurement.
BS = Brugada syndrome; ECG = electrocardiogram; Tp-e = Tpeak-Tend interval.
Table 3.
Effect of Sodium-Channel Blocker Challenge on QT and QTc
| QTc Before Test | QTc After Test | |||
|---|---|---|---|---|
| Leads | n | (Mean ± SD) | (Mean ± SD) | Statistics* |
| II | 17 | 416.7 ± 27.5 | 445.7 ± 92.0 | p = 0.2 |
| V2 | 18 | 433.3 ± 40.0 | 511.7 ± 42.0 | p = 0.0000001 |
| V5 | 17 | 393.5 ± 77.3 | 461.1 ± 31.5 | p = 0.006 |
All values are in ms.
t test for dependent samples.
Ventricular tachycardia/ventricular fibrillation was induced in five patients (three symptomatics). Cardioverter-defibrillators were implanted in 14 patients (all 12 of the symptomatic and 2 of the asymptomatic patients). No statistically significant association was found between inducibility and recurrence of VT/VF. Positive predictive value of PES induction of VT/VF was 60%, and negative predictive value was 85.7%.
Of the symptomatic patients, nine suffered a recurrence during the follow-up period; polymorphic VT and/or VF was detected and converted by appropriate discharge of the ICD. The occurrence of previous events was a highly significant risk factor (p = 0.00002) (Table 4). QTc >460 ms in V2 was also a risk factor for recurrences (p = 0.03) (Table 5). Most of the recurrences (55.5%) were in patients with a spontaneous type 1 ECG in more than one lead, a maxQTc >460 ms, and an average value of Tp-e >100 ms (Tables 1 and 2).
Table 4.
Association Between Previous and New Arrhythmic Events
| New Events | No Events | Totals | |
|---|---|---|---|
| Previous events | 9 | 3 | 12 |
| No events | 0 | 17 | 17 |
| Totals | 9 | 20 | 29 |
Statistics: Pearson chi-square p = 0.00002.
Table 5.
Association Between QTc 460 ms and New Arrhythmic Events
| New Events | No Events | Totals | |
|---|---|---|---|
| QTc >460 ms | |||
| Yes | 6 | 5 | 11 |
| No | 3 | 15 | 18 |
| Totals | 9 | 20 | 29 |
Statistics: Pearson chi-square p = 0.03.
The Tp-e and Tp-e dispersion were significantly longer in patients experiencing a recurrence compared with those who did not (104.4 and 35.6 ms vs. 87.4 and 23.2 ms; p = 0.006 and p = 0.03; respectively) as well as compared with controls (90.7 and 17.9 ms; p = 0.02 and p = 0.001; respectively) (Figs. 2 to 3 4 5). As indicated by the Kaplan-Meier curves displaying cumulative event-free survival, all BS patients with Tp-e values ≥100 ms or Tp-e dispersion values >20 ms had events during 60 months of follow-up. In contrast, only 30% of BS patients with Tp-e <100 ms or Tp-e dispersion ≤20 ms had events during 60 months of follow-up. The areas under the ROC curves for Tp-e and Tp-e dispersion were 0.788 and 0.772, respectively; indicating that these variables are relatively good discriminators of patients likely to develop life-threatening arrhythmic events.
Figure 2.

Kaplan-Meier analysis of arrhythmic events during follow-up depending on Tpeak-Tend interval (Tp-e) ≥100 ms or Tp-e <100 ms.
Figure 3.
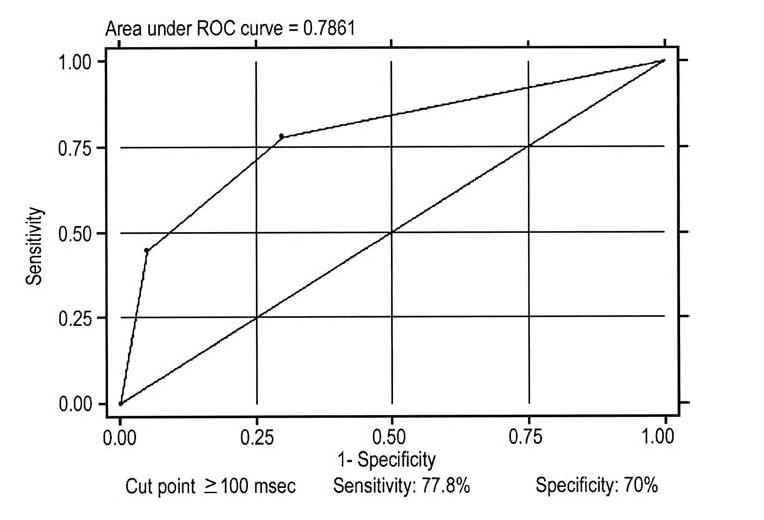
Tpeak-Tend interval (Tp-e) receiver-operating characteristic (ROC) curve. The cut point that better optimizes the values of sensibility and specificity are for values ≥100 ms.
Figure 4.

Kaplan-Meier analysis of arrhythmic events during follow-up depending on Tpeak-Tend interval (Tp-e) dispersion >20 ms or Tp-e dispersion ≤20 ms.
Figure 5.

Tpeak-Tend interval (Tp-e) dispersion receiver-operating characteristic (ROC) curve. The cut point that better optimizes the values of sensibility and specificity are for values >20 ms.
DISCUSSION
Transmural dispersion of the repolarization within the ventricular myocardium has been suggested to underlie arrhythmogenesis in Brugada, short QT, and long QT syndromes (11). Three electrophysiologically distinct cell types have been identified in the ventricular myocardium: endocardial, epicardial, and M cells. Differences in the time course of repolarization of these three ventricular myocardial cell types contribute prominently to inscription of the electrocardiographic T-wave (12). In isolated ventricular wedge preparations, the peak of the T-wave was shown to coincide with epicardial repolarization and the end of the T-wave with repolarization of the M cells, so that Tp-e provides a measure of transmural dispersion of repolarization (TDR) (13). These and other studies have suggested that although Tp-e on the surface ECG may not be absolutely equivalent to TDR, this interval may provide an index of TDR and thus be helpful in forecasting risk for the development of life-threatening arrhythmias (12,14-17). Evidence in support of this hypothesis has been provided under hypertrophic cardiomyopathy, congenital and acquired long QT, and other pathophysiologic conditions (12,14-18). To our knowledge, Tp-e has not been evaluated as a risk factor in patients with BS.
Because of the paucity of studies involving large populations, there is no clear consensus as to normal values for Tp-e. The present study examined this parameter in patients with the BS together with another parameter, Tp-e dispersion. While Tp-e provides an index of the maximum dispersion of repolarization, Tp-e dispersion reflects variation of the transmural dispersion of the repolarization among different regions of the ventricular myocardium. Our study demonstrates a significant correlation between Tp-e and Tp-e dispersion and occurrence of life-threatening arrhythmic events in patients with BS, suggesting that these parameters may be useful in risk stratification of patients with BS.
The Tp-e was 19.6% greater and Tp-e dispersion 53.7% greater in BS patients who experienced recurrences of VT/VF. Interestingly, these parameters were not significantly different between normal and BS patients without recurrences. The longest Tp-e was measured in lead V2 and was due to marked abbreviation of QTpeak interval in this lead. The latter is likely due to a briefer epicardial action potential (AP) in this region of the right ventricle (RV), which in turn may be due to the proximity of this region to that at which loss of the epicardial action potential dome occurs. Loss of the dome is evidenced by the appearance of ST-segment elevation as seen in lead V1, a manifestation of the development of transmural voltage gradients during the plateau of the action potential. It is noteworthy that lead V1 is associated with a negative T-wave, due to delayed repolarization of epicardium in regions of the RV outflow tract, where the action potential notch may be accentuated but the dome is not lost. Thus, the amplified Tp-e and Tp-e dispersion are a reflection of TDR secondary to loss of the AP dome in epicardium and the development of an epicardial dispersion of repolarization (19-23). The epicardial dispersion of repolarization is thought to give rise to phase 2 re-entry, which provides the closely coupled extrasystole that precipitates episodes of rapid polymorphic VT. The VT may be maintained initially by circus movement in the RV epicardium but is thought to be sustained by transmural reentry. The TDR provides the substrate that permits the intramural reentry.
It is well established that QTc in patients with BS is often prolonged in the right precordial leads but not in the left (24). This is due to the much more pronounced accentuation of the action potential notch in the RV than in the left ventricular (LV) epicardium. This results in a delayed second upstroke, leading to prolongation of the RV epicardial AP, inversion of the T-wave, and prolongation of QTc in the precordial leads facing this aspect of the heart. A more pronounced accentuation of the notch is expected to rise to a more negative T-wave and longer QT interval and TDR (due to later repolarization of RV epicardium vs. endocardium). Our data provide further validation of these concepts, demonstrating an association between prolongation of QTc in the right precordial leads, TDR, and risk for development of events.
Although an overlap between BS and long QT syndrome (LQTS) has been described with select mutations (25,26), it is important to recognize that the prolonged QTc in our study is not consistent with LQTS, because QTc is not generally prolonged in lead II or in any of the leads other than V1 to V3. The LQTS is generally regarded as an LV disease in which an exaggerated TDR in the LV free wall and/or septum provides the principal substrate for the development of torsades de pointes. In our BS patients, prolongation of QTc in the right precordial leads is associated with an increase in TDR in the RV. As with LQTS, we find that TDR rather than QTc is a better predictor of arrhythmogenic risk (27).
Assessment of previously asymptomatic BS patients for risk of sudden death on the basis of inducibility has met with considerable debate. Whereas Brugada et al. (28,29) have demonstrated PES induction of VT/VF as the most sensitive predictor of future events, a number of other investigators have failed to demonstrate a statistically significant correlation between inducibility and the development of a first event (3,30,31). Our results, although limited in number, support the conclusion of the latter group, suggesting that PES inducibility is not highly predictive of the occurrence of sudden cardiac death. Study limitations. A number of studies have reported poor inter- and intraobserver reproducibility of manual measurements of the QT intervals (32-34). This shortfall applies to the measurement of the Tp-e and Tp-e dispersion as well. In addition, there has been some confusion as to how to measure these parameters with different configurations of the T-wave. This has been clarified in recent experimental studies (15), and we applied these methods in our measurements. Another limitation of the study is the relatively small number of observations and limited follow-up period. Confirmation of these results would be desirable in a larger series.
Acknowledgement
The authors gratefully acknowledge Dr. Juan J. Lence for the statistical analyses.
Footnotes
- AP
- action potential
- BS
- Brugada syndrome
- ECG
- electrocardiogram
- ICD
- implantable cardioverter-defibrillator
- LQTS
- long QT syndrome
- PES
- programmed electrical stimulation
- ROC
- receiver-operating characteristic
- TDR
- transmural dispersion of repolarization
- Tp-e
- Tpeak-Tend interval
- VF
- ventricular fibrillation
- VT
- ventricular tachycardia
REFERENCES
- 1.Brugada P, Brugada J. Right bundle branch block, persistent ST segment elevation and sudden cardiac death: a distinct clinical and electrocardiographic syndrome: a multicenter report. J Am Coll Cardiol. 1992;20:1391–6. doi: 10.1016/0735-1097(92)90253-j. [DOI] [PubMed] [Google Scholar]
- 2.Priori SG, Napolitano C, Gasparini M, et al. Clinical and genetic heterogeneity of right bundle branch block and ST-segment elevation syndrome: a prospective evaluation of 52 families. Circulation. 2000;102:2509–15. doi: 10.1161/01.cir.102.20.2509. [DOI] [PubMed] [Google Scholar]
- 3.Eckardt L, Probst V, Smits JP, et al. Long-term prognosis of individuals with right precordial ST-segment-elevation Brugada syndrome. Circulation. 2005;111:257–63. doi: 10.1161/01.CIR.0000153267.21278.8D. [DOI] [PubMed] [Google Scholar]
- 4.Brugada J, Brugada R, Brugada P. Determinants of sudden cardiac death in individuals with the electrocardiographic pattern of Brugada syndrome and no previous cardiac arrest. Circulation. 2003;108:3092–6. doi: 10.1161/01.CIR.0000104568.13957.4F. [DOI] [PubMed] [Google Scholar]
- 5.Antzelevitch C, Brugada P, Borggrefe M, et al. Brugada syndrome. Report of the Second Consensus Conference. Endorsed by the Heart Rhythm Society and the European Heart Rhythm Association. Circulation. 2005;111:659–70. doi: 10.1161/01.CIR.0000152479.54298.51. [DOI] [PubMed] [Google Scholar]
- 6.Wilde AA, Antzelevitch C, Borggrefe M, et al. Proposed diagnostic criteria for the Brugada syndrome: consensus report. Circulation. 2002;106:2514–9. doi: 10.1161/01.cir.0000034169.45752.4a. [DOI] [PubMed] [Google Scholar]
- 7.Bazett HC. An analysis of the time-relations of electrocardiograms. Heart J. 1920;7:353–70. [Google Scholar]
- 8.Perkiomaki JS, Koistinen MJ, Mayry S, Huikuri HV. Dispersion of QT interval in patients with and without susceptibility to ventricular tachyarrhythmias after previous myocardial infarction. J Am Coll Cardiol. 1995;26:174–9. doi: 10.1016/0735-1097(95)00122-g. [DOI] [PubMed] [Google Scholar]
- 9.Day CP, McComb JM, Campbell RW. QT dispersion: an indication of arrhythmia risk in patients with long QT intervals. Br Heart J. 1990;63:342–4. doi: 10.1136/hrt.63.6.342. [DOI] [PMC free article] [PubMed] [Google Scholar]
- 10.Hanley JA, McNeil BJ. The meaning and use of the area under a receiver operating characteristic (ROC) curve. Radiology. 1982;143:29–36. doi: 10.1148/radiology.143.1.7063747. [DOI] [PubMed] [Google Scholar]
- 11.Antzelevitch C. Tpeak-Tend interval as an index of transmural dispersion of repolarization. Eur J Clin Invest. 2001;31:555–7. doi: 10.1046/j.1365-2362.2001.00849.x. [DOI] [PubMed] [Google Scholar]
- 12.Yan GX, Antzelevitch C. Cellular basis for the normal T wave and the electrocardiographic manifestations of the long QT syndrome. Circulation. 1998;98:1928–36. doi: 10.1161/01.cir.98.18.1928. [DOI] [PubMed] [Google Scholar]
- 13.Fish JM, Di Diego JM, Nesterenko VV, Antzelevitch C. Epicardial activation of left ventricular wall prolongs QT interval and transmural dispersion of repolarization: implications for biventricular pacing. Circulation. 2004;109:2136–42. doi: 10.1161/01.CIR.0000127423.75608.A4. [DOI] [PubMed] [Google Scholar]
- 14.Antzelevitch C, Shimizu W, Yan GX, et al. The M cell: its contribution to the ECG and to normal and abnormal electrical function of the heart. J Cardiovasc Electrophysiol. 1999;10:1124–52. doi: 10.1111/j.1540-8167.1999.tb00287.x. [DOI] [PubMed] [Google Scholar]
- 15.Emori T, Antzelevitch C. Cellular basis for complex T waves and arrhythmic activity following combined I(Kr) and I(Ks) block. J Cardiovasc Electrophysiol. 2001;12:1369–78. doi: 10.1046/j.1540-8167.2001.01369.x. [DOI] [PubMed] [Google Scholar]
- 16.Watanabe N, Kobayashi Y, Tanno K, et al. Transmural dispersion of repolarization and ventricular tachyarrhythmias. J Electrocardiol. 2004;37:191–200. doi: 10.1016/j.jelectrocard.2004.02.002. [DOI] [PubMed] [Google Scholar]
- 17.Milberg P, Reinsch N, Wasmer K, et al. Transmural dispersion of repolarization as a key factor of arrhythmogenicity in a novel intact heart model of LQT3. Cardiovasc Res. 2005;65:397–404. doi: 10.1016/j.cardiores.2004.10.016. [DOI] [PubMed] [Google Scholar]
- 18.Shimizu M, Ino H, Okeie K, et al. T-peak to T-end interval may be a better predictor of high-risk patients with hypertrophic cardiomyopathy associated with a cardiac troponin I mutation than QT dispersion. Clin Cardiol. 2002;25:335–9. doi: 10.1002/clc.4950250706. [DOI] [PMC free article] [PubMed] [Google Scholar]
- 19.Antzelevitch C. The Brugada syndrome: diagnostic criteria and cellular mechanisms. Eur Heart J. 2001;22:356–63. doi: 10.1053/euhj.2000.2461. [DOI] [PubMed] [Google Scholar]
- 20.Antzelevitch C, Brugada P, Brugada J, Brugada R. The Brugada syndrome. From cell to bedside. Curr Probl Cardiol. 2005;30:9–54. doi: 10.1016/j.cpcardiol.2004.04.005. [DOI] [PMC free article] [PubMed] [Google Scholar]
- 21.Antzelevitch C, Brugada P, Brugada J, et al. Brugada syndrome. A decade of progress. Circ Res. 2002;91:1114–9. doi: 10.1161/01.res.0000046046.53721.90. [DOI] [PubMed] [Google Scholar]
- 22.Antzelevitch C, Brugada P, Brugada J, Brugada R, Towbin JA, Nademanee K. Brugada syndrome: 1992-2002. A historical perspective. J Am Coll Cardiol. 2003;41:1665–71. doi: 10.1016/s0735-1097(03)00310-3. [DOI] [PubMed] [Google Scholar]
- 23.Fish JM, Antzelevitch C. Role of sodium and calcium channel block in unmasking the Brugada syndrome. Heart Rhythm. 2004;1:210–7. doi: 10.1016/j.hrthm.2004.03.061. [DOI] [PMC free article] [PubMed] [Google Scholar]
- 24.Pitzalis MV, Anaclerio M, Iacoviello M, et al. QT-interval prolongation in right precordial leads: an additional electrocardiographic hallmark of Brugada syndrome. J Am Coll Cardiol. 2003;42:1632–7. doi: 10.1016/j.jacc.2003.07.005. [DOI] [PubMed] [Google Scholar]
- 25.Bezzina C, Veldkamp MW, van Den Berg MP, et al. A single Na(+) channel mutation causing both long-QT and Brugada syndromes. Circ Res. 1999;85:1206–13. doi: 10.1161/01.res.85.12.1206. [DOI] [PubMed] [Google Scholar]
- 26.Grant AO, Carboni MP, Neplioueva V, et al. Long QT syndrome, Brugada syndrome, and conduction system disease are linked to a single sodium channel mutation. J Clin Invest. 2002;110:1201–9. doi: 10.1172/JCI15570. [DOI] [PMC free article] [PubMed] [Google Scholar]
- 27.Antzelevitch C. Modulation of transmural repolarization. Ann N Y Acad Sci. 2005;1047:314–23. doi: 10.1196/annals.1341.028. [DOI] [PMC free article] [PubMed] [Google Scholar]
- 28.Brugada J, Brugada R, Antzelevitch C, Towbin J, Nademanee K, Brugada P. Long-term follow-up of individuals with the electrocardiographic pattern of right bundle-branch block and ST-segment elevation in precordial leads V(1) to V(3) Circulation. 2002;105:73–8. doi: 10.1161/hc0102.101354. [DOI] [PubMed] [Google Scholar]
- 29.Brugada P, Brugada R, Brugada J. Should patients with an asymptomatic Brugada electrocardiogram undergo pharmacological and electrophysiological testing. Circulation. 2005;112:279–92. doi: 10.1161/CIRCULATIONAHA.104.485326. [DOI] [PubMed] [Google Scholar]
- 30.Priori SG, Napolitano C, Gasparini M, et al. Natural history of Brugada syndrome: insights for risk stratification and management. Circulation. 2002;105:1342–7. doi: 10.1161/hc1102.105288. [DOI] [PubMed] [Google Scholar]
- 31.Priori SG, Napolitano C. Should patients with an asymptomatic Brugada electrocardiogram undergo pharmacological and electrophysiological testing. Circulation. 2005;112:279–92. [PubMed] [Google Scholar]
- 32.MacFarland PW. Measurement of QT dispersion. Heart. 1998;80:421–3. doi: 10.1136/hrt.80.5.421. [DOI] [PMC free article] [PubMed] [Google Scholar]
- 33.Coumel P, Maison-Blanche P, Badilini F. Dispersion of ventricular repolarization. Reality? Illusion? Significance. Circulation. 1998;97:2491–3. doi: 10.1161/01.cir.97.25.2491. [DOI] [PubMed] [Google Scholar]
- 34.Kautzner J, Yi G, Camm AJ, Malik M. Short- and long-term reproducibility of QT, QTc, and QT dispersion measurement in healthy subjects. Pacing Clin Electrophysiol. 1994;17:928–37. doi: 10.1111/j.1540-8159.1994.tb01435.x. [DOI] [PubMed] [Google Scholar]