

Abstract
Prader–Willi syndrome (PWS) is a complex neurodevelopmental disorder characterized by hypotonia, suck and feeding difficulties, hypogonadism, small hands and feet, developmental delay, hyperphagia and early childhood obesity and a particular facial appearance. The obesity associated with PWS is the result of a chronic imbalance between energy intake and energy expenditure (EE) due to hyperphagia, decreased physical activity, reduced metabolic rate and an inability to vomit. EE is affected by body composition as well as exercise. Individuals with PWS have a lower lean body mass (LBM) compared with controls which may contribute to reduced basal level EE. To determine the relationship among body composition, activity levels and metabolic rates, dual energy X-ray absorptiometry (DEXA) and a whole-room respiration chamber were used to measure body composition, total EE (TEE), resting EE (REE), physical activity, and mechanical work (MW) during an 8 hr monitoring period. The chamber consisted of a live-in whole-room indirect calorimeter equipped with a force platform floor to allow simultaneous measurement of EE, physical activity, and work efficiency during spontaneous activities and standardized exercise. Participants with PWS (27 with 15q11–q13 deletion and 21 with maternal disomy 15 with an average age of 23 years) had significantly decreased TEE by 20% and reduced LBM compared to 24 obese subjects. Similarly, REE was significantly reduced by 16% in the individuals with PWS relative to the comparison subjects. Total MW performed during the 8 hr monitoring period was significantly reduced by 35% in the PWS group. The energy cost of physical activity is related to the duration, intensity and type of activity and the metabolic efficiency of the individual. After adjusting group differences in LBM by analysis of variance, TEE and REE were no longer different between the two groups. Our data indicate that there is a significant reduction of EE in individuals with PWS resulting from reduced activity but also from lower energy utilization due to reduced LBM which consists primarily of muscle.
Keywords: Prader–Willi syndrome (PWS), obesity, whole-room respiration chamber, total and resting energy expenditure, mechanical work, lean body mass
INTRODUCTION
Prader–Willi syndrome (PWS) is a complex neurodevelopmental disorder characterized by minor facial anomalies, small hands and feet, short stature, poor suck and feeding difficulties, hypotonia, hyperphagia and early childhood obesity [Cassidy, 1984; Butler et al., 1986; Butler, 1990; Holm et al., 1993; Cassidy, 1997; Butler and Thompson, 2000; Bittel and Butler, 2005]. PWS results from a de novo paternal deletion of chromosome 15q11–q13 region in approximately 70% of cases, uniparental maternal disomy 15 (UPD) in about 25% and a disruption of the imprinting center or chromosome 15 rearrangements in the remaining individuals.
PWS is considered the most common known genetic cause of marked obesity in humans [Butler, 1990]. The obesity in PWS is the result of a chronic imbalance between energy intake and energy expenditure (EE) due to hyperphagia, decreased physical activity, a reduced metabolic rate, and an inability to vomit. Body fat in individuals with PWS can account for 40–50% of their body composition, which is two or three times higher than in the general population [Butler et al., 2001]. In fact, about one-third of individuals with PWS weigh more than 200% of their ideal body weight [Schoeller et al., 1988; Meaney and Butler, 1989a] and, without intervention, significant morbidity and mortality may occur from the complications of obesity.
The average height for individuals with PWS is 155 cm for adult males and 147 cm for adult females if not previously treated with growth hormone [Butler and Meaney, 1991]. Individuals with PWS can weigh 250–300 lbs by the late teenage years if food intake is not controlled. Health problems seen in PWS include cor pulmonale and heart failure, hypertension, thrombophlebitis and chronic leg edema, orthopedic problems (e.g., slipped capital femoral epiphyses and scoliosis), abnormal lipid profiles, and type 2 diabetes mellitus (seen in 25–30% of adults who become morbidly obese) [Butler, 1990]. Obesity related problems include obstructive sleep apnea and narrowing of the airway, osteoporosis and pathologic fractures, reduced physical activity, impaired respiratory function and hypoventilation, hypercapnia, hypertension, specific endocrine disturbances, risks from general anesthesia and hypometabolism. These problems arise as weight increases and, with calorie restrictions, diabetes mellitus can be controlled and the health related problems diminish.
The heaviest deposition of subcutaneous fat in individuals with PWS is allocated in the trunk and limb regions [Meaney and Butler, 1989b] with presentation in a sex reversed fatness pattern (i.e., PWS males have more fat than PWS females). Individuals with PWS also have a lower lean body mass (LBM) compared with obese subjects which may contribute to reduced basal level EE. Although the abnormal eating behaviors and excessive energy intake are well documented [Thompson et al., 1996], there is limited information available regarding EE in individuals with PWS. It is essential to understand the cause of obesity in PWS in order to determine practical treatment options.
Previous studies have attempted to measure EE in individuals with PWS [Widhalm et al., 1981; Schoeller et al., 1988; Hill et al., 1990; Bekx et al., 2003]; however, simultaneous measurements of factors contributing to EE (e.g., body composition, activity levels, caloric intake, and metabolic rates) are limited. We have therefore set out to determine EE in a relatively large cohort of individuals with PWS and nondysmorphic individuals with simple obesity at various ages (i.e., 10 years and older) by examining relationships among these factors. Body composition was measured with the use of dual energy X-ray absorptiometry (DEXA) and total EE (TEE), resting EE (REE), mechanical work (MW) and physical activity were monitored during an 8 hr period in a whole-room respiration chamber (Activity-Energy Measurement System [AEMS]) which simulates a normal home environment following the protocols reported by Chen et al. [1999].
MATERIALS AND METHODS
Subjects
The study comprised 48 individuals with PWS and 24 nonsyndromic individuals with simple obesity recruited from a genotype–phenotype study on PWS and examined by one of us (M.G.B.). This study was reviewed and approved by the local Institutional Review Board. Experimental protocols were explained to all participants and/or their legal guardians and informed consent and assent were obtained following approved guidelines. Of these subjects, 27 had a deletion of the 15q11–q13 region detected by fluorescence in situ hybridization using 15q11–q13 probes (e.g., SNRPN) and 21 individuals had UPD. Using polymorphic DNA microsatellites from the 15q11–q13 region and genomic DNA from the parents and individuals with PWS, the UPD status was identified by polymerase chain reaction (PCR). Furthermore, abnormal methylation testing with PCR analysis was consistent with the diagnosis in all individuals with PWS [Butler et al., 1996, 2002]. The overall male to female ratio in the PWS group was 21:27 and their age range was 10–45 years with a mean of 23 ± 9 years.
The PWS deletion group consisted of 11 males (10 Caucasian, 1 African-American) and 16 females (15 Caucasian, 1 African-American) with a mean age of 22 years while the PWS UPD group encompassed 10 males (9 Caucasian, 1 Hispanic) and 11 females (10 Caucasian, 1 Hispanic) with a mean age of 23 years. The obese group comprised 24 nonsyndromic individuals with simple obesity of unknown cause and consisted of 9 males (6 Caucasian and 3 African-American) and 15 females (12 Caucasian and 3 African-American). The age range of this group was 11–49 years and the mean age was 27 ± 13 years. None of the PWS or obese subjects was on growth or thyroid hormone treatment. Three of the 24 obese subjects and 8 of the 48 individuals with PWS (5 deletion and 3 UPD) had a history of diabetes mellitus, nonetheless only two obese subjects and five individuals with PWS were on insulin therapy in the past and fewer (1 obese and 3 PWS) were being treated with insulin at the time of study.
Height to the nearest 0.1 cm and weight to the nearest 0.1 kg were obtained at baseline for each subject in the clinical setting. Waist circumference was measured to the nearest 0.1 cm with a steel tape measure at the umbilicus level in standing position. Likewise, the hip circumference was obtained to the nearest 0.1 cm at the greater trochanter level. Body mass index (BMI) was calculated (kg/m2) for each subject and obesity was defined as BMI ≥30 for adults (≥18 years of age) and a BMI > 95th centile using published standards for sex for subjects less than 18 years old [Kuczmarski et al., 2000].
Body Composition Determination
Dual-energy X-ray photon absorptiometry (DEXA) is a scanning technique that accurately measures the differential attenuation of two X-rays that pass through the body distinguishing total body bone mineral content from soft tissue and subsequently dividing the latter into fat and lean tissue. The model DPX system from Lunar Corporation, Madison WI, was used to measure percent body fat, fat mass, fat-free mass, bone mineral density, and bone mineral content according to manufacturer’s protocols. Subjects were placed in supine position and the entire body was scanned from the top of the head down to the feet in a rectilinear manner. Measurements were made for four different regions (head, arms, trunk, and legs) and for the body as a whole.
Whole-Room Chamber Utilizing the Activity-Energy Measurement System (AEMS)
Figure 1 displays the whole-room respiration chamber design of the AEMS which is equipped with a fold-down bed, desk, chair, telephone, audio system, TV/VCR, computer with internet access, exercise equipment including a stationary exercise bicycle, toilet and sink. The AEMS is an environmental room (dimensions of 2.6 × 3.4 m and 19,500 L in net volume) containing a large force platform floor system [Sun and Hill, 1993]. Temperature inside the room was strictly controlled (22.5 ± 0.2°C) and oxygen consumption (VO2), carbon-dioxide production (VCO2), air flow rate, temperature (inside and ambient), barometric pressure, and humidity were sampled 60 times/sec and integrated at the end of each minute to calculate EE [Ravussin et al., 1986]. The respiratory quotient (RQ) or the volume of CO2 to the volume of O2 consumption (VCO2/VO2) was used to calculate resting metabolic rate [Weir, 1949] which equates to REE. The homogeneity of the air in the room was ensured by a special multi-channel air sampling system composed of oxygen (Magnos 4G) and carbon dioxide (Uras 3G) analyzers [Sun et al., 1994]. This system was incorporated to the room and calibrated with reference gas before each test and with mixtures of pure gases by a precision mixing pump on a regular basis. The burning of pure propane or ethyl alcohol at a variable rate inside the room frequently validated the accuracy of the calorimeter [Sun et al., 1994]. The system error of the AEMS was no more than 1% for 24-hr recordings, determined by comparing the EE measured by the calorimetry system and EE calculated from the rate of combustion [Sun et al., 1994]. Rates of fat, carbohydrate, and protein oxidation were calculated from the gas exchange data and measurements of urinary nitrogen excretion, as described in detail previously [Chen et al., 1998, 1999].
FIG. 1.
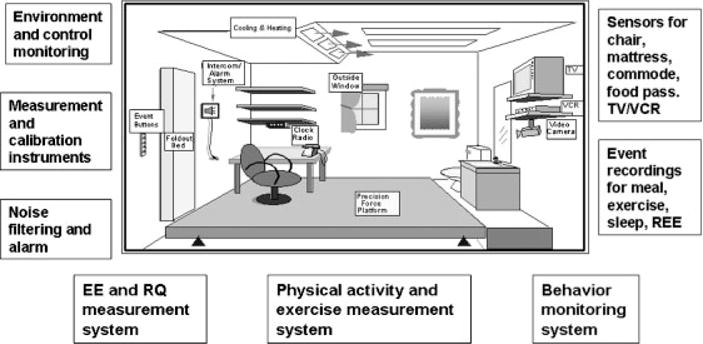
Schematic representation of a whole-room indirect calorimeter with an activity energy measurement system (AEMS) in place.
The force platform covering the entire living area inside the whole-room indirect calorimeter measured 2.5 × 2.5 m2 and was supported by multiple precision force transducers, thus allowing computer-aided measurements (60 times/sec) of body position, displacement, and mechanical forces with an accuracy of 97% or higher [Sun and Hill, 1993]. Sensors that detect physical activity within the calorimetric chamber are present inside the TV/VCR, underneath the sleeping mattress, inside the chair, and at the airlock door where the participant received food for recording purposes. The subject could also make use of eight additional event buttons to signal periods of sleeping, eating, and exercising. The force platform combined with the sensors and event buttons determined the nature, duration, and frequency of physical activities at each minute. Due to the inability of some participants to operate the event button system, members of the observing staff kept activity records in the anteroom outside of the AEMS during the entire study period, monitoring the participant’s behavior through a glass window, communicating directly with the participant through an intercom, and instructing with encouragement the participant to perform certain tasks such as standardized exercises. Furthermore, members of the nursing staff monitored study participants through a VHS video camera placed inside the room in order to ensure the safety of subjects with special needs.
Measurements of EE and Its Components as Well as Physical Activity by AEMS
For the 2 days prior to entering the chamber, all subjects were monitored closely and followed a weight-maintaining diet which was calculated to approximate each subject’s habitual diet according to 3–5 days of food records kept by their caregivers. This was done in order to eliminate confounding effects on substrate oxidation from the subjects being under or overfed. The participants entered the chamber at 7:00 a.m. and remained inside till 3:00 p.m. at the latest. The meals served to each participant during the time in the whole-room chamber and 2 days of close supervision (at least 1 day was a weekend) before the chamber stay maintained the pattern in calories and macronutrient composition (i.e., fat, protein, and carbohydrate) established from the 3- to 5-day food diaries recorded by the participants’ caregivers. A research dietitian determined the energy intake and macronutrient composition of the diet from the 3- to 5-day food records and from pre-chamber meal recordings and chamber food record data for each participant using the software Nutritionist III from First Data-bank (The Hearst Corporation, San Bruno, CA). During the initial 30 min after the participant had just entered the room after an overnight sleep and fast, REE was measured while the subject was in supine position with minimal body movement. Any periods of body motion detected by the force platform were automatically removed from the REE analysis.
The average EE during which the subject sat in the monitored chair without significant body motion was entitled EE during sitting (EESIT). These periods were detected via the sensors in the chair and through the participant’s center of gravity on the force platform. EE during physical activity (EEACT) was defined by the energy expended during the periods when the participants were instructed and encouraged to do exercises such as walking or biking while in the chamber. The duration and intensity of physical activity varied among participants. EE during spontaneous physical activity (SPA) was the increase in EE above the REE during body movements such as walking or other spontaneous physical activities and was calculated by subtracting REE from the TEE. The start and end points of each activity were denoted by sudden change in MW measured by the force platform. Finally, TEE was determined by summing the EE of each minute over the entire study period during which the participant stayed in the chamber (AEMS).
Quantitative measures of external MW performed during various physical activities can be accessed by the force platform’s ability to precisely determine variation in a participant’s physical movement. The force platform can measure distance and speed in which the subject travels inside the room [Sun and Hill, 1993]. MW was obtained by calculating force, acceleration in x-, y-, and z-axes (time derivative from speed), and body mass. These measurements include both horizontal and vertical MW components. Horizontal work (HMW) is produced when the body’s center of gravity moves horizontally (e.g., walking). Vertical work (VMW) refers to posture changes (e.g., sitting to standing). The rate of MW performed with the associated EEACT was used to calculate net efficiency [Sun and Hill, 1993; Sun et al., 1994]. Hence, net efficiency of different types of physical activity and exercise could be determined by using the combination of the whole-room indirect calorimeter and the force platform. An example of recordings of the variables and planned activities during the study period mentioned above can be seen in Figure 2.
FIG. 2.
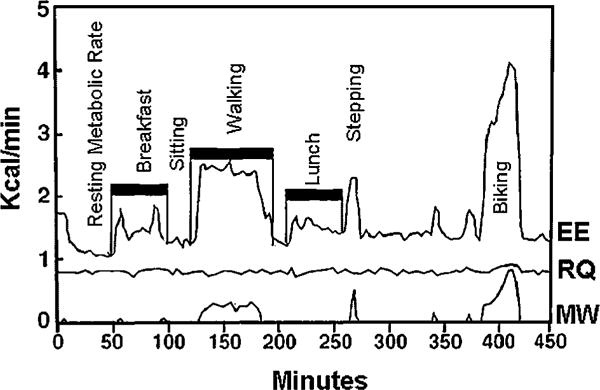
Representative example of energy expenditure (EE), respiratory quotient (RQ), and mechanical work (MW) of an individual with Prader–Willi syndrome. Data collected using the activity energy measurement system (AEMS).
Statistical Analysis
Data generated in this experiment were analyzed by a univariate general linear model (ANOVA) correcting for age and gender between PWS and obese subjects and Pearson product moment correlation coefficients were calculated for body composition and EE variables. Differences between males and females between each group were also analyzed with univariate general linear model correcting for age. Between group comparisons, adjusting for LBM, fat mass, total body weight and dietary fat intake (which was similar to the fat intake of the 2 days before entering the chamber; see Table IV) during the whole-room chamber stay, were carried out with the use of a univariate general linear model in order to see if these factors were possible contributors to the differences seen in EE and fat oxidation between PWS and obese individuals. Statistical significance was set at the 5% level for all tests. The results are presented as mean ± SD. Statistical analyses were performed using SPSS version 12.0 for Windows (SPSS Inc., Chicago, IL).
TABLE IV.
Energy Intake and Substrate Composition Data for Individuals With Prader–Willi Syndrome (PWS) and Obesity While in the Whole-Room Respiration Chamber and During the Two Days Before the Chamber Stay
| Variables | PWS (N = 30)
|
Obese (N = 17)
|
||||||
|---|---|---|---|---|---|---|---|---|
| Chamber
|
Pre-chamber
|
Chamber
|
Pre-chamber
|
|||||
| Mean ± SD | Range | Mean ± SD | Range | Mean ± SD | Range | Mean ± SD | Range | |
| Energy intake (kcal) | 1333 ± 402 | 471–2043 | 1196 ± 728 | 190–3213 | 1531 ± 472 | 666–2355 | 1458 ± 1017 | 447–4873 |
| % Fat | 24 ± 9 | 3–37 | 27 ± 9 | 7–43 | 30 ± 10 | 14–53 | 33 ± 12 | 11–66 |
| % Carbohydrate | 58 ± 10** | 41–84 | 53 ± 8** | 36–75 | 53 ± 9 | 32–66 | 50 ± 12 | 24–78 |
| % Protein | 18 ± 5 | 9–30 | 20 ± 6 | 8–39 | 17 ± 5 | 10–25 | 17 ± 6 | 8–40 |
P < 0.05, Student’s t-test between chamber and pre-chamber data for each group.
P < 0.01, Student’s t-test between chamber and pre-chamber data for each group.
P < 0.001, Student’s t-test between chamber and pre-chamber data for each group.
RESULTS
We analyzed EE measures (including average EE, REE, and EEact) as well as substrate oxidation variables (fat, carbohydrate, and protein) with the student’s t-test to identify differences between participants ≤13 years old (7 of 48 PWS subjects and 5 of 24 obese subjects) and those older than 13 years in both the PWS and obese groups. No significant differences were seen for these variables between the two age groups (≤13 years or >13 years) for PWS or obese subjects (data not included). Nevertheless, we did adjust by age in the statistical analyses.
As seen in Table I, significant differences between individuals with PWS and obesity can be found with decreased height (150±8 vs. 162±9 cm, P<0.001), weight (78±22 vs. 108±25 kg, P < 0.001), and BMI (34±9 vs. 41±8 kg/m2, P < 0.01) in PWS compared to the obese group. As for body composition, fat mass (39±14 vs. 50±14 kg, P < 0.01) and LBM (35±7 vs. 51±12 kg, P < 0.001) presented with significant reductions in PWS when compared to the obese group.
TABLE I.
Demographic and Body Composition Measures for Individuals With Prader–Willi Syndrome (PWS) and Obesity
| Variables | PWS, mean ± SD
|
Obese, mean ± SD
|
||||
|---|---|---|---|---|---|---|
| Male (21) | Female (27) | Total (48) | Male (9) | Female (15) | Total (24) | |
| Age in years | 24 ± 9 | 22 ± 8 | 23 ± 9 | 22 ± 10 | 30 ± 14 | 27 ± 13 |
| Height (cm) | 153 ± 8§ | 148 ± 7§ | 150 ± 8*** | 168 ± 11§ | 159 ± 7§ | 162 ± 9*** |
| Weight (kg) | 82 ± 22‡ | 75 ± 22§ | 78 ± 22*** | 111 ± 24‡ | 107 ± 26§ | 108 ± 25*** |
| BMI (kg/m2) | 35 ± 9 | 34 ± 10† | 34 ± 9** | 39 ± 7 | 42 ± 9† | 41 ± 8** |
| DEXA % fat | 51 ± 7† | 51 ± 9 | 51 ± 8 | 45 ± 8† | 52 ± 5 | 50 ± 7 |
| DEXA fat mass (kg) | 41 ± 14 | 37 ± 15‡ | 39 ± 14** | 47 ± 13 | 52 ± 14‡ | 50 ± 14** |
| DEXA lean mass (kg) | 37 ± 7§ | 33 ± 7§ | 35 ± 7*** | 57 ± 14§ | 47 ± 9§ | 51 ± 12*** |
| Fat mass/lean mass | 1.09 ± 0.29† | 1.11 ± 0.34 | 1.10 ± 0.31* | 0.86 ± 0.26† | 1.11 ± 0.19 | 1.01 ± 0.25* |
P < 0.05, univariate ANOVA correcting for age and gender between PWS and obese.
P < 0.01, univariate ANOVA correcting for age and gender between PWS and obese.
P < 0.001, univariate ANOVA correcting for age and gender between PWS and obese.
P < 0.05, univariate ANOVA correcting for age between males in the two groups and between females in the two groups.
P < 0.01, univariate ANOVA correcting for age between males in the two groups and between females in the two groups.
P < 0.001, univariate ANOVA correcting for age between males in the two groups and between females in the two groups.
TEE over the duration of the chamber experiment was also significantly decreased in individuals with PWS by 20% when compared to obese subjects (788±151 vs. 991±236 kcal/8 hr, P < 0.001) (Table II). REE was significantly reduced by 16% in the PWS group relative to comparison subjects (1.44±0.25 vs. 1.71±0.33 kcal/min, P < 0.001) (Fig. 3). Energy expended during physical activity (EEact) over the duration of the respiration chamber experiment was reduced by 38% in the PWS group (1.92±0.61 vs. 3.08±0.99 kcal/min, P < 0.001). After adjusting for discrepancies in LBM between the two groups, TEE (P =0.453) and REE (P = 0.372) no longer differed between the two participant groups (PWS and obese). However, these variables remained significantly different between the two groups after correcting for fat mass (P < 0.001 for TEE and P < 0.01 for REE). When adjustments were made for total body weight (lean mass+fat mass) significant differences were eliminated between the two groups for REE (P=0.27). In addition, significant positive correlations were seen for both obese and PWS for lean mass and REE, SPA EE and REE, as well as lean mass and average EE. However, significant positive correlations were seen for only the PWS group for BMI and REE, lean mass and fat oxidation, and lean mass and average MW (see Figs. 4 and 5).
TABLE II.
Components of Energy Expenditure (EE) in Individuals With Prader–Willi Syndrome (PWS) and Obesity
| Variables | PWS, mean ± SD (number)
|
Obese, mean ± SD (number)
|
||||
|---|---|---|---|---|---|---|
| Male | Female | Total | Male | Female | Total | |
| Resting EE (kcal/min) | 1.53 ± 0.24 (21)‡ | 1.37 ± 0.23 (27)‡ | 1.44 ± 0.25 (48)*** | 1.90 ± 0.37 (9)‡ | 1.60 ± 0.26 (15)‡ | 1.71 ± 0.33 (24)*** |
| Sleeping EE (kcal/min) | 1.12 ± 0.17 (10)§ | 1.19 ± 0.26 (12) | 1.16 ± 0.22 (22)*** | 1.68 ± 0.23 (5)§ | 1.33 ± 0.28 (8) | 1.47 ± 0.31 (13)*** |
| Sitting EE (kcal/min) | 1.53 ± 0.28 (21)‡ | 1.37 ± 0.25 (27)§ | 1.44 ± 0.27 (48)*** | 1.97 ± 0.38 (9)‡ | 1.65 ± 0.31 (15)§ | 1.77 ± 0.36 (24)*** |
| Standing EE (kcal/min) | 1.63 ± 0.30 (21)‡ | 1.43 ± 0.21 (27)‡ | 1.52 ± 0.27 (48)*** | 2.01 ± 0.36 (9)‡ | 1.69 ± 0.34 (15)‡ | 1.81 ± 0.37 (24)*** |
| Sedentary EE (kcal/min) | 1.73 ± 0.34 (20)‡ | 1.55 ± 0.31 (27)‡ | 1.62 ± 0.33 (47)*** | 2.25 ± 0.51 (9)‡ | 1.83 ± 0.34 (15)‡ | 1.98 ± 0.45 (24)*** |
| Spontaneous physical activity EE (kcal/min) | 0.96 ± 0.37 (21)‡ | 0.78 ± 0.37 (27)‡ | 0.86 ± 0.37 (48)*** | 1.56 ± 0.69 (9)‡ | 1.10 ± 0.56 (15)‡ | 1.27 ± 0.64 (24)*** |
| Spontaneous physical activity (net efficiency %) | 7.17 ± 1.97 (21) | 7.52 ± 2.75 (26) | 7.36 ± 2.41 (47) | 8.18 ± 2.99 (9) | 7.79 ± 4.37 (15) | 7.94 ± 3.84 (24) |
| Energy expenditure during physical activity (kcal/min) | 1.96 ± 0.67 (19)‡ | 1.89 ± 0.56 (25)§ | 1.92 ± 0.61 (44)*** | 3.05 ± 0.95 (9)‡ | 3.10 ± 1.05 (13)§ | 3.08 ± 0.99 (22)*** |
| Exercising (net efficiency %) | 61 ± 20 (21) | 66 ± 16 (27)† | 64 ± 18 (48)* | 73 ± 15 (9) | 73 ± 17 (15)† | 73 ± 16 (24)* |
| Average EE (kcal/min) | 1.76 ± 0.34 (21)‡ | 1.55 ± 0.27 (27)§ | 1.64 ± 0.32 (48)*** | 2.35 ± 0.52 (9)‡ | 1.89 ± 0.40 (15)§ | 2.07 ± 0.49 (24)*** |
| Total EE (kcal/8 hr) | 844 ± 163 (21)‡ | 745 ± 128 (27)§ | 788 ± 151 (48)*** | 1128 ± 251 (9)‡ | 909 ± 191 (15)§ | 991 ± 236 (24)*** |
P < 0.05, univariate ANOVA correcting for age and gender between PWS and obese.
P < 0.01, univariate ANOVA correcting for age and gender between PWS and obese.
P < 0.001, univariate ANOVA correcting for age and gender between PWS and obese.
P < 0.05, univariate ANOVA correcting for age between males in the two groups and between females in the two groups.
P < 0.01, univariate ANOVA correcting for age between males in the two groups and between females in the two groups.
P < 0.001, univariate ANOVA correcting for age between males in the two groups and between females in the two groups.
FIG. 3.

Histogram showing resting energy expenditure (mean ± SD) for male and female subjects with Prader–Willi syndrome (PWS) or obesity. Resting energy expenditure is significantly different in PWS subjects compared to obese subjects (ANOVA; **P < 0.01, ***P < 0.001).
FIG. 4.

Scatterplots of (A) body mass index, (B) total lean mass, (C) and spontaneous physical activity energy expenditure correlated with resting energy expenditure in individuals with Prader–Willi syndrome (PWS) and obesity including Pearson correlation coefficients and significance.
FIG. 5.

Scatterplots of (A) average energy expenditure, (B) average mechanical work, and (C) fat oxidation correlated with total lean mass in individuals with Prader–Willi syndrome (PWS) and obesity including Pearson correlation coefficients and significance.
Total MW performed during the 8 hr monitoring period was significantly reduced by 35% in the individuals with PWS (30±13 vs. 46±34 W/8 hr, P < 0.001) (Table III). Likewise, vertical (0.04±0.02 vs. 0.06±0.05 W/min, P < 0.01) and horizontal (0.02±0.01 vs. 0.04±0.02 W/min, P<0.01) MW were reduced in individuals with PWS, possibly indicating more reduction in horizontal MW in PWS compared with vertical MW. SPA EE above REE was also lower by 32% in PWS subjects (0.86±0.37 kcal/min) compared to obese controls (1.27±0.64 cal/min). Another component of physical activity, displacement within the chamber, was reduced by 12% in PWS compared with obese subjects (51±16 vs. 58±24 m/8 hr, P<0.05).
TABLE III.
Components of Mechanical Work (MW) and Physical Activity in Individuals With Prader–Willi Syndrome (PWS) and Obesity
| Variables | PWS, mean ± SD (number)
|
Obese, mean ± SD (number)
|
||||
|---|---|---|---|---|---|---|
| Male | Female | Total | Male | Female | Total | |
| Displacement (m/8 hr) | 53 ± 15 (21)† | 49 ± 16 (27) | 51 ± 16 (48)* | 73 ± 28 (9)† | 50 ± 18 (15) | 58 ± 24 (24)* |
| Vertical MW (W/min) | 0.05 ± 0.03 (21)† | 0.04 ± 0.02 (26)† | 0.04 ± 0.02 (47)** | 0.09 ± 0.07 (9)† | 0.05 ± 0.03 (15)† | 0.06 ± 0.05 (24)** |
| Horizontal MW (W/min) | 0.03 ± 0.01 (19)† | 0.02 ± 0.01 (22) | 0.02 ± 0.01 (41)** | 0.05 ± 0.03 (9)‡ | 0.03 ± 0.01 (13) | 0.04 ± 0.02 (22)** |
| Total MW (W/8 hr) | 32 ± 15 (21)† | 27 ± 11 (26)‡ | 30 ± 13 (47)*** | 65 ± 48 (9)† | 36 ± 15 (15)‡ | 46 ± 34 (24)*** |
P < 0.05, univariate ANOVA correcting for age and gender between PWS and obese.
P < 0.01, univariate ANOVA correcting for age and gender between PWS and obese.
P < 0.001, univariate ANOVA correcting for age and gender between PWS and obese.
P < 0.05, univariate ANOVA correcting for age between males in the two groups and between females in the two groups.
P < 0.01, univariate ANOVA correcting for age between males in the two groups and between females in the two groups.
P < 0.001, univariate ANOVA correcting for age between males in the two groups and between females in the two groups.
Data regarding total energy intake and the percentage of each substrate consumed for the 2 days before the chamber stay and while the participants were in the chamber can be found in Table IV. Significant differences were found but only for percent carbohydrate in the PWS group between the 2-day recordings before the chamber stay and the time while subjects were in the chamber.
Furthermore, based on whole-room chamber data, fat oxidation or the breakdown of fat as the source of energy from the diet for cellular metabolism and thermogenesis was significantly lower by 37% in the PWS group compared with the obese groups (24 =14 vs. 38 =19 g/8 hr, P < 0.01) (Table V). Fat oxidation was still significantly different after correcting for dietary fat intake (P < 0.01) measured in meals consumed during the approximate 8 hr study period in the chamber and for fat mass (P < 0.05). However, this significance was lost once corrections were made for LBM (P=0.914) and total body weight (P=0.232) using univariate analysis of variance. Although lower in individuals with PWS, no significant differences were observed in carbohydrate or protein oxidation from dietary intake during the 8 hr study period.
TABLE V.
Substrate Oxidation Data for Individuals With Prader–Willi Syndrome (PWS) and Obesity While in the Whole-Room Respiration Chamber
| Variables | PWS, mean ± SD (number)
|
Obese, mean ± SD (number)
|
||||
|---|---|---|---|---|---|---|
| Male | Female | Total | Male | Female | Total | |
| Carbohydrate oxidation (g/8 hr) | 144 ± 36 (13) | 117 ± 35 (17) | 129 ± 38 (30) | 169 ± 44 (5) | 129 ± 47 (12) | 141 ± 49 (17) |
| Fat oxidation (g/8 hr) | 26 ± 12 (13)† | 23 ± 16 (17)† | 24 ± 14 (30)** | 40 ± 14 (5)† | 37 ± 21 (12)† | 38 ± 19 (17)** |
| Protein oxidation (g/8 hr) | 21 ± 8 (13) | 23 ± 11 (17) | 22 ± 10 (30) | 27 ± 13 (5) | 19 ± 7 (12) | 21 ± 9 (17) |
P < 0.05, univariate ANOVA correcting for age and gender between PWS and obese.
P < 0.01, univariate ANOVA correcting for age and gender between PWS and obese.
P < 0.001, univariate ANOVA correcting for age and gender between PWS and obese.
P < 0.05, univariate ANOVA correcting for age between males in the two groups and between females in the two groups.
P < 0.01, univariate ANOVA correcting for age between males in the two groups and between females in the two groups.
P < 0.001, univariate ANOVA correcting for age between males in the two groups and between females in the two groups.
DISCUSSION
Past studies have attempted to measure EE in individuals with PWS; however, most of them have not analyzed the components of EE (body composition, physical activity, and metabolic rate) simultaneously in a relatively large cohort of subjects. In a study by Schoeller et al. [1988], individuals with PWS presented with a 47% lower total daily EE when compared to obese controls, but this discrepancy was lessened to 14% once corrections were made for differences in LBM between the two groups. This study, however, did not assess physical activity levels in the two groups. Another study with an abbreviated stay in a whole-room calorimeter also showed that daily EE was lower in individuals with PWS compared to obese controls; however, it provided no information on differences in body composition (e.g., FFM) between the two groups [Widhalm et al., 1981]. A third study reported that children with PWS are less physically active during play compared to normal children [Nelson et al., 1981], but once again the other components of EE were not analyzed. However, in a separate study on resting metabolic rate or EE and body composition, a reduced fat free mass was not the sole explanation for lower EE seen in individuals with PWS compared with lean and obese subjects [Hill et al., 1990].
TEE is affected by body composition, physical activity, and metabolic rate. As seen in Table I, individuals with PWS presented with significantly reduced LBM compared to obese individuals. LBM, which consists primarily of muscle, is the major metabolically active tissue of the body and it accounts for most of the EE in humans. For example, fat tissue in the general population accounts for about 15–25% body composition, but only 2–5% of metabolism [Owen, 1988]. Therefore, decreased LBM and higher fat to lean mass ratios in subjects with PWS should be considered important factors contributing to the significantly lower levels of EE seen in individuals with PWS.
Another possible contributing factor for lower EE levels in PWS is physical inactivity seen in this participant group. Approximately 20–40% of EE is spent during physical activity, 10–15% on thermic effects of food, and approximately 60% on REE in the general population [Abbott et al., 1990]. The energy cost of physical activity is related to the duration, intensity, and type of activity (e.g., walking, biking, spontaneous movements) and the EE efficiency of the individual during a given activity. In an average person, exercise induced thermogenisis increases EE by approximately 25% over REE; however, the EE varies widely and is voluntarily controlled by the subject [Jequier and Shutz, 1983]. Individuals with PWS have muscle hypotonia which, along with lack of coordination may favor sedentary lifestyles reported in PWS. According to our studies, EE efficiency during exercise was significantly reduced in individuals with PWS compared to obese individuals and accordingly, MW performed and displacement. Individuals with PWS were also significantly less active (e.g., decreased spontaneous movements or displacement) than obese subjects. In addition, the REE was also significantly reduced in PWS. Since they are less physically active, have lower metabolic rates and decreased muscle mass, individuals with PWS expend less of their energy intake than obese subjects, therefore more energy is stored as fat. However, after adjusting REE for LBM, the REE measures between the two subject groups are comparable indicating that muscle in individuals with PWS is metabolically equal to muscle of obese individuals. However, obese individuals have greater muscle or LBM than PWS individuals. Therefore, the lower quantity of muscle tissue in PWS subjects appears to account for the EE differences seen between PWS and obese subjects rather than muscle quality. Reportedly, the amount of muscle mass increases with growth hormone treatment during childhood and possibly in adults with PWS [Hoybye, 2003; Carrel et al., 2004]. Increasing LBM in individuals with PWS would likely increase EE and physical activity as well as lessen obesity while on growth hormone replacement in children and adults with PWS [Hoybye, 2003; Carrel et al., 2004]. Further studies are needed to determine the beneficial long-term effects from growth hormone therapy in PWS and its impact, if any, on EE.
Finally, in order for obesity to develop, the rate of triglyceride (fat) synthesis and storage has to exceed that of fat mobilization and utilization. Schwartz et al. [1981] reported an increase in adipose tissue lipo-protein lipase activity in individuals with PWS which could be responsible for an increase in efficiency of triglyceride storage in these individuals. Another indication that excessive fat accumulation and abnormal fat patterning in PWS may result from defects in fat metabolism or nutrient partitioning is the atypical fatty acid composition of adipose tissue triglyceride reported in individuals with PWS when compared to obese subjects [Johnsen et al., 1967; Kimbrough et al., 1976]. Furthermore, Goldstone et al. [2001] reported that reduced visceral adiposity in adult females with PWS compared with obese control women could impact on fat storage and lipolysis in this syndrome. Reduced visceral fat in PWS may also reflect hormone imbalance including higher adiponectin levels, hypothalamic dysfunction, and genetic influences on body fat distribution [Talebizadeh and Butler, 2005; Kennedy et al., 2006].
Furthermore, significant differences in fat oxidation existed between the PWS and obese groups, being lower in the PWS group. The statistical analysis outcomes were also influenced by corrections made for LBM, but not by corrections in dietary fat intake or fat mass between the groups. Hence, fat oxidation appears to be independent of fat intake differences in diet and fat mass between the two participant groups. Although lower in individuals with PWS, no significant differences were observed in carbohydrate or protein oxidation.
Total MW for the duration of the 8-hr measurement period was reduced by 35% in the PWS group. When broken down into vertical and horizontal work, it can be seen that PWS performed in general about half of the horizontal work and two-thirds of the vertical work done by obese individuals during the same study period. The fact that the obese group generated more spontaneous movement and displacement while in the chamber and participated in more exercising sessions with more intensity can account for this difference in MW.
In summary, our study indicated that EE was lower in PWS and that all three components (body composition, physical activity, and metabolic rate) contribute to this finding since they are altered or significantly reduced in PWS compared with obese individuals. Fat oxidation and TEE were also reduced in PWS and may be due to the lesser amount of LBM in PWS.
Acknowledgments
We acknowledge Dr. Michael Carlson, Dr. Kong Chen, and Dr. Irene Feurer as well as Elizabeth Roof and Michelle Sanders for data collection and analysis and the subject participants. Partial funding support provided by National Institute of Child Health and Human Development (PO1HD30329); Children’s Mercy Hospital Physician Scientist Award (GL01.4871) and Hall Family Foundation (GL01.3905).
Grant sponsor: National Institute of Child Health and Human Development; Grant number: PO1HD30329; Grant sponsor: Children’s Mercy Hospital Physician Scientist Award; Grant number: GL01.4871; Grant sponsor: Hall Family Foundation; Grant number: GL01.3905.
References
- Abbott WG, Howard BV, Ruotolo G, Ravussin E. Energy expenditure in humans: Effects of dietary fat and carbohydrate. Am J Physiol. 1990;258:E347–E351. doi: 10.1152/ajpendo.1990.258.2.E347. [DOI] [PubMed] [Google Scholar]
- Bekx MT, Carrel AL, Shriver TC, Li Z, Allen DB. Decreased EE is caused by abnormal body composition in infants with Prader-Willi Syndrome. J Pediatr. 2003;143:372–376. doi: 10.1067/S0022-3476(03)00386-X. [DOI] [PubMed] [Google Scholar]
- Bittel DC, Butler MG. Prader-Willi syndrome: Clinical genetics, cytogenetics and molecular biology. Expert Rev Mol Med. 2005;7:1–20. doi: 10.1017/S1462399405009531. [DOI] [PMC free article] [PubMed] [Google Scholar]
- Butler MG. Prader-Willi syndrome: Current understanding of cause and diagnosis. Am J Med Genet. 1990;35:319–332. doi: 10.1002/ajmg.1320350306. [DOI] [PMC free article] [PubMed] [Google Scholar]
- Butler MG, Meaney FJ. Standards for selected anthropometric measurements in Prader-Willi syndrome. Pediatrics. 1991;88:853–860. [PMC free article] [PubMed] [Google Scholar]
- Butler MG, Thompson T. Prader-Willi syndrome: Clinical and genetic findings. The Endocrinologist. 2000;10:3S–16S. doi: 10.1097/00019616-200010041-00002. [DOI] [PMC free article] [PubMed] [Google Scholar]
- Butler MG, Meaney FJ, Palmer CG. Clinical and cytogenetic survey of 39 individuals with Prader-Labhart-Willi syndrome. Am J Med Genet. 1986;23:793–809. doi: 10.1002/ajmg.1320230307. [DOI] [PMC free article] [PubMed] [Google Scholar]
- Butler MG, Christian SL, Kubota T, Ledbetter DH. A 5-year-old white girl with Prader-Willi syndrome and a submicroscopic deletion of chromosome 15q11–q13. Am J Med Genet. 1996;65:137–141. doi: 10.1002/(SICI)1096-8628(19961016)65:2<137::AID-AJMG11>3.0.CO;2-R. [DOI] [PMC free article] [PubMed] [Google Scholar]
- Butler MG, Haber L, Mernaugh R, Carlson MG, Price R, Feurer ID. Decreased bone mineral density in Prader-Willi syndrome: Comparison with obese subjects. Am J Med Genet. 2001;103:216–222. [PMC free article] [PubMed] [Google Scholar]
- Butler MG, Bittel D, Talebizadeh Z. Prader-Willi syndrome and a deletion/duplication within the 15q11–q13 region. J Med Genet. 2002;39:202–204. doi: 10.1136/jmg.39.3.202. [DOI] [PMC free article] [PubMed] [Google Scholar]
- Carrel AL, Moerchen V, Myers SE, Bekx MT, Whitman BY, Allen DB. Growth hormone improves mobility and body composition in infants and toddlers with Prader-Willi syndrome. J Pediatr. 2004;145:744–749. doi: 10.1016/j.jpeds.2004.08.002. [DOI] [PubMed] [Google Scholar]
- Cassidy SB. Prader-Willi syndrome. Curr Probl Pediatr. 1984;14:1–55. doi: 10.1016/0045-9380(84)90043-4. [DOI] [PubMed] [Google Scholar]
- Cassidy SB. Prader-Willi syndrome. J Med Genet. 1997;34:917–923. doi: 10.1136/jmg.34.11.917. [DOI] [PMC free article] [PubMed] [Google Scholar]
- Chen KY, Sun M, Carlson MG. Energy expenditure of physical activity in lean and obese humans using a novel respiratory chamber. Intl J Obes. 1998;22:S74. [Google Scholar]
- Chen KY, Sun M, Butler MG, Thompson T, Carlson MG. Development and validation of an activity-energy measurement system for assessment of energy expenditure and physical activity in Prader-Willi syndrome. Obes Res. 1999;79:387–394. doi: 10.1002/j.1550-8528.1999.tb00422.x. [DOI] [PMC free article] [PubMed] [Google Scholar]
- Goldstone AP, Thomas EL, Brynes AE, Bell JD, Frost G, Saeed N, Hajnal JV, Howard JK, Holland A, Bloom SR. Visceral adipose tissue and metabolic complications of obesity are reduced in Prader-Will syndrome female adults: Evidence for novel influences on body fat distribution. J Clin Endocrinol Metab. 2001;86:4430–4438. doi: 10.1210/jcem.86.9.7814. [DOI] [PubMed] [Google Scholar]
- Hill JO, Kaler M, Spetalnick B, Reed G, Butler MG. Resting metabolic rate in Prader-Willi syndrome. Dysmorph Clin Genet. 1990;4:27–32. [PMC free article] [PubMed] [Google Scholar]
- Holm VA, Cassidy SB, Butler MG, Hanchett JM, Greenswag JR, Whitman BY, Greenberg F. Prader-Willi syndrome: Consensus diagnostic criteria. Pediatrics. 1993;91:398–402. [PMC free article] [PubMed] [Google Scholar]
- Hoybye C. Endocrine and metabolic aspects of adult Prader-Willi syndrome with special emphasis on the effect of growth hormone treatment. Growth Horm IGF Res. 2003;14:1–15. doi: 10.1016/j.ghir.2003.09.003. [DOI] [PubMed] [Google Scholar]
- Jequier E, Shutz Y. Long term measurement of energy expenditure in humans using a respiration chamber. J Clin Nutr. 1983;38:989–998. doi: 10.1093/ajcn/38.6.989. [DOI] [PubMed] [Google Scholar]
- Johnsen S, Crawford JD, Haessler HA. Fasting hyperlipogenesis. An inborn error of energy metabolism in Prader-Willi syndrome. Pediatric Res. 1967;1:291. [Google Scholar]
- Kennedy L, Bittel DC, Kibiryeva N, Kalra SP, Torto R, Butler MG. Circulating adiponectin levels, body composition and obesity-related variables in Prader-Willi syndrome: Comparison with obese subjects. Int J Obes. 2006;30:382–387. doi: 10.1038/sj.ijo.0803115. [DOI] [PMC free article] [PubMed] [Google Scholar]
- Kimbrough BO, Holman RT, Nelson RA, Callaway CW, Hayes AB. Triglyceride analysis of adipose tissue in Prader-Willi syndrome. Fed Proc. 1976;35:344. (abstract) [Google Scholar]
- Kuczmarski RJ, Ogden CL, Grummer-Strawn LM, Flegal KM, Guo SS, Wei R, Mei Z, Curtin LR, Roche AF, Johnson CL. CDC growth charts: United States. Adv Data. 2000;8:1–27. [PubMed] [Google Scholar]
- Meaney FJ, Butler MG. The developing role of anthropologists in medical genetics: Anthropometric assessment of the Prader-Labhardt-Willi syndrome as an illustration. Med Anthropol. 1989a;10:247–253. doi: 10.1080/01459740.1989.9965971. [DOI] [PMC free article] [PubMed] [Google Scholar]
- Meaney FJ, Butler MG. Characterization of obesity in the Prader-Labhardt-Willi syndrome: Fatness patterning. Med Anthropol Quart. 1989b;3:294–305. doi: 10.1525/maq.1989.3.3.02a00080. [DOI] [PMC free article] [PubMed] [Google Scholar]
- Nelson RA, Huse DM, Holman RT, Kimbrough BO, Wahner HW, Callaway CW, Hayles AB. Nutrition, metabolism, body composition, and response to the ketogenic diet in Prader-Willi syndrome. In: Holm VA, Sulzbacher SJ, Pipes PL, editors. Prader-Willi Syndrome. Baltimore: University Park Press; 1981. pp. 105–120. [Google Scholar]
- Owen OE. Resting metabolic requirements of men and women. Mayo Clin Proc. 1988;63:503–510. doi: 10.1016/s0025-6196(12)65649-3. [DOI] [PubMed] [Google Scholar]
- Ravussin E, Lillioja S, Anderson TE, Christin L, Bogardus C. Determinants of 24-hour energy expenditure in man: Methods and results using a respiratory chamber. J Clin Invest. 1986;78:1568–1578. doi: 10.1172/JCI112749. [DOI] [PMC free article] [PubMed] [Google Scholar]
- Schoeller DA, Levitsky LL, Bandini LG, Dietz WW, Walczak A. Energy expenditure and body composition in Prader-Willi syndrome. Metabolism. 1988;37:115–120. doi: 10.1016/s0026-0495(98)90003-8. [DOI] [PubMed] [Google Scholar]
- Schwartz RS, Brunzell JD, Bierman EL. Elevated adipose tissue lipoprotein lipase in the pathogenesis of obesity in Prader-Willi syndrome. In: Holm VA, Sulzbacher SJ, Pipes PL, editors. Prader-Willi Syndrome. Baltimore: University Park Press; 1981. [PubMed] [Google Scholar]
- Sun M, Hill JO. Measurement of mechanical work and work efficiency during human activities. J Biomech. 1993;26:229–241. doi: 10.1016/0021-9290(93)90361-h. [DOI] [PubMed] [Google Scholar]
- Sun M, Reed GW, Hill JO. Modification of a whole room indirect calorimeter for measurement of rapid changes in energy expenditure. J Appl Physiol. 1994;76(6):2686–2691. doi: 10.1152/jappl.1994.76.6.2686. [DOI] [PubMed] [Google Scholar]
- Talebizadeh Z, Butler MG. Insulin resistance and obesity-related factors in Prader-Willi syndrome: Comparison with obese subjects. Clin Genet. 2005;67:230–239. doi: 10.1111/j.1399-0004.2004.00392.x. [DOI] [PMC free article] [PubMed] [Google Scholar]
- Thompson T, Butler MG, MacLean WE, Joseph B. Prader-Willi syndrome: Genetics and behavior. Peabody J Educ. 1996;71:187–212. doi: 10.1080/01619569609595137. [DOI] [PMC free article] [PubMed] [Google Scholar]
- Weir JB. New method for calculating metabolic rate with special reference to protein metabolism. J Physiol. 1949;109:1–9. doi: 10.1113/jphysiol.1949.sp004363. [DOI] [PMC free article] [PubMed] [Google Scholar]
- Widhalm K, Veitl V, Irsigler K. Evidence for decreased energy expenditure in the Prader-Labhart-Willi syndrome: Assessment by means of the Vienna Calorimeter (Abstract) Proc Intl Cong Nutr 1981 [Google Scholar]