

Abstract
The kinetics of the release of Doxorubicin from Pluronic P105 micelles during ultrasonication and its subsequent re-encapsulation upon cessation of insonation were investigated. Four mechanisms are proposed to explain the acoustically-triggered Doxorubicin (Dox) release and re-encapsulation from Pluronic P105 micelles. The four mechanisms are: micelle destruction; destruction of cavitating nuclei; reassembly of micelles, and the re-encapsulation of Dox. The first mechanism, the destruction of micelles during insonation, causes the release of Dox into solution. The micelles are destroyed because of cavitation events produced by collapsing nuclei, or bubbles in the insonated solution. The second mechanism, the slow destruction of cavitating nuclei, results in a slow partial recovery phase, when a small amount of Dox is re-encapsulated. The third and fourth mechanisms, the reassembly of micelles and the re-encapsulatin of Dox, are independent of ultrasound. These two mechanism are responsible for maintaining the drug release at a partial level, and for recovery after insonation ceases. A normal distribution was used to describe micellar size. Parameters for the model were determined based upon the best observed fit to experimental data. The resulting model provides a good approximation to experimental data for the release of Dox from Pluronic P105 micelles.
Keywords: Modeling, Ultrasound, Doxorubicin, Kinetics, Pluronic micelles
1. Introduction
The high toxicity of potent chemotherapeutic drugs, including Doxorubicin (Dox), limits the therapeutic window in which they can be applied. This window can be expanded by controlling the drug delivery in both space and time. The aim of such controlled delivery is to minimize any damage to non-targeted tissues. Previously, our research group has shown that ultrasound can be used to control the release of Dox and Ruboxyl (a paramagnetic analogue of Dox) from the core of stabilized as well as non-stabilized micelles [1–13]. Preliminary work with an in vivo rat model showed that Dox activity can be enhanced by ultrasound in one region, while in an adjacent region there is little or no effect of the drug. Specifically, the size of the ultrasonically-targeted tumor in the leg of rat was reduced while a non targeted tumor in the other leg was less affected [12]. More recently, we have shown that there is a strong correlation between acoustically-triggered Dox release from both stabilized and non-stabilized micelles, and the emergence of a subharmonic peak in acoustic spectra suggesting a strong role of cavitation in the release mechanism [3]. A follow up study showed that more drug release was observed from non-stabilized micelles, when compared to stabilized micelles [13].
Simple mechanistic models were used earlier to predict the kinetics of acoustic drug release and re-encapsulation from unstabilized micelles in an attempt to optimize the application of ultrasound in in vivo experiments [6]. The previous analysis failed to account for the multiphasic nature of both the release and the re-encapsulation regions of the data.
In this work, we re-visit the release and re-encapsulation data for unstabilized Pluronic P105 micelles, and attempt to represent this complex phenomenon using a kinetic model capable of simulating the multiple phases of drug release. This model provides three stages in release: a rapid initial phase; a slow release phase; and finally a partial recovery phase. We then validate the proposed model in an attempt to shed light onto the mechanism of acoustically-activated drug release of anti-neoplastic agents from Pluronic P105 micelles. By understanding the physical mechanisms, a more effective drug delivery method can be executed.
2. Materials and methods
2.1. Materials
Pluronic P105 was provided by BASF Corp. (Mount Olive, NJ); Doxorubicin was obtained in a 1:5 mixture with lactose and from Pharmacia & Upjohn Company (Kalamazoo, MI) in dosage form; it was dissolved in phosphate buffered saline (PBS) and sterilized by filtration through a 0.2 μm filter.
2.2. Drug encapsulation in Pluronic micelles
Stock solutions of Pluronic P105 were prepared by dissolving P105 in a PBS solution to the desired final concentration. Dox was dissolved into the P105 solutions at room temperature to produce a final Dox concentration of 10 μg/ml. The same drug concentration was also prepared in PBS. Additional details have been published earlier [3,4].
2.3. Measuring ultrasound-triggered release of Dox from Pluronic P105 micelles
The amount of encapsulated Dox can be determined by the fluorescence intensity of the Dox solution. Dox sequestered in a hydrophobic environment, such as the interior of a micelle, fluoresces more intensely than does free Dox in an aqueous environment, which is partially quenched upon association with water molecules.
A chamber was built to measure the change of fluorescence intensity of Dox solutions with and without the application of ultrasound. Details were described previously [3,4]. Briefly, an argon-ion laser beam at 488 nm was directed to either a cuvette or a tube containing the encapsulated drug. The emissions were collected using a fiber optic collector and filtered to remove the excitation wavelength. Then these emissions were quantified using a photodetector and an oscilloscope and subsequently stored on a computer for further analysis [3,4].
The decrease in fluorescence of the encapsulated drug solution is assumed to be directly proportional to the amount of drug released relative to a known baseline fluorescence of Dox in PBS, in the absence of Pluronic. The fluorescence of such a solution was assumed to simulate 100% Dox release. Then the fraction of Dox which is encapsulated, E, was calculated as follows:
| (1) |
where IUS is the fluorescence intensity upon exposure to ultrasound, IPBS is the fluorescence intensity in a solution of Dox in PBS, and IP105 is the intensity recorded when the drug is completely encapsulated in Pluronic P105 (which corresponds to 0% release or 100% encapsulation).
In these experiments, the fluorescence intensity of the drug in PBS was measured both with and without the application of ultrasound. Ultrasound at 20 kHz was generated using a probe transducer (Sonics and Materials, Newton, CT) inserted into the water bath. The insonation intensity was measured with a calibrated hydrophone (Bruel and Kjaer model 8103, Decatur, GA). The power density used in data collection was 0.058 W/cm2. Further details can be found in Refs. [3,4].
2.4. Experimental observations
To study the acoustically-triggered release of drug from micelles, the solution of Pluronic P105 and Dox in PBS was insonated for up to 60 s and the fluorescence of the solution recorded. Fluorescence data from five separate runs were used to calculate E over time. The results for all five are plotted in Fig. 1.
Fig. 1.

(a) First 10 s of data from five separate runs immediately after insonation begins. Light gray markers indicate the raw data, and the dark gray markers indicate the average of the five runs. (b) Sixty seconds of data from five separate runs immediately after insonation begins. Light gray markers indicate the raw data, and the dark gray markers indicate the average of the five runs. Only one run extended beyond 55 s.
The release data indicate multiple phases. Immediately upon insonation, there is a rapid initial phase, when most of the release occurs. After the first second, a slower release phase is apparent. Finally, the partial recovery phase begins after about 10 s, when some of the Dox is slowly re-encapsulated.
To study Dox re-encapsulation into micelles after insonation ceases, the micellar solution was first subjected to ultrasonication for 60 s at which time the ultrasound was switched off. The fluorescence of the solution was again recorded, this time in the absence of ultrasound. The results for five separate runs are plotted in Fig. 2.
Fig. 2.

Data from five separate runs, immediately after insonation ceases.
The re-encapsulation data indicate a biphasic nature. Immediately after insonation ceased, the amount of encapsulated Dox increased slightly during the slow initial re-encapsultation phase. After 0.2 s, a rapid re-encapsulation phase begins. Re-encapsulation is completed within the first second.
3. Proposed mechanism
The mathematical model developed in this paper is based on the assumption that collapse cavitation of a gas nucleus, or bubble, is the cause of micellar destruction. Justification for this assumption is discussed in this section.
Our previous work has shown that the onset of release correlates with the emergence of a subharmonic peak in the acoustic spectra. Two sources for the subharmonic peak at half the driving frequency (f/2) have been proposed in the literature. One possible source is bubbles undergoing stable cavitation [14,15], where the bubbles oscillate in the acoustic field near, but not quite at the points of implosion. Stable cavitation with a subharmonic component has been previously reported [15–20].
The second possible source of subharmonic emission is related to events that occur when this oscillating bubble implodes [21]. Collapse cavitation is characterized acoustically by a shock wave that produces broad band white noise [14,15]. An f/2 signal that is always accompanied by an increase in background noise is usually attributed to collapse cavitation.
As previously reported, the appearance of a subharmonic peak at half of the driving frequency, which is correlated with drug release, is always accompanied by a jump in background noise [4]. For this reason, we concluded that an f/2 peak in acoustic spectra is indicative of collapse cavitation. Additional evidence that corroborates this conclusion is the previously reported observation in this same experimental apparatus of free radicals which are formed by the violent implosion of the bubble [22,23]. Furthermore, the onset of Dox release occurs at about the same mechanical index (MI = 0.4) as the onset of collapse cavitation [24]. The above observations support our assumption that acoustically-activated Dox release from micelles is caused by collapse cavitation. The kinetic model discussed below is based on this collapse cavitation assumption.
4. Kinetic model
4.1. Micelle diameter distribution
The diameter of Pluronic P-105 micelles has been estimated to be in the range of 10–20 μm [1,10,11]. For this model, the micelles were considered to be normally distributed by weight about a mean diameter of 15 μm. Most of the micelles (98%) are assumed to be within the 10–20 μm diameter range, dictating a standard deviation of 2.5 μm. To simplify calculations, the normal distribution was divided into five groups, each group containing 20% of the total amount of polymer. Table 1 indicates the mean diameter and diameter cubed (proportional to volume and mass) for each group. The last column also indicates the fraction of the total number of micelles which are initially in each group, Mj, o. This was calculated using Eq. (2).
Table 1.
Characteristics for each micellar group
| Group (j) | Probability | Range (Z) | Diameter range (D, μm) | Mean diameter ( , μm) | Mean cubed diameter ( , μm) | Fraction of total micelles (Mj) |
|---|---|---|---|---|---|---|
| 1 | 0.2 | −∞ ≤ Z < −0.84 | 0 ≤ D < 12.9 | 11.6 | 1618 | 0.372 |
| 2 | 0.2 | −0.84 ≤ Z < −0.25 | 12.9 ≤ D < 14.4 | 14.0 | 2670 | 0.226 |
| 3 | 0.2 | −0.25 ≤ Z < 0.25 | 14.4 ≤ D < 15.6 | 15.0 | 3411 | 0.177 |
| 4 | 0.2 | 0.25 ≤ Z < 0.84 | 15.6 ≤ D < 17.1 | 16.5 | 4469 | 0.135 |
| 5 | 0.2 | 0.84 ≤ Z < ∞ | 17.1 ≤ D < ∞ | 19.6 | 6765 | 0.089 |
| (2) |
4.2. Number of micelles
The number of micelles in each group changes with time, reflecting two competing mechanisms. The first is the destruction of micelles during insonation. The second mechanism is the subsequent reassembly of micelles, which occurs independently of the presence of ultrasound.
| (3) |
Mj represents the number of micelles in group j, normalized by the total number of micelles initially in the solution.
The rate of micelle destruction is assumed to be first-order with respect to both the number of micelles, and the number of cavitating nuclei (N).
| (4) |
The rate constant, kd, j, varies depending upon the size of the micelle; larger micelles are destroyed more rapidly than smaller ones as we will explain. Since destruction is initiated by a high pressure wavefront emanating from collapse cavitation of a bubble (or nucleus), the rate constant is proportional to the period of time during which the wavefront perturbs the micelle. This time is proportional to the micelle diameter. Therefore, kd, j is likewise proportional to the diameter.
| (5) |
α is a non-zero constant during insonation, and reverts to zero in the post-insonation period.
The number of cavitating nuclei, N, is expressed as a fraction of the initial number. This value is likely to decrease with time, as the bubbles collapse and reform into smaller bubbles. The smaller bubbles may merge to reform another nucleus, or may remain too small to either cavitate, or to cavitate with enough force to destroy micelles. The number of cavitating nuclei is assumed to decrease slowly over time, with the rate being first-order with respect to the number of nuclei.
| (6) |
Integration provides the following relation.
| (7) |
A second mechanism, micelle reassembly, competes with the micelle destruction. The destruction of a micelle releases the polymer which comprised it. This polymer becomes dissolved in the solution, and is free to begin reassembling into new or “reformed” micelles. The rate of micelle assembly is assumed to be first-order with respect to the normalized volume concentration of the free polymer in solution, VFP.
| (8) |
The rate constant, ka, j, varies depending upon the size of the micelle being formed; larger micelles are formed more slowly than smaller ones. Since the assembly of a micelle involves the collection of a volume of polymer, the rate of assembly is likely related to the volume of required polymer. Therefore, the rate constant is assumed to be inversely proportional to the diameter cubed.
| (9) |
To obtain the normalized volume concentration (VFP), the volume concentration of free polymer is determined by dividing the volume of free polymer in solution, νFP by the volume of the solution, νsol. This value is then normalized by the concentration which would occur if all the polymer were freely available in solution, νtot, o/νsol, where νtot, o is the total amount of polymer in the solution, or in all micelles before insonation. The resulting normalized concentration, VFP, is given by the following equation.
| (10) |
Since the volume of free polymer, νFP, is equal to νtot, o less the amount of polymer which is in all micelles at a given time, νtot, Eq. (10) becomes:
| (11) |
Summing over all the micellar groups provides the following relation.
| (12) |
Recalling that Mj, o is the fraction of micelles originally in group j, which is equal to 1/n provides the final form of the equation.
| (13) |
The above equations can be used to predict the number of micelles in each micellar group as a function of time, during either the insonation or the post-insonation period.
4.3. Encapsulated Dox
The amount of drug which is encapsulated by each micellar group changes with time, reflecting the effects of two competing mechanisms. When a micelle is destroyed, it releases its stored drug into the solution. The free drug can then be re-encapsulated by micelles, either pre-existing or newly-assembled. The total change in the fraction of the drug which is encapsulated in group j, Ej, is given by the addition of both of these effects.
| (14) |
The rate at which Dox is released into solution depends upon the rate of micelle destruction. The amount of Dox which a micelle releases into solution upon destruction is assumed to be the average amount of Dox contained in micelles within its group, Ej/Mj.
| (15) |
Substituting Eq. (4) into the above equation yields the following relation.
| (16) |
As new micelles are formed, they add to the capacity for their group to encapsulate Dox. The rate of encapsulation of the free drug is assumed to be first order with respect to the amount of free Dox, F, and the remaining capacity for the micellar group to store Dox. This can be determined as the amount of Dox which could be stored if the micelles in group j were saturated, , less the amount they already hold.
| (17) |
The rate constant, ke,j, depends upon the ratio of the surface area to the volume, making it inversely proportional to the diameter of the micelle. The larger the micelle, the smaller is the surface area to volume ratio, so the rate constant decreases.
| (18) |
The amount of drug which can be encapsulated in each group upon saturation depends on the number of micelles in each group, the volume of each micelle, and the amount of drug which can be stored per unit volume of polymer, .
| (19) |
But can be considered for any solution as the total amount of Dox which the intact micelles in the solution can hold, , divided by the total volume of polymer in the solution.
| (20) |
Substituting for ν tot, o by summing the initial volumes of all the micellar groups yields the following relation.
| (21) |
The fraction of the drug which is freely available in the solution, F, is the total (unity) less the fraction which is encapsulated, E.
| (22) |
Finally, E is the sum of the fraction of encapsulated drug in each micellar group.
| (23) |
5. Results and discussion
The proposed model was solved numerically for an insonation period of 60 s and compared against the experimental drug release data. Values for the constants appearing in the model were determined by the best fit to the experimental data. The determination of the value for each constant is discussed next. The values are summarized in Table 2.
Table 2.
Model parameters for the insonation and post-insonation periods of the model
| Parameter | Parameter description | Insonation period | Post-insonation period |
|---|---|---|---|
| α (μm−1 s−1) | Micelle destruction | 0.02 | 0 |
| β (μm3/s) | Micelle assembly | 330 | 330 |
| γ (μm3/s) | Re-encapsulation | 100 | 100 |
| kN (s−1) | Nuclei destruction | 0.002 | 0 |
| E at saturation | 2.2 | 2.2 |
The value of α reflects how quickly micelles are destroyed. Since this is the initial event upon insonation, the data within the rapid initial phase are used to determine its value. The value of α which provided the best fit for this data is 0.02 μm−1 s−1.
The values for γ and are defined by how quickly the rapid initial phase ends. The value of which provided the best fit is 2.2. The value of γ which provided the best fit is 100 μm/s.
The rate of micelle assembly is defined by the data in the slow phase. The value for β which provided the best fit to the data is 330 μm3/s.
The rate of destruction of the cavitating nuclei determines the upward slope of the data in the partial-recovery phase. The value for kN which provides the best fit to the data is 0.002 s−1.
5.1. Fitting to experimental data—insonation period
The release of Dox during insonation was simulated using the best-fit values for the above parameters, listed in Table 2. The model provided a good fit to the experimental data, as illustrated in Fig. 3. Close agreement was achieved for each phase of the release.
Fig. 3.

(a) Results from the simulation compared to experimental data for five runs, the first 10 s after insonation begins. The solid black line is the model output. Light gray markers indicate the raw data, and the dark gray markers indicate the average of the five runs. (b) Results from the simulation compared to experimental data for five runs, the first 60 s after insonation begins. The solid black line is the model output. Light gray markers indicate the raw data, and the dark gray markers indicate the average of the five runs. Only one run extended beyond 55 s.
During insonation, the number of micelles initially decrease, as they are rapidly destroyed. Fig. 4 indicates the change in the number of micelles in each group over time. All five groups initially decrease rapidly with time. The larger micelles are destroyed rapidly because the value of kd, j, which is proportional to diameter, is relatively large. The smaller micelles are also destroyed rapidly, because their large number compensates for their smaller value of kd, j. After 1–2 s, a pseudo-equilibrium between micelle destruction and assembly is reached for the four larger-micelle groups. The smallest-micelle group increases again before it attains pseudo-equilibrium. This occurs because the smallest micelles form more rapidly than the larger micelles, and so can use more of the available free polymer. After reaching pseudo-equilibrium, the number of micelles remains relatively constant for each group. After 10 s, the number of micelles begins to slowly increase for all groups, because of the loss of cavitating nuclei over time.
Fig. 4.
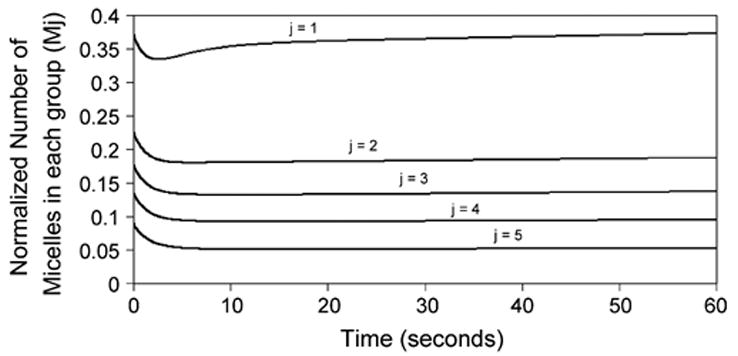
Normalized number of micelles over time for each micellar group during insonation. Results from the simulation.
As micelles are destroyed during insonation, the amount of encapsulated Dox decreases rapidly. Fig. 5 illustrates the change in encapsulated Dox over time. Within the first quarter-second, the amount of encapsulated drug decreases among all five micel-lar groups. After this initial period of time, the smallest-micelle group quickly begins to accumulate Dox. This is because the smallest micelles have a relatively large surface area-to-volume ratio, and so can encapsulate free Dox faster than the larger micelles. When coupled with the faster assembly, the smallest-micellar group actually gains Dox as a result of insonation. It is important to note that this is a result of the size distribution, and would not hold true for a solution of uniform-sized micelles.
Fig. 5.
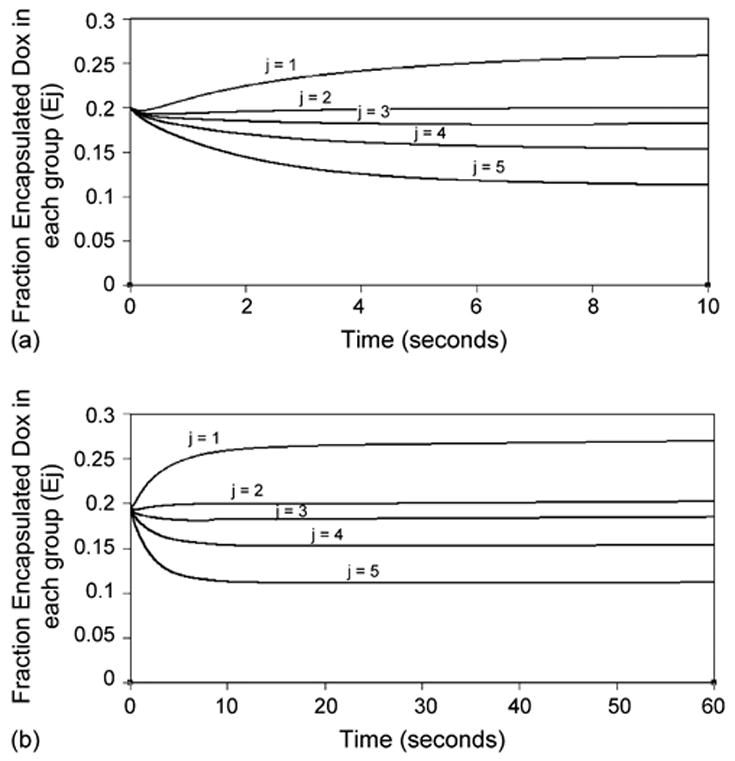
(a) Fraction of Dox which is encapsulated in each micellar group during first 10 s of insonation. Results from the simulation. (b) Fraction of Dox which is encapsulated in each micellar group during 60 s of insonation. Results from the simulation.
5.2. Fitting to experimental data—post-insonation period
The re-encapsulation of Dox in the post-insonation period was simulated using the same best-fit values as for the insonation period. However, here we set kd, j and kN to zero.
After 60 s of insonation, the parameters were changed to the post-insonation values to complete the simulation. Sixty seconds were chosen to match the conditions of the experimental data. Although the resulting simulation adequately predicted re-encapsulation behavior (Fig. 6), it was unable to account for the biphasic nature of the post-insonation period.
Fig. 6.

Fraction of Dox which is encapsulated over time, during the post-insonation period. Results from the simulation compared to data from five separate runs.
5.3. Validation of the model using pulsed ultrasound experiments
To validate the model, its predictions were compared against a separate set of experimental data. These data were collected with the same equipment using an experimental protocol in which insonation was pulsed for short pulses, instead of continuously for 60 s. The pulse sequence was a series of “ON” and “OFF” insonation segments of varying times in the different experiments. Several cycles were overlaid and compared against the previous model predictions without adjusting any of the parameters (see Table 2). For example, Fig. 7 displays the data from a run where ultrasound was turned ON for 2 s and then turned OFF for 1.6 s in each cycle. Data from 10 cycles are overlaid, and displayed with the model prediction. Fig. 8 similarly displays data from an experiment in which ultrasound was ON for 0.4 s, and OFF for 2 s.
Fig. 7.

Fraction of Dox which is encapsulated over time during pulsed insonation. The insonation period was 2.0 s. The post-insonation period was 1.6 s. Results from the simulation (black line) compared to data from 10 cycles (gray symbols).
Fig. 8.

Fraction of Dox which is encapsulated over time during pulsed insonation. The insonation period was 0.4 s. The post-insonation period was 2.0 s. Results from the simulation (black line) compared to data from 10 cycles (gray symbols).
We propose that the kinetic parameters regressed from the continuous ultrasound data are fairly accurate because they can predict release and re-encapsulation fairly accurately for two different experiments of pulsed ultrasound shown in Figs. 7 and 8. Although the model successfully predicts the shape of the insonation and post-insonation periods, the model slightly underpredictes the amount of Dox which was released. This is consistent with the observation that the amount of released Dox increases in the first few pulses (the fluorescent intensity decreases in each successive cycle). An example of this phenomenon is shown in Fig. 9 in which the maximum release of Dox (corresponding to the minimum of encapsulated Dox) increases over the first few cycles. We hypothesize that this behavior is due to the presence of cavitating nuclei (bubbles) which remain in solution after the ON phase of ultrasound is completed. These remaining nuclei add to those which are newly-generated in the current pulse. This results in a more rapid destruction of micelles, and a larger and faster release of Dox.
Fig. 9.

Fraction of Dox which is encapsulated over time during an experimental run consisting of several pulsed cycles. The insonation period was 2.0 s. The post-insonation period was 1.6 s. The maximum release of Dox (corresponding to the minimum of encapsulated Dox) increases slightly over the first few cycles.
6. Conclusion
We have reported earlier that the application of ultrasound causes the release of Doxorubicin and Ruboxyl from Pluronic P105 micelles. The rate at which both release and re-encapsulation takes place is rapid (both are mostly complete within 2 s). Thus, chemotherapy drugs are released and re-encapsulated with tremendous efficacy and minimal interaction with healthy cells.
The newly-developed model presented here re-examines the kinetics of drug release under the action of ultrasound and accounts for the multiphasic behavior in release during insonation. The model is also consistent with the assumption that collapse cavitation plays a strong role in this complex physical phenomenon. To validate the mathematical model presented in this paper, we predicted release in a pulsed insonation experiment and compared it to data collected using pulsed ultrasound. The model provides reasonably accurate predictions of experimental data. Future experiments will be needed to determine the value of .
In conclusion, we reiterate the advantages of this novel drug delivery system mainly that it is non invasive, and can be focused on cancerous tissues without affecting the healthy cells in the vicinity. We also stress the importance of understanding the physical mechanism at play in acoustically-activated micellar drug delivery, to aid in optimizing the duration of therapy and the optimal drug concentration to be used clinically.
References
- 1.Rapoport N, Caldwell K. Structural transitions in micellar solutions of Pluronic P-105 and their effect on the conformation of dissolved Cytochrome C: an electron paramagnetic resonance investigation. Colloid Surf B: Biointerfaces. 1994;3:217–228. [Google Scholar]
- 2.Husseini GA, Christensen DA, Rapoport NY, Pitt WG. Ultrasonic release of doxorubicin from Pluronic P105 micelles stabilized with an interpenetrating network of N,N-diethylacrylamide. J Control Release. 2002;83(2):302–304. doi: 10.1016/s0168-3659(02)00203-1. [DOI] [PubMed] [Google Scholar]
- 3.Husseini GA, Diaz MA, Richardson ES, Christensen DA, Pitt WG. The role of cavitation in acoustically activated drug delivery. J Control Release. 2005;107(2):253–261. doi: 10.1016/j.jconrel.2005.06.015. [DOI] [PMC free article] [PubMed] [Google Scholar]
- 4.Husseini GA, Myrup GD, Pitt WG, Christensen DA, Rapoport NY. Factors affecting acoustically-triggered release of drugs from polymeric micelles. J Control Release. 2000;69:43–52. doi: 10.1016/s0168-3659(00)00278-9. [DOI] [PubMed] [Google Scholar]
- 5.Husseini GA, et al. DNA damage induced by micellar-delivered doxoru-bicin and ultrasound: comet assay study. Cancer Lett. 2000;154:211–216. doi: 10.1016/s0304-3835(00)00399-2. [DOI] [PubMed] [Google Scholar]
- 6.Husseini GA, Rapoport NY, Christensen DA, Pruitt JD, Pitt WG. Kinetics of ultrasonic release of doxorubicin from Pluronic P105 micelles. Colloids Surf B: Biointerfaces. 2002;24:253–264. [Google Scholar]
- 7.Rapoport N, Christensen DA, Fain HD, Barrows L, Gao Z. Ultrasound-triggered drug targeting of tumors in vitro and in vivo. Ultrasonics. 2004;42:943–950. doi: 10.1016/j.ultras.2004.01.087. [DOI] [PubMed] [Google Scholar]
- 8.Rapoport N, Marin A, Christensen DA. Ultrasound-activated micellar drug delivery. Drug Deliv Syst Sci. 2002;2(2):37–46. [Google Scholar]
- 9.Rapoport N, Munshi N, Pitina L, Pitt WG. Pluronic, Micelles as vehicles for tumor-specific delivery of two anti-cancer drugs to HL-60 cells using acoustic activation. Polym Preprints. 1997;38(2):620–621. [Google Scholar]
- 10.Pruitt JD, Husseini G, Rapoport N, Pitt WG. Stabilization of Pluronic P-105 micelles with an interpenetrating network of N,N-diethylacrylamide. Macromolecules. 2000;33(25):9306–9309. [Google Scholar]
- 11.Pruitt JD, Pitt WG. Sequestration and ultrasound-induced release of Dox-orubicin from stabilized Pluronic P105 micelles. Drug Deliv. 2002;9(4):253–259. doi: 10.1080/10717540260397873. [DOI] [PubMed] [Google Scholar]
- 12.Rapoport N, Pitt WG, Sun H, Nelson JL. Drug delivery in polymeric micelles: from in vitro to in vivo. J Control Release. 2003;91(12):85–95. doi: 10.1016/s0168-3659(03)00218-9. [DOI] [PubMed] [Google Scholar]
- 13.Husseini GA, Diaz de la Rosa MA, Gabuji T, Zeng Y, Chris-tensen DA, Pitt WG. Release of Doxorubicin from Unstabilized and Stabilized Micelles Under the Action of Ultrasound. Journal of Nanoscience and Nanotechnology. 2007 doi: 10.1166/jnn.2007.218. in press. [DOI] [PMC free article] [PubMed] [Google Scholar]
- 14.Brennen CE. Cavitation and Bubble Dynamics. Oxford University Press; New York: 1995. p. 282. [Google Scholar]
- 15.Neppiras EA. Subharmonic and other low-frequency emission from bubbles in sound-irradiated liquids. J Acoust Soc Am. 1969;46(3):587–601. [Google Scholar]
- 16.Flynn HG, Church CC. Transient pulsations of small gas bubbles in water. J Acoust Soc Am. 1988;84(5):1863–1876. doi: 10.1121/1.397253. [DOI] [PubMed] [Google Scholar]
- 17.Allen JS, Kruse DE, Dayton PA, Ferrara KW. Effect of coupled oscillations on microbubble behavior. J Acoust Soc Am. 2003;114(3):1678–1690. doi: 10.1121/1.1600721. [DOI] [PubMed] [Google Scholar]
- 18.Eller A, Flynn HG. Generation of subharmonics of order one-half by bubbles in a sound field. J Acoust Soc Am. 1969;46(3):722–727. [Google Scholar]
- 19.Mestas JL, Lenz P, Cathignol D. Long-lasting stable cavitation. J Acoust Soc Am. 2003;113(3):1426–1430. doi: 10.1121/1.1538198. [DOI] [PubMed] [Google Scholar]
- 20.Phelps AD, Leighton WG. The subharmonic oscillations and combination-frequency subharmonic emissions from a resonant bubble: their properties and generation mechanisms. Acustica. 1997;83(1):59–66. [Google Scholar]
- 21.Leighton TG. The Acoustic Bubble. Academic Press; London: 1994. p. 613. [Google Scholar]
- 22.Rapoport N, Smirnov AI, Timoshin A, Pratt AM, Pitt WG. Factors affecting the permeability of P. aeruginosa cell walls toward lipophilic compounds: effects of ultrasound and cell Age. Arch Biochem Biophys. 1997;344(1):114–124. doi: 10.1006/abbi.1997.0176. [DOI] [PubMed] [Google Scholar]
- 23.Apfel RE, Holland CK. Gauging the Likelihood of Cavitation from Short-pulse Low-duty Cycle Diagnostic Ultrasound. Ultrasound Med Biol. 1991;17(2):179–185. doi: 10.1016/0301-5629(91)90125-g. 12. [DOI] [PubMed] [Google Scholar]
- 24.Barnett S. Thresholds for nonthermal biofeffects: theoretical and experimental basis for a threshold index. Ultrasound Med Biol. 1998;24(S1):S41–S49. doi: 10.1016/s0301-5629(98)80001-x. [DOI] [PubMed] [Google Scholar]