

Abstract
Local actin assembly is associated with sites of exocytosis in processes ranging from phagocytosis to compensatory endocytosis. Here, we examine whether the trigger for actin-coat assembly around exocytosing Xenopus egg cortical granules is ‘compartment mixing’ — the union of the contents of the plasma membrane with that of the secretory granule membrane. Consistent with this model, compartment mixing occurs on cortical granule–plasma membrane fusion and is required for actin assembly. Compartment mixing triggers actin assembly, at least in part, through diacylglycerol (DAG), which incorporates into the cortical granule membranes from the plasma membrane after cortical granule–plasma membrane fusion. DAG, in turn, directs long-term recruitment protein kinase Cβ (PKCβ) to exocytosing cortical granules, where it is required for activation of Cdc42 localized on the cortical granules. The results demonstrate that mixing of two membrane compartments can direct local actin assembly and indicate that this process is harnessed during Xenopus egg cortical granule exocytosis to drive compensatory endocytosis.
Local actin assembly is associated with processes that entail insertion of new membrane into the plasma membrane in many systems, ranging from phagocytosis1 to cell locomotion2, 3. A particularly striking example of coupling between exocytosis and local actin assembly is provided by regulated exocytosis in eggs4 and pancreatic acinar cells5. In these cells, actin ‘coats’ assemble specifically around exocytosing secretory granules, where they stabilize these compartments and/or promote their retrieval4, 5. Moreover, actin accumulates around exocytosing secretory granules in a variety of other cell types, suggesting that such actin coating represents a conserved mechanism for driving compensatory endocytosis6.
It is not known how exocytosis is coupled to local actin assembly. One possibility is that local actin assembly has the same proximal trigger as exocytosis itself — for example, regulated exocytosis is typically triggered by an increase in intracellular free calcium. As calcium has a number of targets that are known to regulate the actin cytoskeleton (for example, gelsolin), this is an attractive possibility.
However, it is also possible that local actin polymerization is more directly entrained to exocytosis. In particular, it has been proposed that compartment mixing on fusion of the secretory granules with the plasma membrane triggers local actin assembly, that is, the admixture created by union of components of the plasma membrane and the secretory granule generates a unique membrane environment that promotes local actin assembly6. In this situation, an increase in intracellular free calcium is not the proximal trigger for actin assembly per se, but instead works indirectly, by triggering exocytosis.
Here, we have examined the compartment mixing hypothesis during regulated exocytosis of cortical granules in Xenopus eggs. We show that the components of the cortical granule membranes and plasma membrane mix and that this mixing is essential for assembly of actin coats. We then identify plasma membrane DAG as a key signal that incorporates specifically into the cortical granules that undergo exocytosis and show that it is crucial for actin-coat assembly. DAG directs long-term recruitment of PKCβ to exocytosing cortical granules, where it is required for the activation of Cdc42 that is localized on the cortical granules. Based on these and other results, we conclude that fusion of two different membrane compartments can act as a proximal trigger for local actin assembly.
RESULTS
Plasma membrane and cortical granule membranes mix when cortical granules exocytose
To study actin-coat assembly, eggs microinjected with fluorescent actin probes were subjected to uncaging of caged inositol 1,4,5-triphosphate (InsP3) to elevate calcium and trigger cortical-granule exocytosis during imaging4. Exocytosis was triggered in the presence of Texas red–dextran, which filled the cortical-granule compartments on fusion with the plasma membrane and were observed as red discs (Fig. 1a and see Supplementary Information, Movie 1), allowing visualization of exocytosing cortical granules. As previously observed4, actin coats assembled around cortical granules only after exocytosis (as indicated by Texas red–dextran filling; Fig. 1a and see Supplementary Information, Movie 1). z-views revealed that actin coats assembled specifically on cortical-granule membranes, but not on the plasma membrane immediately adjacent to exocytosing cortical granules (Fig. 1b), implying that the actin assembly signal is confined to the exocytosing cortical granule.
Figure 1.

Actin-coat assembly occurs after plasma membrane and cortical granule membrane incorporation on cortical granule exocytosis. (a) Subcortical view showing that actin coats (Alexa488–G-actin, arrowhead) assemble around the exocytosing cortical granules after cortical granule exocytosis (Texas Red–dextran, arrow). (b) z-view showing that actin (Utr1–261–mRFP) assembly occurs on cortical granule membranes (arrowhead) on cortical granule exocytosis (Alexa647–dextran) at 0 s, but not on the cortex (arrow). (c) Subcortical images showing that plasma membrane components (F-eGFP) are incorporated into the cortical granule membrane on cortical granule exocytosis (Alexa647–dextran, arrowhead), before actin-coat assembly (Utr1–261–mRFP, arrow). (d) z-view showing that plasma membrane (F-eGFP, green) incorporates into cortical granule membranes on cortical granule exocytosis (Texas Red–dextran) at 0 s. (e) Quantification of F-eGFP recruitment to exocytosing cortical granules (n = 16; 100% is maximum signal intensity before cortical granule constriction), where cortical granule exocytoses at 1.5 s. Signal intensity shown at 0 s represents basal signal intensity. The error bars represent s.e.m. (f, g) Subcortical images showing that BotA microinjection blocks cortical granule exocytosis (the absence of Texas Red–dextran filled compartment), and prevents (f) plasma membrane (F-eGFP) incorporation into the cortical granule membrane, as well as actin coat assembly (g; Alexa488–G-actin). InsP3 uncaging occurred at 0 s in a, f and g. Out, outside of cell; in, inside of cell. The scale bars represent 5 μm in a, f and g, 3 μm in b and 2 μm in c and d.
If the trigger for coat assembly is dependent on compartment mixing, components of the plasma membrane and cortical-granule membrane must be capable of mixing after exocytosis. To examine this prediction, exocytosis was triggered in cells expressing farnesylated-eGFP (F-eGFP), which labels the plasma membrane. F-eGFP incorporated into cortical-granule membranes well before actin-coat assembly (Fig. 1c), demonstrating that the plasma membrane contents do mix with cortical-granule membranes following exocytosis. z-views further revealed that F-eGFP was incorporated into the cortical granule membranes during cortical granule–plasma membrane fusion (Fig. 1d). Importantly, this incorporation was limited to exocytosing cortical granules and occurred gradually rather than instantly (Fig. 1e), indicating that mixing of the two compartments is not completely free.
A second prediction of the compartment-mixing hypothesis is that blocking cortical granule–plasma membrane fusion should prevent actin coat assembly. To examine this prediction, botulinum toxin A (BotA), which blocks exocytosis in many different systems7, including Xenopus oocytes8, was used. BotA blocked cortical-granule exocytosis, as demonstrated by failure of both dextran filling and incorporation of F-eGFP into cortical granule membranes (Fig. 1f). Consistent with the compartment-mixing hypothesis, BotA also completely suppressed actin assembly in response to InsP3 uncaging (Fig. 1g). These results were specific, in that denatured BotA did not block cortical-granule exocytosis or actin-coat assembly (see Supplementary Information, Fig. S1a). In contrast with cortical-granule exocytosis and actin-coat assembly, other events characteristic of InsP3 uncaging occurred normally in BotA-injected cells (see below). Therefore, not only does mixing of cortical granule–plasma membrane components occur during cortical-granule exocytosis, this mixing is somehow essential for subsequent actin-coat assembly.
DAG incorporation into the cortical-granule membrane on exocytosis is crucial for actin-coat assembly
Compartment mixing-dependent coat assembly implies that one or more signals diffusing between the plasma membrane and cortical granules initiates actin polymerization on the cortical granules. Although the plasma-membrane lipid, phosphatidylinositol 4,5-bisphosphate (PtdIns(4,5)P2) has been shown to regulate actin assembly9, perturbation of PtdIns(4,5)P2 by several means did not perturb actin-coat assembly (H.E.Y., unpublished observations). Therefore, we examined another promising candidate — the plasma-membrane lipid DAG, which increases in abundance during egg activation10,11 and activates PKCβ11, which has been implicated in actin assembly in Xenopus eggs12.
If DAG represents a key signal for coat assembly, it should incorporate into the cortical granule following exocytosis. eGFP fused to the DAG-binding C1 domain from PKCβ (eGFP–C1) was used to label DAG. z-views revealed that DAG was elevated in the plasma membrane on InsP3 uncaging (Fig. 2a and see Supplementary Information, Fig. S1b), even before cortical granule exocytosis (Fig. 2a). More importantly, immediately after cortical granule–plasma membrane fusion, DAG incorporated into cortical granule membranes as observed in both z-views (Fig. 2a) and subcortical views (Fig. 2b and see Supplementary Information, Movie 2). To verify that the recruitment of eGFP–C1 is due to its binding to DAG, we generated a mutant eGFP–C1 (eGFP–C1mut) previously shown to be incapable of DAG binding13,14. eGFP–C1mut was not recruited to exocytosing cortical granules (Fig. 2c and see Supplementary Information, Movie 3), indicating that eGFP–C1 recruitment is DAG specific. Furthermore, co-imaging of eGFP–C1 and actin during cortical-granule exocytosis indicated that DAG incorporation into exocytosing cortical-granule membranes occurred before actin assembly (Fig. 3a), consistent with the hypothesis that DAG incorporation is required for actin-coat assembly. Quantification of eGFP–C1 signal intensity showed that DAG incorporation into the cortical-granule membrane continued to increase after cortical granule–plasma membrane fusion (Fig. 3b), similarly to that of F-eGFP (Fig. 1e), suggesting that DAG is incorporated from the plasma membrane into cortical-granule membranes. To further show that cortical granule–plasma membrane compartment mixing is required for DAG incorporation into the cortical granule membrane, DAG recruitment was monitored after BotA microinjection. BotA prevented incorporation of DAG into cortical-granule membranes, but not DAG elevation at the plasma membrane (Fig. 3c). Thus, DAG incorporation into the cortical-granule membrane requires cortical granule–plasma membrane compartment mixing.
Figure 2.

Ca2+ elevation triggers DAG generation on the plasma membrane, which incorporates into the cortical granule membrane on cortical granule–plasma membrane fusion. (a) z-view showing that DAG (eGFP–C1) is generated at the plasma membrane on Ca2+ increase and incorporates into the cortical granule membrane during cortical granule–plasma membrane fusion (Texas Red–dextran, arrowhead). (b) Subcortical view showing that DAG (eGFP–C1) is recruited to exocytosing cortical granules only (Texas Red–dextran, arrow), but not to non-exocytosed cortical granules (arrowhead). (c) Subcortical view showing that eGFP–C1mut (non-DAG binding) is not recruited to exocytosing cortical granules (arrowhead). InsP3 uncaging occurred at 0 s in a, b and c. The scale bars represent 2 μm in a and 4 μm in b and c.
Figure 3.

DAG incorporation into cortical granule membranes occurs before actin assembly and is dependent on cortical granule–plasma membrane compartment mixing. (a) Subcortical view showing that DAG (mRFP–C1, red) incorporates into the cortical granule membrane when a cortical granules exocytoses at 0 s, before actin assembly (Alexa488–G-actin, green). (b) Quantification of eGFP–C1 recruitment to exocytosing cortical granules (n = 16; 100% is maximum signal intensity before cortical granule constriction), where the cortical granule exocytoses at 1.5 s. Signal intensity shown at 0 s represents basal signal intensity. The error bars represent s.e.m. (c) z-view showing that DAG (eGFP–C1) levels at the plasma membrane increases on InsP3 uncaging at 0 s, even though it fails to be incorporated into the cortical granule membrane when treated with BotA. The scale bars represent 1 μm in a and 2 μm in c.
If DAG incorporation into cortical-granule membranes is essential for coat assembly, perturbation of DAG should perturb actin-coat assembly. Elevation of DAG at the plasma membrane on calcium increase is dependent on phosphatidylcholine-specific phospholipase D (PLD)10. Therefore, cells were treated with a phosphatidylcholine–PLD inhibitor (C2 ceramide15,16) to reduce DAG generation at the plasma membrane on calcium increase. Consistent with our prediction, C2 ceramide treatment prevented DAG elevation on the plasma membrane on calcium increase (Fig. 4a, b) and reduced the amount of DAG recruited to exocytosing cortical granules (data not shown). In addition, C2 ceramide significantly reduced actin assembly on the exocytosing cortical-granule membranes (Fig. 4c, d and see Supplementary Information, Fig. S2). To further examine whether DAG is necessary for actin-coat assembly, cells were treated with DAG kinase (DGK) inhibitor — this prevents DAG metabolism, thereby allowing more DAG to bind to its downstream target17. Thus, if DAG is required for coat assembly, inhibition of DGK should augment actin assembly. Consistent with this prediction, actin assembly was enhanced in cells treated with DGK inhibitor (Fig. 4c, d and see Supplementary Information, Fig. S2). DAG alone should also trigger actin-coat assembly. To examine this prediction, cells were treated with exogenous DAG (1,2-diocytanoyl-sn-glycerol), to trigger cortical granule exocytosis18,19 instead of uncaging InsP3. Similarly to uncaging InsP3, exogenous DAG induced actin-coat assembly around exocytosing cortical granules (Fig. 4e). Taken together, the results show that DAG incorporation into cortical-granule membranes during cortical-granule exocytosis is essential for actin-coat assembly.
Figure 4.

DAG is required for actin-coat assembly. (a) z-view showing that C2 ceramide treatment inhibits DAG (eGFP–C1) elevation at the plasma membrane on Ca2+ increase. (b) Quantification of DAG intensity on plasma membrane showing the percentage increase in DAG levels after Ca2+ increase when compared with pre-activation levels (n = 12; asterisk indicates P = 0.00047). The error bars represent s.e.m. (c) Subcortical images showing that C2 ceramide treatment reduces actin coat (Alexa488–G-actin) assembly around exocytosing cortical granules (Texas Red–dextran), whereas DGK inhibitor enhances actin-coat assembly. (d) Quantification of the intensity of actin coats at exocytosing cortical granules (n = 20 for control; n = 21 for C2 ceramide; n = 21 for DGK inhibitor). The error bars represent s.e.m. (e) Exogenous addition of DAG induces cortical granule exocytosis (Alexa647–dextran) at 0 s, where PKCβ–eGFP is recruited to the exocytosing cortical granule before actin coat (Utr1–261–mRFP) assembly. The scale bars represent 1 μm in a and 2 μm in c and e.
Fusion with plasma membrane sustains PKCβ recruitment to the cortical granules
PKCs are a major class of DAG effectors20 and we examined PKCβ in detail as it is activated during egg activation11 and has been implicated in actin polymerization in Xenopus eggs12. To monitor PKCβ dynamics, eGFP-labelled PKCβ was used12. PKCβ was rapidly recruited to both exocytosing and non-exocytosing cortical granules on calcium elevation (Fig. 5b and see Supplementary Information, Movie 4). However, after recruitment, two different behaviours for PKCβ–eGFP were observed: PKCβ–eGFP remained on cortical granules that exocytosed (Fig. 5b and see Supplementary Information, Movie 4), but was lost from cortical granules that did not exocytose (Fig. 5b, c and see Supplementary Information, Movie 4).
Figure 5.

PKCβ is transiently recruited to all cortical granules on Ca2+ elevation, but only remains on those that have exocytosed. (a) Schematic representation of the primary structure of PKCβ. The regulatory portion is comprised of C1 and C2 domains, which bind to DAG and phosphatidylserine and/or Ca2+, respectively. The catalytic portion is comprised of C3 and C4 domains, which bind to ATP and substrate, respectively. (b) Subcortical views showing that PKCβ–eGFP is recruited to all cortical granules on InsP3 uncaging at 0 s, but only remains on those that have fused with plasma membrane (Texas Red–dextran, arrow), and disappears from those that have not exocytosed (arrowhead). (c) z-view showing that PKCβ–eGFP disappears from cortical granule that has not exocytosed (the absence of a Texas Red–dextran filled compartment). (d) z-view showing that PKCβ–eGFP is translocated to the plasma membrane on InsP3 uncaging. (e) z-view showing that PKCβC1–C2–eGFP is present on the plasma membrane before InsP3 uncaging. (f) Subcortical views showing that PKCβC1–C2–eGFP is recruited to all cortical granules on InsP3 uncaging at 0 s, but only remains on those that have fused with plasma membrane (Texas Red–dextran, arrow), and disappears from those that have not exocytosed (arrowhead). (g) Subcortical images showing that eGFP–C2 is recruited to cortical granules (arrowhead) on InsP3 uncaging at 0 s before exocytosis. It subsequently disappears from cortical granules regardless of whether the cortical granules have exocytosed (Texas Red–dextran, arrow), or not (asterisk). (h) z-images showing that eGFP–C2 is translocated to plasma membrane on InsP3 uncaging. (i) Subcortical images showing that PKCβC1mut–eGFP (non-DAG binding PKCβ) is recruited to cortical granules (arrowhead) on InsP3 uncaging at 0 s before exocytosis. However, they disappear from cortical granules at later time points regardless of whether the cortical granules have exocytosed (Texas Red–dextran, arrow), or not (asterisk). (j) z-images showing that PKCβC1mut– eGFP is translocated to plasma membrane on InsP3 uncaging. The scale bars represent 4 μm in b, 2 μm in c, 5 μm in d, e and f, and 3 μm in g–j.
These results demonstrated that PKCβ is targeted to the cortical granules in a two-step process. Based on previous studies21,22, we hypothesized that: the initial recruitment of PKCβ to all cortical granules was due to an increase in affinity of the C2 domain for phosphatidylserine on the cortical-granule membrane on calcium elevation; and that the subsequent retention of PKCβ on the exocytosing cortical granules was due to DAG binding by the C1 domain. If this is how PKCβ is recruited, then the C1–C2 domain of PKCβ should be sufficient for correct PKCβ recruitment. Consistent with this, PKCβC1–C2–eGFP was recruited to cortical granules in a manner similar to PKCβ–eGFP (Fig. 5f and see Supplementary Information, Movie 5). The only difference was that PKCβC1–C2–eGFP was present on the plasma membrane before InsP3 uncaging (Fig. 5e), whereas PKCβ–eGFP was present on the plasma membrane only after InsP3 uncaging (Fig. 5d). This difference is probably due to the absence of the pseudo-substrate clamp in PKCβC1–C2–eGFP, which normally maintains an autoinhibitory conformation of PKC in the absence of activators, and prevents it from binding to the membrane21.
As a second test for the PKC recruitment model, the recruitment pattern of eGFP–C2, which lacks the C1 domain and should therefore be uninfluenced by the presence or absence of DAG, was followed. eGFP–C2 was rapidly recruited to all cortical granules, but was not retained on the cortical granules — even those that fused with the plasma membrane (Fig. 5g) and therefore acquired DAG. Similarly to PKCβ–eGFP, eGFP–C2 was recruited to the plasma membrane after calcium increase (Fig. 5h).
The third test of this model involved generating a mutant form of PKCβ–eGFP (PKCβC1mut–eGFP) that is incapable of binding to DAG13,14. Similarly to eGFP–C2, PKCβC1mut–eGFP was rapidly recruited to all cortical granules, but was not retained on the cortical granules, even those that exocytosed (Fig. 5i). PKCβC1mut–eGFP was also present on the plasma membrane after calcium increase (Fig. 5j). Collectively, these results show that the different domains of PKCβ are responsible for its recruitment pattern, with the C2 domain responding to the calcium increase to provide rapid targeting of PKCβ to all cortical granules and the plasma membrane, whereas the C1 domain directs the maintenance of PKCβ selectively on those cortical granules that have undergone exocytosis. Consistent with this model, when exogenous DAG was used to trigger cortical-granule exocytosis, PKCβ was recruited to the exocytosing cortical granules before actin assembly (Fig. 4e).
Perturbation of PKCβ affects actin-coat assembly
The finding that PKCβ is recruited to all cortical granules transiently on calcium increase, but only remains on exocytosing cortical granules where DAG was incorporated (and actin-coat assembly eventually occured), was consistent with the hypothesis that this kinase may be a DAG target required for coat assembly. If PKCβ is the key DAG target, PKCβ perturbation should disrupt normal actin-coat assembly. Consistent with this prediction, overexpression of PKCβ induced hyper-developed actin coats on a subset of exocytosing cortical granules (Fig. 6a and see Supplementary Information, Movie 6) in 71% of the cells (n = 21). Importantly, this phenotype was not observed when PKCβK368R (an ATP-binding mutant23,24) was overexpressed (Fig. 6a and see Supplementary Information, Movie 7), indicating that the kinase activity of PKCβ is essential for coat assembly.
Figure 6.

Perturbation of PKCβ affects actin-coat assembly. (a) Subcortical images showing that overexpression of PKCβ induces formation of thicker, longer-lived actin coats (Alexa488–G-actin, arrows) on some exocytosing cortical granules (Texas Red–dextran), whereas others (arrowheads) have normal coats. In contrast, actin coats (Alexa488–G-actin) assemble normally (arrowheads) in PKCβK368R-overexpressing cells. InsP3 uncaging occurred at 0 s. (The background level of actin in the PKCβ-overexpressing figure is intentionally reduced so that the hyperdeveloped actin coats would not seem too saturated in green. Before adjustment, the actin background is comparable in both PKCβ-overexpressing and PKCβK368R-overexpressing cells.) (b) Subcortical images showing that exocytosing cortical granules (Texas Red–dextran) in cells expressing PKCβC1–C2 remain trapped at the plasma membrane over time with little or no actin coat (Alexa488–G-actin) assembly. Coexpression with full-length (FL) PKCβ partially rescues the phenotype, where assembly of actin coat (Alexa488–G-actin, arrowhead) is slightly delayed compare with control (arrowhead). (c) z-view showing the exocytosing cortical granule remains trapped at the plasma membrane when expressing PKCβC1–C2. (d) Quantification of time taken to retrieve cortical granule membranes (n = 117 for control; n = 90 for PKCβC1–C2; n = 89 for PKCβC1–C2with full-length PKCβ; P = 10−41 for control versus PKCβC1–C2; P = 10−25 for PKCβC1–C2 versus PKCβC1–C2 with full-length PKCβ). (e) Quantification of the intensity of actin coats at exocytosing cortical granules before coat compression. PKCβC1– C2 + FL1 and FL2 represent two levels of rescue in different cells. (n = 18 for control; n = 17 for PKCβC1–C2; n = 12 for PKCβC1–C2 with FL1; n = 5 for PKCβC1–C2 with FL2. The error bars represent s.e.m. in d and e. The scale bars represent 4 μm in a, 3 μm in b, and 2 μm in c.
If actin-coat assembly is initiated by PKCβ, inhibition of PKCβ should inhibit coat assembly. To selectively inhibit PKCβ without affecting other PKC isozymes, PKCβC1–C2 was expressed in Xenopus eggs to function as an isoform-specific dominant negative25–27. PKCβC1–C2 was used instead of PKCβK368R because higher expression level could be obtained for PKCβC1–C2–eGFP as compared with PKCβK368R–eGFP when equal amounts of RNA was microinjected into the cells (194 ± 46% more PKCβC1–C2–eGFP compared with PKCβK368R–eGFP; three independent experiments, 18 cells per group; see Supplementary Information, Fig. S3a). Expression of PKCβC1–C2 significantly slowed cortical-granule membrane retrieval (Fig. 6b–d) and actin-coat assembly (Fig. 6b, e and see Supplementary Information, Fig. S3b). To confirm the specificity of this phenotype, full-length PKCβ was coexpressed in eggs expressing PKCβC1–C2 and partially rescued the phenotype induced by PKCβC1–C2 expression (Fig. 6b, d, e and see Supplementary Information, Fig. S3b). Two kinetically distinct types of rescue were observed: near complete rescue in which actin accumulation began just as quickly as controls (magenta line, Fig. 6e) and less complete rescue where the onset of actin assembly was delayed relative to controls, but still occurred much sooner than in cells expressing PKCβC1–C2 alone (yellow line, Fig. 6e). The ability of full-length PKCβ to rescue the phenotype induced by PKCβC1–C2 indicates that PKCβC1–C2 does function as a specific inhibitor of PKCβ and actin-coat assembly. If, instead, it functioned by suppressing the activity of another calcium, phosphatidylserine and DAG-dependent enzyme, coexpression with full-length PKCβ would have made the phenotype more pronounced, rather than less. Furthermore, expression of the kinase-truncated construct of a different PKC does not affect actin-coat assembly (H.E.Y., unpublished data), further indicating that PKCβC1–C2 is a specific inhibitor of PKCβ. Taken together, these results indicate that PKCβ is the DAG target required for actin-coat assembly.
PKCβ functions upstream of Cdc42 to initiate actin-coat assembly
As actin-coat assembly is Cdc42-dependent4, we wanted to determine whether PKCβ acted through Cdc42 to initiate actin-coat assembly. To monitor active Cdc42 recruitment, we expressed wGBD (the Cdc42-binding domain of N-WASP)–eGFP, a probe that binds specifically to active (GTP-bound) Cdc42 (ref. 28). If PKCβ facilitates actin-coat assembly in a Cdc42-dependent manner, perturbation of PKCβ should perturb active Cdc42 recruitment on exocytosing cortical granules. When PKCβ was overexpressed, Cdc42 activation on exocytosing cortical granules was enhanced (Fig. 7a, b). In contrast, when dominant negative PKCβC1–C2 was expressed, Cdc42 activation was reduced (Fig. 7a, b). Thus, PKCβ acts upstream of Cdc42 to initiate actin-coat assembly.
Figure 7.
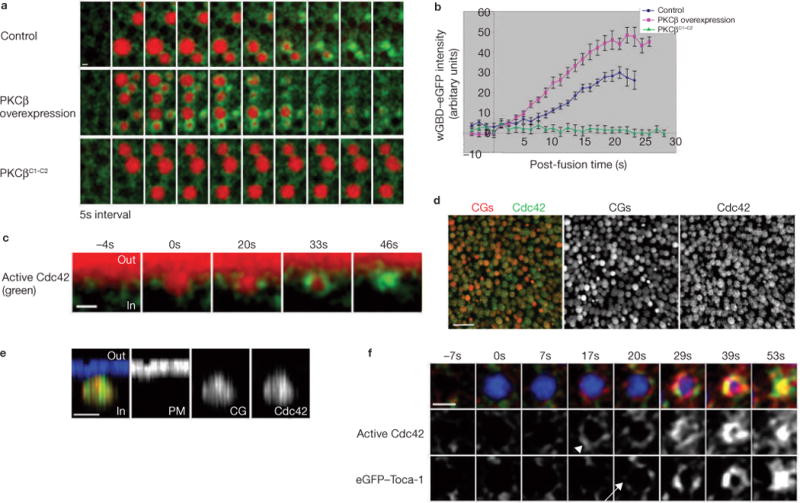
Perturbation of PKCβ affects activation of Cdc42, which is localized on cortical granule membranes before egg activation. (a) Subcortical images showing that Cdc42 activation (wGBD–eGFP) on exocytosing cortical granules (Texas Red–dextran) is enhanced in cells overexpressing PKCβ, but reduced in cells expressing PKCβC1–C2. (b) Quantification of active Cdc42 recruitment to exocytosing cortical granules (n = 15 for control; n = 14 for PKCβ overexpression; n = 15 for PKCβC1–C2). The error bars represent s.e.m. (c) z-view showing that Cdc42 is activated (wGBD–eGFP) on cortical granule membrane when cortical granule exocytoses (Texas Red–dextran), but not on the cortex. (d) Low magnification of en face view showing immunofluorescence staining of Myc–Cdc42 (green) localizes on the cortical granules (red) before egg activation. (e) High magnification of z-view showing Myc–Cdc42 is localized only on cortical granules (red), but not on the plasma membrane (blue) before egg activation. (f) eGFP–Toca-1 (arrow) is recruited to the exocytosing cortical granule (Alexa647–dextran) after Cdc42 activation (wGBD–RFP, arrowhead). 0 s indicates time at which cortical granule exocytoses in c and f. The scale bars represent 1 μm in a, c and e, 10 μm in d and 2 μm in f.
z-views indicated that, similarly to actin assembly, Cdc42 was activated only on exocytosing cortical granules (Fig. 7c). In principle, this could reflect either recruitment of active Cdc42 specifically to exocytosing cortical granules, or activation of Cdc42 that is localized to cortical granules before induction of exocytosis. To distinguish between these hypotheses, localization of Cdc42 itself was examined by immunohistochemistry. Strikingly, comparison between the distribution of Cdc42 and a cortical-granule marker revealed that, in unactivated eggs, Cdc42 was highly concentrated on cortical granules (Fig. 7d). Moreover, triple labelling of Cdc42, cortical granules and the plasma membrane showed that comparatively little Cdc42 was located on the plasma membrane itself (Fig. 7e).
Recently, Toca-1 (a protein that binds to both Cdc42 and N-WASP) was shown to function downstream of Cdc42 to activate N-WASP (a Cdc42-activated protein that promotes actin assembly) in Xenopus egg extracts29. As active Cdc42 and N-WASP are recruited to exocytosing cortical granules for actin-coat assembly4, we examined whether Toca-1 is also recruited. eGFP–Toca-1 was expressed in Xenopus eggs and its recruitment was compared with active Cdc42. eGFP–Toca-1 was recruited to the exocytosing cortical granules 2.86 ± 0.30 s (mean ± s. e.m.; n = 36) after Cdc42 activation (Fig. 7f), consistent with a model where Cdc42 activation triggers recruitment of Toca-1 to the exocytosing cortical granules to activate N-WASP. Unfortunately, further attempts to determine the roles of Toca-1 in actin-coat assembly were inconclusive. Specifically, three putative Toca-1 dominant negatives (Toca-1W517K, Toca-1105–477, Toca-1245–477) failed to be properly targeted to exocytosing cortical granules (data not shown). In addition, microinjection of a Toca-1 antibody shown to immunodeplete Toca-1 from egg extracts29 did not prevent coat assembly (data not shown). Thus, further investigation is needed to clarify the exact roles of Toca-1 in actin-coat assembly.
DISCUSSION
The results of this study demonstrate that local actin assembly can be triggered by the mixing of membranes from two different compartments — cortical secretory granules and the plasma membrane. Although many of the players are distinctly different, this compartment mixing triggers the sequential recruitment of upstream proteins required to initiate actin-coat assembly in a manner reminiscent of the sequential recruitment of actin regulators during receptor-mediated endocytosis30,31. As previously proposed6, a compartment mixing-dependent mechanism for local actin assembly not only explains F-actin localization specifically to exocytosing secretory granules in fish eggs32, frog eggs4, pancreatic acinar cells5 and alveolar epithelial cells33, but also has a clear functional rationale — restriction of actin assembly to the surfaces of exocytosing secretory granules following a general exocytotic signal (that is, calcium increase), ensures that F-actin will not limit subsequent exocytotic events. Because F-actin is known to function as a physical barrier to membrane fusion34, wholesale actin assembly in response to calcium elevation would be expected to suppress exocytosis in situations where not all secretory granules fuse with the plasma membrane simultaneously. Likewise, actin assembly that is entrained to the initial trigger for fusion would be expected to severely limit the amount of material released in systems, such as acinar cells, that exhibit both compound exocytosis and actin coating of exocytosing secretory granules. In contrast, the compartment-mixing mechanism described here would allow multiple fusion events to occur in an asynchronous manner, particularly as there is a built in ‘fuse’ — the ~12–16 s between fusion and the onset of local actin assembly.
The results also identify DAG as a key signal for compartment mixing-dependent actin assembly, and show that it directs actin assembly by promoting sustained recruitment of PKCβ that, in turn, promotes local activation of Cdc42 (Fig. 8). The involvement of DAG and PKCβ in Cdc42-dependent actin assembly is consistent with previous work showing that Xenopus egg activation entails DAG generation10,11 and PKCβ activation11, as well as the observation that the DAG mimic, PMA (phorbol 12-myristate 13-acetate), can promote actin assembly in Xenopus egg extracts12.
Figure 8.

Schematic representation of how compartment mixing results in actin-coat assembly. (a) Timeline showing the recruitment of different signalling molecules (black) with respect to the different events (red) during cortical granule (CG) exocytosis or endocytosis. (b) On calcium (green dot) increase, DAG (orange) is generated in the plasma membrane (PM, light-green line). Calcium binding results in the translocation of PKCβ (red) to the cortical granule (blue) and plasma membrane. On cortical granule–plasma membrane fusion, DAG from the plasma membrane incorporates into the cortical granule membranes, which sustains the recruitment of PKCβ at the cortical granule membrane. (c) Schematic representation summarizing how calcium elevation triggers different events that lead to actin-coat assembly (based on the results presented here and in ref. 4).
More generally, the results obtained from the dissection of different PKCβ domains explain how the molecular properties of a conventional PKC lead to spatio-temporal control of a specific process — conventional PKCs are thought to be targeted and activated in a stepwise manner, with calcium elevation directing targeting PKC to the plasma membrane through the C2 domain, and subsequent DAG binding resulting in retention and full activation of the PKC through the C1 domain21,22. Our results confirm this basic scheme and show how it promotes coat assembly: the initial recruitment event ensures rapid PKC targeting, whereas the retention event ensures local specificity of PKC-induced actin assembly.
Two additional points emerge from this work: first, the recruitment of Toca-1 to exocytosing cortical granules after Cdc42 activation, but before actin-coat assembly, provides direct in vivo support for a recent model of N-WASP activation29; and second, although the plasma membrane provides DAG during compartment mixing, it seems that the cortical granules provide Cdc42. This explains why Cdc42 activation and the resultant actin assembly are largely confined to the exocytosing cortical granules, even though DAG and PKCβ are elevated on the plasma membrane as well as the cortical granules. Inactive Cdc42 is itself concentrated on the cortical granules rather than the plasma membrane. Thus, in contrast to the canonical pathway for Rho GTPase activation, where the inactive proteins are targeted from the cytoplasm to membrane compartments after activation, the results indicate that, in this case, the GTPase is concentrated at its site of action in the inactive form and then activated there.
METHODS
Preparation of probes
Utr1–261–mRFP, provided by B. Burkel (University of Wisconsin-Madison, Madison, WI), is a monomeric red fluorescent protein (mRFP) fused with the calponin homology domain of utrophin (B. Burkel & W.M.B, unpublished observations). F-eGFP was provided M. V. Danilchik (Oregon Health & Science University, Portland, OR). Myc–Cdc42 was provided by T. Gomez (University of Wisconsin–Madison, Madison, WI). Xenopus PKCβ (PKCII in ref. 35) was cloned from cDNA obtained from stage 4 oocytes. Xenopus Toca-1 (BC110949) was purchased from ATCC (Manassas, VA).
All subclonings and point mutations were performed using PCR. The ATP-binding mutant of PKCβ has a mutation at its putative ATP binding site, where Lys 368 was mutated to arginine23,24. To generate the DAG-binding mutant of C1 domain of PKCβ, the conserved cysteine residues (Cys 64, Cys 67, Cys 129 and Cys 132, where amino-acid residues are numbered with respect to full-length PKCβ) that are essential for DAG binding13,14 were mutated to alanine.
All PKCβ and Toca-1 constructs were cloned into custom pCS2 vector, pCS2–eGFP vector4, or pCS2–mRFP vector (mRFP was provided by R. Tsien (University of California–San Diego, San Diego, CA) and subsequently cloned into pCS2 vector). Full-length PKCβ and its C1–C2 domain were cloned upstream of the eGFP; C1 domain and C2 domain from PKCβ were cloned downstream of the eGFP; Toca-1 was cloned downstream of the eGFP. Toca-1W517K has a mutation at its putative N-WASP binding site, where Trp 517 was mutated to lysine (ref. 29); Toca-1105–477 and Toca-1245–477 are truncates of Toca-1 at amino acids 105–477 and 245–477 respectively, where the putative N-WASP binding domain was removed29. All probes were transcribed in vitro into RNA using the SP6 mMessage mMachine Kit (Ambion, Austin, TX) for microinjection into oocytes for expression.
Egg procurement and microinjection
Oocytes were obtained from adult Xenopus females, as described previously4, and stored in Barth solution (87,4mM NaCl, 1 mM KCl, 2.4 mM NaHCO3, 0.82 mM MgSO4, 0.6 mM NaNO3, 0.7 mM CaCl2 and 10 mM HEPES at pH 7.4), with 0.1 mg ml−1 gentamycin and 6 μg ml−1 tetracycline. Microinjections were performed as described previously4. All oocytes were injected with NPE–caged InsP3 (Molecular Probe, Carlsbad, CA) to a final intracellular concentration of 10 μM if eggs were activated by uncaging InsP3. Proteins probes or inhibitors were injected to attain final intracellular concentrations as follows: 80 μg ml−1 Alexa 488–G-actin (Molecular Probe); 5 mg ml−1 Toca-1 antibody (provided by M. Kirschner, Harvard Medical School, Boston, MA); 260 μM BotA (provided by T. Martin, University of Wisconsin–Madison, Madison, WI); or 40 μg ml−1 BotA (Sigma, St Louis, MO). Capped mRNA were injected to final intracellular concentrations as follows: 4 μg ml−1 F-eGFP; 80 μg ml−1 Utr1–261–mRFP; 26.4 μg ml−1 wGBD–eGFP; 200 μg ml−1 eGFP–Toca-1; 250 μg ml−1 Myc–Cdc42; 320 μg ml−1 full-length PKCβ (wild type and ATP-point mutant); 200 μg ml−1 PKCβC1–C2; 240 μg ml−1 full-length PKCβ–eGFP (wild type and C1mut); 240 μg mL−1 eGFP–C1 (C1 domain of PKCβ, wild type and point mutant); 80 μg ml−1 eGFP–C2 (C2 domain of PKCβ) and 160 μg ml−1 PKCβC1–C2–eGFP. The concentration of F-eGFP and eGFP–C1 used did not alter cortical-granule membrane retrieval (see Supplementary Information, Fig. S4). When higher concentrations of F-eGFP and PKCβC1–C2–eGFP were used, cortical-granule membrane retrieval was perturbed (data not shown). Therefore, the concentrations were titrated so that the eGFP-tagged proteins could be detected without perturbing cortical-granule membrane retrieval. When higher concentrations of PKCβC1–C2 were used, cortical-granule exocytosis was often inhibited18. As PKCβC1–C2–eGFP is approximately twice the size of untagged C1–C2, the molar concentration of untagged C1–C2 injected was approximately twice that of PKCβC1–C2–eGFP, explaining why 160 μg ml−1 PKCβC1–C2–eGFP did not induce a phenotype, but 200 μg ml−1 PKCβC1–C2 did. Similarly, PKCβ–eGFP is approximately 1.4 times the size of untagged PKCβ, thus the molar concentration of injected untagged PKCβ was approximately twice PKCβ–eGFP, explaining why PKCβ–eGFP did not induce a phenotype, but PKCβ did. All microinjections were performed at least 4 h before induction of meiotic maturation, which was triggered by incubating oocytes with 5 μg ml−1 progesterone for 8–14 h4.
Cell manipulation and live imaging
Single-plane, time-lapse imaging was performed using a Zeiss Axiovert 100 M microscope (Carl Zeiss, Thornwood, NY) with Bio-Rad Lasersharp Confocal software. Eggs were mounted and imaged with either neutral Texas Red–dextran (relative molecular mass (Mr) 3,000K) or Alexa 647–dextran (Mr 10,000K; Molecular Probe) to facilitate visualization of exocytosing cortical granules4. While imaging, egg activation was triggered by focusing UV light onto the egg cortex for 3–5 s to photolyse NPE-caged InsP3 (Molecular Probes). When endogenous DAG (1,2-Diocytanoyl-sn-glycerol; Biomol, Plymouth Meeting, PA) was used to activate cortical-granule exocytosis, cells were mounted in the presence of Alexa 647–dextran containing a final concentration of 7 μg ml−1 DAG, freshly diluted from stock. When C2 ceramide (Calbiochem, San Diego, CA) was used to inhibit PLD15,16, cells were incubated in 50 μg ml−1 C2 ceramide for 1–2 h before imaging, and mounted in the presence of Texas Red–dextran containing 8 μg ml−1 C2 ceramide during imaging. When the DGK inhibitor R59949 (Calbiochem) was used, cells were incubated in 80 μM R59949 for at least 1 h before imaging, and mounted in the presence of Texas Red–dextran containing 13 μM R59949 during imaging. Movies were generated with Volocity 3.1 software (Improvision, Lexington, MA). Montages were subsequently made with Adobe Photoshop 7.0. All movies and montages shown are representatives of experiments repeated at least three times.
Data quantification and statistical analysis
NIH Object-Image 2.10 or ImageJ 1.34s software was used to measure fluorescence intensities. When measuring the signal intensity of F-eGFP, eGFP–C1, active Cdc42 and actin around exocytosing cortical granules, average signal intensity was measured by first carefully outlining the circumference of the exocytosing cortical granule to define the region of interest. Background signal intensity was then subtracted from the raw signal intensity of the region of interest. The F-eGFP and eGFP–C1 signal around the cortical granules (Figs 1e and 3b) were normalized against the maximum signal intensity (defined as 100%) obtained before constriction of the exocytosing compartments. When actin intensity was measured around exocytosing cortical granules in cells where PKCβ was perturbed (Fig. 6e), actin intensity was measured before constriction of the exocytosing compartments as coat constriction may result in apparent further enhancement of actin-coat intensity. To further illustrate that actin-coat assembly was perturbed in the experimental groups, another representation for the actin intensity is shown in the Supplementary Information, Fig. S3b — total actin intensity was measured in the circular area, defined as the area that covered the entire cortical granules at the beginning of cortical granule exocytosis. Average background signal intensity was subtracted from the raw signal intensity measured in the fixed area to obtain net signal intensity. The net signal intensity was then multiplied by the area of interest to give the ‘total signal’. The rationale is that this total signal intensity should be more robust against the apparent increase of signal intensity due to constriction (that is, if the increase of signal intensity on constriction is strictly due to constriction, then the total signal intensity represented here should remain unchanged). The total signal intensity shown in the Supplementary Information, Fig. S2c, was measured in similar way.
To measure plasma-membrane signal intensity of eGFP–C1 (Fig. 4b and see Supplementary Information, S1b), z-view images were collected. eGFP–C1 signals on the plasma membrane was measured and corrected with background signal intensity. In the Supplementary Information, Fig. S1b, signal intensity was normalized against the maximum signal intensity of eGFP–C1 after calcium increase (defined as 100%).
Cortical granule-membrane retrieval time was the time in which the dextran-filled compartments existed. Statistical analysis was performed using Excel. Two-tail Student’s t-test was used to compare whether there was significant difference between two sets of data when appropriate.
Immunofluorescence staining of Cdc42
Oocytes injected with Myc–Cdc42 were induced to undergo meiotic maturation. On maturation, cell-surface proteins were biotinylated by incubating cells with 1 mg ml−1 sulfo-NHS–SS–Biotin (Pierce, Rockford, IL) in Barth solution for 1 min, then rinsed with Barth solution and then with PBS. Cells were then fixed in buffer containing 3.7% paraformaldehyde, 0.05% gluteraldehyde, 0.1% Triton X-100, 100 mM KCl, 150 mM sucrose, 3 mM MgCl2, 10 mM HEPES for 30 min. Fixed cells were washed with PBS for 1 h, quenched in PBS containing 250 mM NaBH4 for 1 h, washed with TBS containing 0.1% NP-40 (TBSN), bisected and blocked in TBSN containing with 5 mg ml−1 BSA overnight at 4 °C. All subsequent steps were carried at 4 °C. Samples were then incubated with Alexa 680-conjugated streptavidin (Molecular Probe) for 1 h, anti-Myc 9E10 antibody (Santa Cruz, Santa Cruz, CA) and rhodomaine-dolichos-biflorus-agglutinin (Vector Lab, Burlingame, CA) for a day. After a one day wash with TBSN–BSA, samples were incubated with anti-mouse Oregon green (Molecular Probe) for one day, washed with TBSN for one day. Samples were then mounted and viewed on the confocal laser-scanning microscope.
Immunoblotting
Oocytes injected with 80 μg ml−1 PKCβC1–C2–eGFP or 80 μg ml−1 PKCβK368R–eGFP were induced to undergo meiotic maturation. Eggs were homogenized with buffer36 containing 10 mM HEPES, 1 mM EGTA, 0.25 M sucrose, 2 mM MgCl2 at pH 7.4, supplemented with 2.5 mM DTT and protease inhibitors immediately before use at 4 °C. Homogenates were centrifuged at 14,000g for 5 min at 4 °C. Supernatant was separated on a SDS–PAGE and transferred to nitrocellulose. Immunoblotting was performed using primary anti-eGFP antibody (JL-8; Clontech, Mountain View, CA) or anti-tubulin (DM1A; Sigma), and secondary anti-mouse coupled to HRP (Promega, Madison, WI). Blots were developed using ECL western blotting substrate (Pierce).
Supplementary Material
Figure S1 (a) Denatured BotA does not block CG exocytosis or actin coat assembly. Subcortical images showing that actin coat (Alexa488 G-actin, arrowhead) assembles around the exocytosing CGs (TR-dextran, arrow) normally when egg is microinjected with denatured BotA. IP3 uncaging occurred at 0s. (b) DAG increases on the PM upon Ca2+ elevation. Quantification of eGFP-C1 signal on the PM (n = 6; error bar = SEM; 100% is the maximum eGFP-C1 signal on PM).
Figure S2 Perturbation of DAG perturbs actin coat assembly. (a & b) Single- channel representations for Fig. 4c where (a) is showing the exocytosing CGs (TR-dextran) and (b) the assembly of actin coat (Alexa488 G-actin). Notice that DGK inhibition enhances actin coat assembly (Alexa488 G-actin); C2 ceramide treatment reduces actin coat assembly. (c) Quantification of actin coat intensity when treated with C2 ceramide or DGK inhibitor. Actin intensity is shown as total actin intensity in a given area (n = 20 for control, n = 21 for C2 ceramide, n = 21 for DGK inhibitor; error bar = SEM).
Figure S3 Perturbation of PKCβ perturbs actin coat assembly. (a) Western blot showing the expression level of C1-C2-eGFP and PKCβK368R-eGFP in cells injected with equal final intracellular concentration (80 μg/mL) of the respective RNA. (b) Quantification of actin coat intensity in cells expressing PKCβ C1-C2 or C1-C2 + FL PKCβ. Actin intensity is shown as total actin intensity in a given area. PKCβ C1-C2 + FL (1) and (2) represent two levels of rescue in different cells. (n = 18 for control, n = 17 for C1-C2, n = 12 for C1-C2 with FL PKCβ (1); n = 5 for C1-C2 with FL PKCβ (2); error bar = SEM).
Figure S4 Expression of eGFP-C1 or F-eGFP does not affect membrane retrieval time. Quantification of time taken to retrieve exocytosing CGs in cells expressing caged IP3 alone (control; n = 33), eGFP-C1 + caged IP3 (n = 35); or F-eGFP + caged IP3 (n = 31). (p = 0.16 for control vs eGFP-C1; p = 0.088 for control vs F-eGFP).
Video 1 Subcortical view of actin coat assembly during CG exocytosis. Corresponds to Fig. 1a. Actin coats (Alexa 488 actin, green) assembles around exocytosing CGs (TR-dextran, red) after CG-PM fusion. 21μm × 21μm. Frames are 1.5s apart; 12 frames per second. Total length of movie is 114s.
Video 2 Subcortical view of eGFP-C1 (DAG) recruitment during CG exocytosis. Corresponds to Fig. 2b. DAG (eGFP-C1, green) is recruited to exocytosing CGs (TR-dextran, red) upon CG exocytosis, but not to non-exocytosed CGs (non-TR-dextran-filled CGs). 14μm × 10μm. Frames are 1.5s apart; 8 frames per second. Total length of movie is 75s.
Video 3 Subcortical view of eGFP-C1* (non-DAG binding) recruitment during CG exocytosis. Corresponds to Fig. 2c. In contrast to eGFP-C1 (Video 2), eGFP-C1* (non-DAG binding C1 domain, green) is not recruited to exocytosing CGs (TR-dextran, red). 7μm × 17μm. Frames are 1.5s apart; 8 frames per second. Total length of movie is 45s.
Video 4 Subcortical view of PKCβ recruitment during CG exocytosis. Corresponds to Fig. 5b. PKCβ-eGFP (green) is transiently recruited to all CGs (both non-TR-dextran filled vesicles and TR-dextran-filled vesicles) upon IP3 uncaging, but remains only on exocytosing CGs (TR-dextran, red). 13μm × 13μm. Frames are 1.8s apart, 8 frames per second. Total length of movie is 105s.
Video 5 Subcortical view of the recruitment of C1–C2 domain of PKCβ during CG exocytosis. Corresponds to Fig. 5f. Similar to PKCβ-eGFP (video 4), C1-C2-eGFP (green) is transiently recruited to all CGs (both non-TR-dextran filled vesicles and TR-dextran-filled vesicles) upon IP3 uncaging, but remains only on exocytosing CGs (TR-dextran, red). 21μm × 21μm. Frames are 1.5s apart, 8 frames per second. Total length of movie is 112s.
Video 6 Subcortical view showing hyper-developed actin coats in PKCβ-overexpressing cells. Corresponds to Fig. 6a. Overexpression of PKCβ induces formation of thicker, longer-lived actin coats (Alexa488 G-actin, green) on a subset of exocytosing CGs (TR-dextran, red). 13μm × 20μm. Frames are 1.5s apart, 12 frames per second. Total length of movie is 225s.
Video 7 Corresponds to Fig. 6a. Actin coat (Alexa488 G-actin, green) assembles normally around exocytosing CGs (TR-dextran, red) in cells overexpressing PKCβK368R. 18μm × 26μm. Frames are 1.5s apart, 12 frames per second. Total length of movie is 208s.
Acknowledgments
We thank B. Burkel for the Utr1–261–mRFP clone, M. Danilchik for the F-eGFP clone, T. Gomez for the Myc–Cdc42 clone, M. Kirschner for the Toca-1 antibody, T. Martin for providing BotA, and R. Tsien for the mRFP clone. This work is supported by National Institutes of Health (grant GM52932) to W.M.B.
Footnotes
Note: Supplementary Information is available on the Nature Cell Biology website.
COMPETING FINANCIAL INTERESTS
The authors declare that they have no competing financial interests.
References
- 1.May RC, Machesky LM. Phagocytosis and the actin cytoskeleton. J Cell Sci. 2001;114:1061–1077. doi: 10.1242/jcs.114.6.1061. [DOI] [PubMed] [Google Scholar]
- 2.Pollard TD, Borisy GG. Cellular motility driven by assembly and disassembly of actin filaments. Cell. 2003;112:453–465. doi: 10.1016/s0092-8674(03)00120-x. [DOI] [PubMed] [Google Scholar]
- 3.Bretscher MS, Aguado-Velasco C. Membrane traffic during cell locomotion. Curr Opin Cell Biol. 1998;10:537–541. doi: 10.1016/s0955-0674(98)80070-7. [DOI] [PubMed] [Google Scholar]
- 4.Sokac AM, Co C, Taunton J, Bement W. Cdc42-dependent actin polymerization during compensatory endocytosis in Xenopus eggs. Nature Cell Biol. 2003;5:727–732. doi: 10.1038/ncb1025. [DOI] [PubMed] [Google Scholar]
- 5.Nemoto T, Kojima T, Oshima A, Bito H, Kasai H. Stabilization of exocytosis by dynamic F-actin coating of zymogen granules in pancreatic acini. J Biol Chem. 2004;279:37544–37550. doi: 10.1074/jbc.M403976200. [DOI] [PubMed] [Google Scholar]
- 6.Sokac AM, Bement WM. Kiss-and-coat and compartment mixing: coupling exocytosis to signal generation and local actin assembly. Mol Biol Cell. 2006;17:1495–1502. doi: 10.1091/mbc.E05-10-0908. [DOI] [PMC free article] [PubMed] [Google Scholar]
- 7.Montecucco C, Schiavo G. Structure and function of tetanus and botulinum neurotoxins. Q Rev Biophys. 1995;28:423–472. doi: 10.1017/s0033583500003292. [DOI] [PubMed] [Google Scholar]
- 8.Lan JY, et al. Protein kinase C modulates NMDA receptor trafficking and gating. Nature Neurosci. 2001;4:382–390. doi: 10.1038/86028. [DOI] [PubMed] [Google Scholar]
- 9.Takenawa T, Itoh T. Phosphoinositides, key molecules for regulation of actin cytoskeletal organization and membrane traffic from the plasma membrane. Biochim Biophys Acta. 2001;1533:190–206. doi: 10.1016/s1388-1981(01)00165-2. [DOI] [PubMed] [Google Scholar]
- 10.Stith BJ, Woronoff K, Espinoza R, Smart T. sn-1,2-diacylglycerol and choline increase after fertilization in Xenopus laevis. Mol Biol Cell. 1997;8:755–765. doi: 10.1091/mbc.8.4.755. [DOI] [PMC free article] [PubMed] [Google Scholar]
- 11.Larabell CA, Rowning BA, Moon RT. A PKC wave follows the calcium wave after activation of Xenopus eggs. Differentiation. 2004;72:41–47. doi: 10.1111/j.1432-0436.2004.07201005.x. [DOI] [PubMed] [Google Scholar]
- 12.Taunton J, et al. Actin-dependent propulsion of endosomes and lysosomes by recruitment of N-WASP. J Cell Biol. 2000;148:519–530. doi: 10.1083/jcb.148.3.519. [DOI] [PMC free article] [PubMed] [Google Scholar]
- 13.Ono Y, et al. Phorbol ester binding to protein kinase C requires a cysteine-rich zinc-finger-like sequence. Proc Natl Acad Sci USA. 1989;86:4868–4871. doi: 10.1073/pnas.86.13.4868. [DOI] [PMC free article] [PubMed] [Google Scholar]
- 14.Zhang G, Kazanietz MG, Blumberg PM, Hurley JH. Crystal structure of the cys2 activator-binding domain of protein kinase C δ in complex with phorbol ester. Cell. 1995;81:917–924. doi: 10.1016/0092-8674(95)90011-x. [DOI] [PubMed] [Google Scholar]
- 15.Abousalham A, Liossis C, O’Brien L, Brindley DN. Cell-permeable ceramides prevent the activation of phospholipase D by ADP-ribosylation factor and RhoA. J Biol Chem. 1997;272:1069–1075. doi: 10.1074/jbc.272.2.1069. [DOI] [PubMed] [Google Scholar]
- 16.Albert AP, Piper AS, Large WA. Role of phospholipase D and diacylglycerol in activating constitutive TRPC-like cation channels in rabbit ear artery myocytes. J Physiol. 2005;566:769–780. doi: 10.1113/jphysiol.2005.090852. [DOI] [PMC free article] [PubMed] [Google Scholar]
- 17.Topham MK. Signaling roles of diacylglycerol kinases. J Cell Biochem. 2006;97:474–484. doi: 10.1002/jcb.20704. [DOI] [PubMed] [Google Scholar]
- 18.Bement WM, Capco DG. Activators of protein kinase C trigger cortical granule exocytosis, cortical contraction, and cleavage furrow formation in Xenopus laevis oocytes and eggs. J Cell Biol. 1989;108:885–892. doi: 10.1083/jcb.108.3.885. [DOI] [PMC free article] [PubMed] [Google Scholar]
- 19.Grandin N, Charbonneau M. Intracellular pH and intracellular free calcium responses to protein kinase C activators and inhibitors in Xenopus eggs. Development. 1991;112:461–470. doi: 10.1242/dev.112.2.461. [DOI] [PubMed] [Google Scholar]
- 20.Brose N, Rosenmund C. Move over protein kinase C, you’ve got company: alternative cellular effectors of diacylglycerol and phorbol esters. J Cell Sci. 2002;115:4399–4411. doi: 10.1242/jcs.00122. [DOI] [PubMed] [Google Scholar]
- 21.Oancea E, Meyer T. Protein kinase C as a molecular machine for decoding calcium and diacylglycerol signals. Cell. 1998;95:307–318. doi: 10.1016/s0092-8674(00)81763-8. [DOI] [PubMed] [Google Scholar]
- 22.Cho W. Membrane targeting by C1 and C2 domains. J Biol Chem. 2001;276:32407–10. doi: 10.1074/jbc.R100007200. [DOI] [PubMed] [Google Scholar]
- 23.Ohno S, Konno Y, Akita Y, Yano A, Suzuki K. A point mutation at the putative ATP-binding site of protein kinase C alpha abolishes the kinase activity and renders it down-regulation-insensitive. J Biol Chem. 1990;265:6296–6300. [PubMed] [Google Scholar]
- 24.Li W, et al. Expression of an ATP binding mutant of PKC-δ inhibits Sis-induced transformation of NIH3T3 cells. Oncogene. 1996;13:731–737. [PubMed] [Google Scholar]
- 25.Liao L, Ramsay K, Jaken S. Protein kinase C isozymes in progressively transformed rat embryo fibroblasts. Cell Growth Differ. 1994;5:1185–1194. [PubMed] [Google Scholar]
- 26.Cai H, et al. Role of diacylglycerol-regulated protein kinase C isotypes in growth factor activation of the Raf-1 protein kinase. Mol Cell Biol. 1997;17:732–741. doi: 10.1128/mcb.17.2.732. [DOI] [PMC free article] [PubMed] [Google Scholar]
- 27.Jaken S. Protein kinase C isozymes and substrates. Curr Opin Cell Biol. 1996;8:168–173. doi: 10.1016/s0955-0674(96)80062-7. [DOI] [PubMed] [Google Scholar]
- 28.Benink HA, Bement WM. Concentric zones of active RhoA and Cdc42 around single cell wounds. J Cell Biol. 2005;168:429–439. doi: 10.1083/jcb.200411109. [DOI] [PMC free article] [PubMed] [Google Scholar]
- 29.Ho HY, et al. Toca-1 mediates Cdc42-dependent actin nucleation by activating the N-WASP-WIP complex. Cell. 2004;118:203–216. doi: 10.1016/j.cell.2004.06.027. [DOI] [PubMed] [Google Scholar]
- 30.Kaksonen M, Sun Y, Drubin DG. A pathway for association of receptors, adaptors, and actin during endocytic internalization. Cell. 2003;115:475–487. doi: 10.1016/s0092-8674(03)00883-3. [DOI] [PubMed] [Google Scholar]
- 31.Merrifield CJ, Qualmann B, Kessels MM, Almers W. Neural Wiskott Aldrich Syndrome Protein (N-WASP) and the Arp2/3 complex are recruited to sites of clathrin-mediated endocytosis in cultured fibroblasts. Eur J Cell Biol. 2004;83:13–18. doi: 10.1078/0171-9335-00356. [DOI] [PubMed] [Google Scholar]
- 32.Becker KA, Hart NH. Reorganization of filamentous actin and myosin-II in zebrafish eggs correlates temporally and spatially with cortical granule exocytosis. J Cell Sci. 1999;112:97–110. doi: 10.1242/jcs.112.1.97. [DOI] [PubMed] [Google Scholar]
- 33.van Weeren L, de Graaff AM, Jamieson JD, Batenburg JJ, Valentijn JA. Rab3D and actin reveal distinct lamellar body subpopulations in alveolar epithelial type II cells. Am J Respir Cell Mol Biol. 2004;30:288–295. doi: 10.1165/rcmb.2003-0264OC. [DOI] [PubMed] [Google Scholar]
- 34.Eitzen G. Actin remodeling to facilitate membrane fusion. Biochim Biophys Acta. 2003;1641:175–181. doi: 10.1016/s0167-4889(03)00087-9. [DOI] [PubMed] [Google Scholar]
- 35.Chen KH, Peng ZG, Lavu S, Kung HF. Molecular cloning and sequence analysis of two distinct types of Xenopus laevis protein kinase C. Second Messengers Phosphoproteins. 1988;12:251–260. [PubMed] [Google Scholar]
- 36.Gundersen CB, Kohan SA, Chen Q, Iagnemma J, Umbach JA. Activation of protein kinase C η triggers cortical granule exocytosis in Xenopus oocytes. J Cell Sci. 2002;115:1313–1320. doi: 10.1242/jcs.115.6.1313. [DOI] [PubMed] [Google Scholar]
Associated Data
This section collects any data citations, data availability statements, or supplementary materials included in this article.
Supplementary Materials
Figure S1 (a) Denatured BotA does not block CG exocytosis or actin coat assembly. Subcortical images showing that actin coat (Alexa488 G-actin, arrowhead) assembles around the exocytosing CGs (TR-dextran, arrow) normally when egg is microinjected with denatured BotA. IP3 uncaging occurred at 0s. (b) DAG increases on the PM upon Ca2+ elevation. Quantification of eGFP-C1 signal on the PM (n = 6; error bar = SEM; 100% is the maximum eGFP-C1 signal on PM).
Figure S2 Perturbation of DAG perturbs actin coat assembly. (a & b) Single- channel representations for Fig. 4c where (a) is showing the exocytosing CGs (TR-dextran) and (b) the assembly of actin coat (Alexa488 G-actin). Notice that DGK inhibition enhances actin coat assembly (Alexa488 G-actin); C2 ceramide treatment reduces actin coat assembly. (c) Quantification of actin coat intensity when treated with C2 ceramide or DGK inhibitor. Actin intensity is shown as total actin intensity in a given area (n = 20 for control, n = 21 for C2 ceramide, n = 21 for DGK inhibitor; error bar = SEM).
Figure S3 Perturbation of PKCβ perturbs actin coat assembly. (a) Western blot showing the expression level of C1-C2-eGFP and PKCβK368R-eGFP in cells injected with equal final intracellular concentration (80 μg/mL) of the respective RNA. (b) Quantification of actin coat intensity in cells expressing PKCβ C1-C2 or C1-C2 + FL PKCβ. Actin intensity is shown as total actin intensity in a given area. PKCβ C1-C2 + FL (1) and (2) represent two levels of rescue in different cells. (n = 18 for control, n = 17 for C1-C2, n = 12 for C1-C2 with FL PKCβ (1); n = 5 for C1-C2 with FL PKCβ (2); error bar = SEM).
Figure S4 Expression of eGFP-C1 or F-eGFP does not affect membrane retrieval time. Quantification of time taken to retrieve exocytosing CGs in cells expressing caged IP3 alone (control; n = 33), eGFP-C1 + caged IP3 (n = 35); or F-eGFP + caged IP3 (n = 31). (p = 0.16 for control vs eGFP-C1; p = 0.088 for control vs F-eGFP).
Video 1 Subcortical view of actin coat assembly during CG exocytosis. Corresponds to Fig. 1a. Actin coats (Alexa 488 actin, green) assembles around exocytosing CGs (TR-dextran, red) after CG-PM fusion. 21μm × 21μm. Frames are 1.5s apart; 12 frames per second. Total length of movie is 114s.
Video 2 Subcortical view of eGFP-C1 (DAG) recruitment during CG exocytosis. Corresponds to Fig. 2b. DAG (eGFP-C1, green) is recruited to exocytosing CGs (TR-dextran, red) upon CG exocytosis, but not to non-exocytosed CGs (non-TR-dextran-filled CGs). 14μm × 10μm. Frames are 1.5s apart; 8 frames per second. Total length of movie is 75s.
Video 3 Subcortical view of eGFP-C1* (non-DAG binding) recruitment during CG exocytosis. Corresponds to Fig. 2c. In contrast to eGFP-C1 (Video 2), eGFP-C1* (non-DAG binding C1 domain, green) is not recruited to exocytosing CGs (TR-dextran, red). 7μm × 17μm. Frames are 1.5s apart; 8 frames per second. Total length of movie is 45s.
Video 4 Subcortical view of PKCβ recruitment during CG exocytosis. Corresponds to Fig. 5b. PKCβ-eGFP (green) is transiently recruited to all CGs (both non-TR-dextran filled vesicles and TR-dextran-filled vesicles) upon IP3 uncaging, but remains only on exocytosing CGs (TR-dextran, red). 13μm × 13μm. Frames are 1.8s apart, 8 frames per second. Total length of movie is 105s.
Video 5 Subcortical view of the recruitment of C1–C2 domain of PKCβ during CG exocytosis. Corresponds to Fig. 5f. Similar to PKCβ-eGFP (video 4), C1-C2-eGFP (green) is transiently recruited to all CGs (both non-TR-dextran filled vesicles and TR-dextran-filled vesicles) upon IP3 uncaging, but remains only on exocytosing CGs (TR-dextran, red). 21μm × 21μm. Frames are 1.5s apart, 8 frames per second. Total length of movie is 112s.
Video 6 Subcortical view showing hyper-developed actin coats in PKCβ-overexpressing cells. Corresponds to Fig. 6a. Overexpression of PKCβ induces formation of thicker, longer-lived actin coats (Alexa488 G-actin, green) on a subset of exocytosing CGs (TR-dextran, red). 13μm × 20μm. Frames are 1.5s apart, 12 frames per second. Total length of movie is 225s.
Video 7 Corresponds to Fig. 6a. Actin coat (Alexa488 G-actin, green) assembles normally around exocytosing CGs (TR-dextran, red) in cells overexpressing PKCβK368R. 18μm × 26μm. Frames are 1.5s apart, 12 frames per second. Total length of movie is 208s.