

Abstract
Amnestic mild cognitive impairment (MCI) is an isolated episodic memory disorder that has a high likelihood of progressing to Alzheimer’s disease. Auditory sensory cortical responses (P50, N100) have been shown to be increased in amplitude in MCI compared to older controls. We tested whether (1) cortical potentials to other sensory modalities (somatosensory and visual) were also affected in MCI and (2) cholinesterase inhibitors (ChEIs), one of the therapies used in this disorder, modulated sensory cortical potentials in MCI. Somatosensory cortical potentials to median nerve stimulation and visual cortical potentials to reversing checkerboard stimulation were recorded from 15 older controls and 15 amnestic MCI subjects (single domain). Results were analyzed as a function of diagnosis (Control, MCI) and ChEIs treatment (Treated MCI, Untreated MCI). Somatosensory and visual potentials did not differ significantly in amplitude in MCI subjects compared to controls. When ChEIs use was considered, somatosensory potentials (N20, P50) but not visual potentials (N70, P100, N150) were of larger amplitude in untreated MCI subjects compared to treated MCI subjects. Three individual MCI subjects showed increased N20 amplitude while off ChEIs compared to while on ChEIs. An enhancement of N20 somatosensory cortical activity occurs in amnestic single domain MCI and is sensitive to modulation by ChEIs.
Keywords: Mild Cognitive Impairment, Somatosensory cortex, Visual cortex , Cholinesterase inhibitor, Interstimulus interval
1.Introduction
Mild cognitive impairment (MCI) describes older individuals having cognitive impairments without accompanying functional impairments that characterize dementia (Petersen et al., 1999). Recent studies have suggested criteria for distinguishing among four subtypes of MCI based on the presence of both episodic memory impairment (amnestic or non-amnestic MCI) and other cognitive impairments (single or multiple domain MCI) (Petersen, 2004). For example, amnestic single domain MCI refers to patients with involvement of only memory deficit whereas amnestic multiple domain MCI refers to patients with impairment of both memory and other cognitive domains such as language or executive function. MCI subjects have a high risk of converting to Alzheimer’s disease (Morris et al., 2001; Petersen et al., 1999) and show neuropathological features of β-amyloid plaques and neurofibrillary tangles similar to early Alzheimer’s disease (Kordower et al., 2001; Morris and Price, 2001; Mufson et al., 1999). These findings suggest that MCI can be a precursor of Alzheimer’s disease.
Cholinergic processes in neocortical areas are affected in Alzheimer’s disease (Geula and Mesulam, 1989; Heckers et al., 1992) and are particularly apparent late in the course of Alzheimer’s disease when cognitive and behavioral functions are severely impaired (Davis et al., 1999). Cholinesterase inhibitors (ChEIs) that serve to increase the availability of acetylcholine have been used successfully to treat patients with MCI (Petersen et al., 2005) and early stages of Alzheimer’s disease (Doody et al., 2001; Rogers et al., 1998; Winblad et al., 2001). These results suggest that there are functional changes of the cholinergic systems projecting to neocortical regions in early stages of dementia that may anticipate the later development of behavioral deficits affecting language and motor functions (Goldman et al., 1999; Pettersson et al., 2005).
Electrophysiological studies have shown that cortical sensory potentials to auditory stimuli occurring at a peak latency of ˜50 ms (P50) increase in amplitude in normal aging (Golob et al., 2005) and have further increases in both MCI (Golob et al., 2002) and Alzheimer’s disease (Golob and Starr, 2000). The increase of auditory P50 amplitudes in MCI occurs over a range of stimulus presentation rates and task conditions (e.g., active or passive listening) (Golob et al., 2002; Irimajiri et al., 2005). A five-year longitudinal study (Golob et al., in press) has shown that the extent of P50 amplitude increase could be related to both the type of amnestic MCI (larger in multiple domain MCI than in single domain MCI) and clinical outcomes (larger in MCI who converted to dementia than MCI who remained stable). The increased amplitude of cortical responses in MCI was related to the impairment of language functions that was present in multiple domain but not in single domain. The degree of memory impairment in the two subtypes did not differ. These and other results (Bell-McGinty et al., 2005) suggest that primary and secondary auditory cortices in the temporal lobe that generate the P50 component (Liegeois-Chauvel et al., 1994; Reite et al., 1988) become involved as MCI progresses from isolated memory deficits (single domain MCI) to additional cognitive dysfunctions involving language functions (multiple domain MCI).
In this report, we have extended the study of sensory cortical activity in amnestic single domain MCI to somatosensory (median nerve) and visual (reversing checkerboard) stimuli to define if an increase in responsiveness extended to other sensory regions. We hypothesized that there would be increases in somatosensory but not in visual sensory potentials beyond those accompanying normal aging (Desmedt and Cheron, 1980) based on the demonstration of altered motor functions in both MCI and Alzheimer’s disease ( Kluger et al., 1997; Goldman et al., 1999; Dick et al., 2003; Pettersson et al., 2005) whereas visual disorders are typically not expressed until late in the course of Alzheimer’s disease. We also examined whether somatosensory and visual cortical activities in MCI were affected by ChEIs, one of the therapies used for MCI and Alzheimer’s disease.
2.Results
2.1 Neuropsychological data
We tested 15 older controls and 15 MCI subjects (Treated MCI = 8, Untreated MCI = 7). Table 1 shows demographic information for all subjects, and Table 2 summarizes neuropsychological test results as a function of diagnosis (Control, MCI) and ChEIs treatment (Treated MCI, Untreated MCI). MCI subjects scored significantly lower than controls on all episodic memory tests (all p < .01). Relative to controls, MCI subjects had significantly lower scores on the MMSE, the Boston naming test, and the Trailmaking Test A and B (all p < .04) but were within 1.5 SD of the means of age-matched controls. The Geriatric Depression Scale was significantly higher for MCI relative to controls (p < .005) but still fell within normal ranges. No other significant group differences were found.
Table 1.
Demographic information and ChEIs treatments for treated MCIa
| Controls | MCI | MCI | ||
|---|---|---|---|---|
| Treated MCI | Untreated MCI | |||
| n | 15 | 15 | 8 | 7 |
| Gender (male/female) | 6/9 | 10/5 | 6/2 | 4/3 |
| Age (years) | 76.3 ± 7.4 | 73.8 ± 4.6 | 73.4 ± 3.5 | 74.3 ± 5.8 |
| Education (years) | 15.6 ± 2.9 | 16.6 ± 2.1 | 16.6 ± 1.8 | 16.6 ± 2.5 |
|
| ||||
| ChEIs treatment | Donepezil | Rivastigmine | Galantamine | |
| (n = 8) | 5 mg (n = 1) | 4.5 mg (n =1) | 12 mg (n =1) | |
| 10 mg (n = 4) | 12 mg (n = 1) | |||
Values are means ± SD. ChEIs = cholinesterase inhibitors. MCI subjects were divided into two groups: MCI patients who were being treated with ChEIs (Treated MCI) and MCI patients who were not treated with ChEIs (Untreated MCI). Age and education were compared between controls and MCI, and Treated MCI vs. Untreated MCI, and none of the comparisons were significantly different.
Table 2.
Neuropsychological test results (Values are means ± SD)a
| Controls | MCI | P value (t-tests) | Treated MCI | Untreated MCI | P value (t-tests) | |
|---|---|---|---|---|---|---|
| N | 15 | 15 | 8 | 7 | ||
| MMSE Scoreb | 29.4 ± 0.8 | 27.4 ± 1.5 | < .001 | 27.0 ± 1.4 | 27.9 ± 1.7 | ns |
| WMS-III Logical Memory | ||||||
| Immediate recall (SS) | 13.7 ± 2.7 | 7.9 ± 3.4 | < .001 | 6.9 ± 2.7 | 10.0 ± 4.1 | ns |
| Delayed recall (SS) | 14.2 ± 2.6 | 6.9 ± 3.2 | < .001 | 5.8 ± 2.7 | 9.3 ± 3.1 | ns |
| CERAD Word List | ||||||
| Sum of trials 1-3 | 24.3 ± 3.4 | 16.7 ± 2.0 | < .001 | 16.7 ± 2.3 | 16.7 ± 2.3 | ns |
| 5 min delayed recall | 8.3 ± 1.8 | 3.1 ± 2.3 | < .001 | 2.5 ± 2.7 | 3.8 ± 1.5 | ns |
| 30 min delayed recall | 8.1 ± 2.1 | 2.3 ± 2.4 | < .001 | 2.5 ± 2.8 | 2.2 ± 1.8 | ns |
| 5 min delayed recognition | 19.5 ± 0.9 | 17.7 ± 2.3 | < .01 | 16.9 ± 2.7 | 18.8 ± 0.8 | ns |
| 30 min delayed recognition | 19.7 ± 0.8 | 16.9 ± 2.9 | < .002 | 16.5 ± 2.9 | 17.6 ± 3.0 | ns |
| Boston Naming Test | 29.4 ± 0.9 | 27.7 ± 2.1 | < .01 | 28.4 ± 1.1 | 27.0 ± 2.8 | ns |
| CERAD Animal Naming | 21.5 ± 5.5 | 18.3 ± 4.0 | ns | 17.0 ± 4.4 | 20.0 ± 3.1 | ns |
| FAS Verbal Fluency (SS) | 13.4 ± 2.4 | 12.0 ± 2.6 | ns | 11.8 ± 2.8 | 12.3 ± 2.6 | ns |
| WAIS-III Block Design (SS) | 12.4 ± 2.6 | 10.6 ± 2.7 | ns | 10.9 ± 3.1 | 10.2 ± 2.3 | ns |
| CERAD Constructional Praxis | 10.3 ± 0.6 | 10.5 ± 0.9 | ns | 10.7 ± 0.5 | 10.3 ± 1.2 | ns |
| Trailmaking Test A (SS) | 12.4 ± 3.0 | 9.5 ± 3.7 | < .04 | 10.3 ± 3.5 | 8.2 ± 4.2 | ns |
| Trailmaking Test B (SS) | 12.9 ± 3.4 | 9.9 ± 2.3 | < .01 | 9.6 ± 1.8 | 10.4 ± 3.0 | ns |
| Geriatric Depression Rating Scale | 0.7 ± 0.9 | 3.6 ± 3.4 | < .005 | 3.3 ± 2.5 | 4.0 ± 4.5 | ns |
Neuropsychological results reported as raw scores except for WAIS-III Logical memory, FAS Verbal Fluency, WAIS-III Block Design, and Trailmaking A and B that used age- or age and education-adjusted scaled scores (indicated by SS). The t-tests were performed to compare healthy older controls with MCI subjects, and MCI who were currently treated with cholinesterase inhibitors (Treated MCI) vs. MCI patients who were not treated with cholinesterase inhibitors (Untreated MCI). ns = not significant.
MMSE = Mini-Mental State Examination.
Analysis of neuropsychological data as a function of ChEIs treatment in MCI did not reveal significant differences between treated and untreated MCIs (see Table 2).
2.2. Somatosensory evoked potentials
Fig. 1 shows grand average somatosensory potentials as a function of diagnosis (Control, MCI) and of ChEIs treatment (Treated MCI, Untreated MCI) at slow and intermediate stimulus rates (interstimulus intervals of 1500 and 500 ms). There were significant differences of N20 and P50 amplitudes as a function of ChEIs treatment (Untreated MCI > Treated MCI) but not as a function of diagnosis (MCI = Control). There were significant interactions between ChEIs treatment and stimulus rate (interstimulus interval: ISI) for P30 and P50 amplitudes. Both P30 and P50 amplitudes in untreated MCI were reduced as stimulus rate (ISI) was decreased whereas in treated MCI the amplitudes did not change with the ISI. Table 3 summarizes the statistical results and corresponding significance level as a function of diagnosis and ChEIs treatment for each factor and their interactions.
Fig. 1.
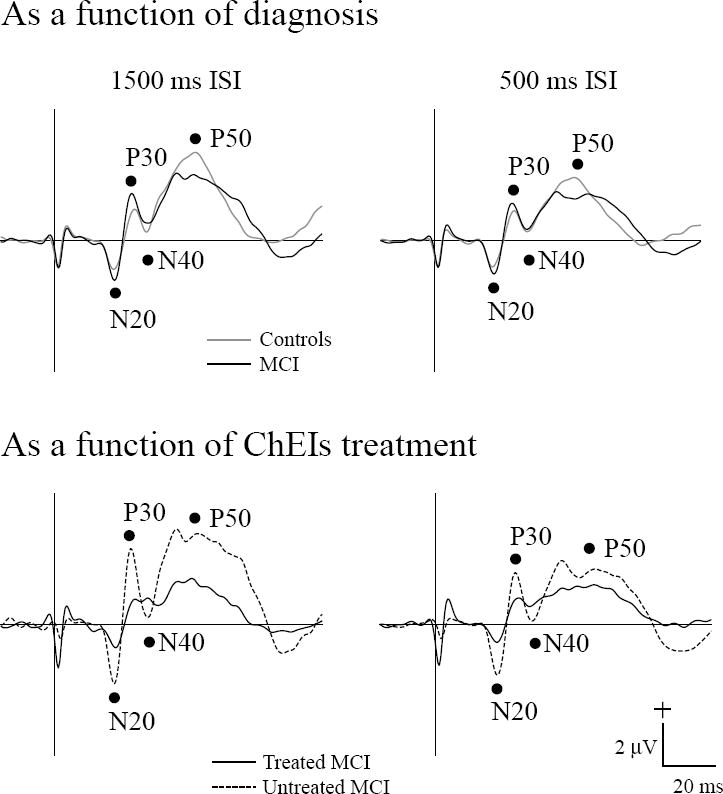
Grand average somatosensory evoked potentials (N20, P30, N40, P50) to median nerve stimulation are shown as a function of diagnosis (top panels : Control, MCI) and of ChEIs treatment (lower panels: Treated MCI, Untreated MCI) for the interstimulus intervals (ISIs) of 1500 ms and 500 ms. The vertical line indicates stimulus onset.
Table 3.
Significant effects for somatosnsory evoked potentials as a function of diagnosis and of ChEIs treatment
| ANOVAs | Diagnosis (Control, MCI) ×ISI (1500 ms, 500 ms) | ChEIs treatment ( Treated MCI, Untreated MCI) × ISI | ||||
|---|---|---|---|---|---|---|
| Diagnosis | ISI | Diagnosis × ISI | ChEIs treatment | ISI | ChEIs treatment × ISI | |
| N20 | ||||||
| Amplitude | ns | * | ns | * | * | ns |
| Latency | ns | ns | ns | ns | ns | ns |
| P30 | ||||||
| Amplitude | ns | ns | ns | ns | * | * |
| Latency | ns | ns | ns | ns | ns | ns |
| N40 | ||||||
| Amplitude | ns | ns | ns | ns | ns | ns |
| Latency | ns | * | ns | ns | ns | ns |
| P50 | ||||||
| Amplitude | ns | * | ns | ** | * | * |
| Latency | ns | * | ns | ns | ns | ns |
Treated MCI = MCI subjects being treated with cholinesterase inhibitors. Untreated MCI = MCI subjects being untreated with cholinesterase inhibitors. ** = p <.01, * = p < .05, ns = not significant.
2.2.1. As a function of diagnosis (Controls, MCI)
Amplitude and latency differences between MCI and the control group did not attain significant levels for any of the measured components (N20, P30, N40, and P50). ISIs affected both MCI and controls with larger amplitudes at the ISI of 1500 ms for N20 (−2.1 μV) and P50 (4.6 μV) than at the ISI of 500 ms (−1.8 μV for N20, 3.5 μV for P50). ISI effects for peak latencies in both subject groups were prolonged at the ISI of 500 ms for N40 (37.0 ms) and P50 (50.1 ms) compared to the ISI of 1500 ms (36.0 ms for N40, 48.6 ms for P50).
2.2.2. As a function of ChEIs treatment (Treated MCI, Untreated MCI)
When the MCI group was separated into treated and untreated groups, significant N20 and P50 amplitude effects were indicated. Untreated MCI had N20 (−3.2 μV) and P50 (5.0 μV) amplitudes that were larger than the treated MCI (−1.3 μV for N20, 2.8 μV for P50). ISIs affected both treated MCI and untreated MCI with larger amplitude at the ISI of 1500 ms for N20 (−2.5 μV), P30 (2.8 μV), and P50 (4.3 μV) than at the ISI of 500 ms (−2.0 μV for N20, 2.2 μV for P30, 3.4 μV for P50). The ISI effects further separated the subject groups for P30 and P50 amplitudes. Post-hoc testing indicated that untreated MCI had P30 and P50 amplitudes that were larger at 1500 ms ISI (4.0 μV for P30, 5.8 μV for P50) than at 500 ms ISI (2.7 μV for P30, 4.0 μV for P50) whereas treated MCI had P30 and P50 amplitudes that were not affected by ISI.
2.3 Visual evoked potentials as a function of diagnosis and ChEIs treatment
Fig. 2 shows grand average visual potentials as a function of diagnosis (Control, MCI) and of ChEIs treatment (Treated MCI, Untreated MCI) at slow and intermediate stimulus rates (interstimulus intervals of 1500 and 500 ms). Peak amplitudes and latencies of visual components were analyzed from mean potentials stimulated at the right and the left eye since there was no significant amplitude or latency difference between eyes.
Fig. 2.

Grand average visual evoked potentials (N70, P100, N150) to a reversing checkerboard are shown as a function of diagnosis (top panels : Control, MCI) and of ChEIs treatment (lower panels: Treated MCI, Untreated MCI) for the interstimulus intervals (ISIs) of 1500 ms and 500 ms. The vertical line indicates stimulus onset.
There were no significant effects for group, ISI, or group × ISI as a function of diagnosis or ChEIs treatment for the amplitudes and latencies of visual components (N70, P100, and P150).
2.4. Somatosensory evoked potentials of individual MCI subjects tested while on and off ChEIs
Somatosensory potentials were measured from three MCI individuals as a function of ChEI treatment (see Fig. 3 for test visits). One of the MCI subjects (Subject 1) was studied after discontinuing ChEI use for two weeks and then retested after two weeks of ChEI treatment. Two MCI subjects (Subjects 2, 3) were untreated at the time of the initial evoked potential tests and were retested after taking ChEI for at least 10 weeks. One of these MCI subjects (Subject 2) was studied on six separate occasions, one time before starting treatment, three times while taking ChEIs, and two times after discontinuing the medications. Fig. 4 shows somatosensory potentials and mean values of N20 amplitude in these three MCI individuals tested while on and off ChEIs for the ISI of 1500 ms.
Fig. 3.

Test visits are shown for three MCI individuals as a function of ChEIs treatment. The filled black line indicates on treatment with ChEIs (On ChEIs) and the dashed black line indicates off treatment with ChEIs (Off ChEIs). Subject 1 was tested after discontinuing ChEI for two weeks and retested after four weeks of ChEI treatment. Subject 2 was studied on six separate occasions: one time before starting treatment, three times after taking ChEIs, and two times after discontinuing the medications. Subject 3 was untreated at the time of the initial test and then retested after taking ChEI.
Fig. 4.

Somatosensory evoked potentials and N20 amplitude tested while on and off ChEI treatment in three individual MCI subjects for the ISI of 1500 ms. These MCI subjects were not taking ChEIs at the time of the initial evoked potential tests and were subsequently treated with ChEIs, and retested. N20 amplitude was reduced approximately in half when untreated with ChEIs (black/white stripe bars) compared to when treated (black bars). Somatosensory potentials shown in top panels were from the first and second tests. In the lower panels, numbers below the x-axis show subject’s test number. The horizontal dashed line indicates the mean amplitude of N20 component for control (−1.9 μV) with arrow representing ±1 SD of the control mean. ChEIs = cholinesterase inhibitors. On ChEIs = treated with cholinesterase inhibitors (Donepezil: 10 mg/day). Off ChEIs = untreated with cholinesterase inhibitors.
The amplitudes of the N20 response in all three MCI subjects for both ISIs of 1500 ms and 500 ms were reduced approximately 50% when treated with ChEIs compared to the untreated state. No consistent change in the amplitudes or latencies of other somatosensory potentials (P30, N40, P50) were found as a function of treatment in the MCI individuals.
3. Discussion
The results of the present study showed that somatosensory cortical response (N20) was significantly increased in amplitude in untreated MCIs compared to treated MCIs as well as in three individual MCI subjects who were tested before, during, and after treatment with ChEIs. The differences of somatosensory amplitudes between untreated and treated MCIs were not due to cognitive differences (see Table 2), but rather to ChEI therapy.
3.1 Somatosensory potentials in mild cognitive impairment and cholinesterase inhibitors
The N20 component reflects the initial response of area 3b in somatosensory cortex (Allison, 1982), and increases in amplitude in older subjects compared to young subjects (Desmedt and Cheron, 1981). Our results suggest that additional increases of N20 amplitude in untreated MCI can accompany early cognitive decline affecting memory functions. It is unlikely that the N20 amplitude changes found in both older control subjects (Desmedt and Cheron, 1981) and our untreated MCI subjects were due to peripheral nerve disorders that are common in aging. If anything, peripheral nerve disorders are associated with decreased N20 amplitude (Desmedt and Cheron, 1980). In the present study, peripheral nerve responses at Erb’s point in both MCI (treated, untreated) and older controls were of low amplitude and difficult to identify reflecting a poor signal-to-noise ratio in the averaging process. Although there is a possibility of peripheral deficits in MCI, we consider that the increased amplitude of cortical somatosensory N20 response identified in the untreated MCI reflects changes in cortical responsiveness to somatosensory afferent input rather than to altered peripheral nerve functions.
Animal studies show that acetylcholine can modulate somatosensory neuronal responses to afferent stimulation (Metherate et al., 1988). The nucleus basalis is a source of cholinergic input to the somatosensory cortex, and is also affected by plaques and tangles both in Alzheimer’s disease and MCI (Mesulam et al., 2004). The results from the present study showed that ChEIs treatment had a significant effect in MCI in normalizing somatosensory N20 amplitudes. Cholinergic manipulations (i.e., scopolamine, rivastigmine) in healthy young subjects do not affect N20 amplitudes (Huttunen et al., 2001;Restuccia et al., 2003).
The differences of N20 amplitudes in MCIs (Untreated MCI > Treated) were present for both ISIs (1500 ms and 500 ms) suggesting that neural mechanisms underlying ChEI induced amplitude changes were not affected by rate. In contrast, the late components, P30 and P50, showed amplitude changes with ISI for untreated MCI (1500 ms ISI > 500 ms ISI) but not for treated MCI (1500 ms = 500 ms ISI) suggesting that ChEI treatment was selective in normalizing cortical processes with relatively long recovery functions. The ability of ChEIs to “normalize” somatosensory cortex in MCI may be related to increasing the availability of acetylcholine that modulates glutamate induced cortical sensory excitability (Metherate, 2004). The enhanced responses of somatosensory cortex are present early in the course of MCI (single domain) whereas the auditory cortical response is not affected until MCI becomes multiple domain and is independent of stimulus rate. Moreover, treatment with ChEI is without effect on the enhancement of auditory cortical activity (Irimajiri et al., 2005).
The changes of somatosensory cortical functions found in early stage of MCI may contribute to the alterations of sensory or motor functions in both MCI (Dick et al., 2003; Kluger et al., 1997) and dementia (Goldman et al., 1999; Pettersson et al., 2005). Compared to healthy older controls, both amnestic MCI and Alzheimer’s disease show disturbances on tasks that assess fine (e.g., peg board placement) and complex (e.g., rapid alternating hand movements) motor movements (Kluger et al., 1997). Similarly, prolonged and less accurate arm movements are reported in amnestic MCI subjects (Yan and Dick, 2006). These motor changes may be, in part, a consequence of altered functions of sensory cortex affecting motor responses. Thus, Di Lazzaro and colleagues (2004,2005) found reduced short-latency afferent inhibition of motor cortical excitability in Alzheimer’s disease patients which was restored by ChEI (i.e., rivastigmine) (Di Lazzaro et al., 2004; Di Lazzaro et al., 2005).
3.2 Visual potentials in amnestic mild cognitive impairment and cholinesterase inhibitors
Visual pattern reversal potentials (N70, P100, N150) did not change as a function of diagnosis or treatment. Several studies of pattern reversal potentials (N70, P100) show prolonged latencies with aging (Celesia and Daly, 1977; Wright et al., 1985) but further increment in Alzheimer’s disease patients does not occur (Philpot et al., 1990; Wright et al., 1986). Human studies have shown that the P100 component from the primary visual cortex (Ducati et al., 1988) was not affected by cholinergic manipulations (e.g., scopolamine) (Bajalan et al., 1986; Sloan et al., 1992).
3.3 Clinical implication
In the present study of amnestic single domain MCI, we found abnormally increased somatosensory cortical activity (i.e., N20). This result complements earlier reports of enhanced auditory sensory cortical P50 activity occurring in MCI (Golob et al., 2002). Specifically, both auditory and somatosensory but not visual sensory cortical activity appear to be enhanced in amplitude in subjects with MCI who are at high risk for developing dementia (Petersen et al., 1999). The enhancement of the somatosensory but not the auditory cortical activity in MCI is sensitive to modulation by ChEIs (Irimajiri et al., 2005).
A longitudinal study of amnestic MCI subjects (Golob et al., in press) show that the amplitude increase of auditory P50 component differs between diagnostic subtypes of MCI, being evident in multiple domain but not in single domain MCIs. In the present study enhanced somatosensory N20 was found in early stage of MCI (amnestic single domain MCI) when auditory cortical enhancement was not detected. Further studies are needed to define if somatosensory cortical changes are expressed differentially in other subtypes of MCI (e.g., multiple domain). We suggest that the measurements of sensory cortical functions may be of clinical value in characterizing subgroups of the disorder known as mild cognitive impairment (MCI).
3.4. Summary
Somatosensory cortical activity (N20) to median nerve stimulation is increased in amplitude in untreated amnestic single domain MCI compared to treated MCI. The results suggest that a disorder of somatosensory cortex is present in an early stage of MCI (single domain) and is sensitive to modulation by cholinergic treatments.
4.Experimental Procedure
4.1 Subjects
Fifteen older controls and 15 amnestic single domain MCI were recruited through the Successful Aging Program, Alzheimer’s Disease Research Center at the University of California, Irvine, and a university clinical practice. All subjects signed informed consent forms, and the study was performed in accordance with a protocol approved by the UCI institutional review board. Demographic information for all subjects is summarized in Table 1. The diagnosis of the subtypes of MCI was based on neurological and neuropsychological examinations, family interviews and brain imaging (Smith et al., 1996). Amnestic single domain MCI exhibited moderate to severe deficits in episodic memory, typically > 1.5 SD below the mean of agematched normative scores on episodic memory tests without notable impairments on other neuropsychological tests or activity of daily living.
Some of the MCI subjects were taking cholinesterase inhibitors (ChEIs: donepezil, rivastigmine, galantamine) at the time of evoked potential testing from six months to three years before the recording of brain activity (see Table 1 for ChEIs treatment). In order to examine the effects of ChEIs on sensory cortical responses, MCI subjects were divided into those who were being treated with ChEIs (n = 8) and those who were not being treated with ChEIs (n = 7). The mean intervals between the clinical diagnosis of MCI and evoked potential testing were 840 days (range between 60-1400 days) for treated MCI group and 630 days (range between 160-1400 days) for untreated MCI group. We also retested three of the MCI subjects when both receiving and not receiving treatment with ChEIs to define individual subject sensory responses as a function of ChEI treatment. All control subjects we tested were untreated with ChEIs.
4.2. Neuropsychological testing
The neuropsychological test battery included the Mini-Mental State Examination as a screen for dementia (Folstein et al., 1975), the WMS-III Logical Memory subtest (Wechsler, 1997), and the CERAD Word List Learning Task (Morris et al., 1989) to quantify episodic memory function, the 30-item Boston Naming Test (Kaplan et al., 1983), the CERAD Animal Naming (Morris et al., 1989), and the Controlled Oral Word Association (FAS Fluency) (Spreen and Benton, 1977) for language functions, the WAIS-III Block Design test (Wechsler, 1981) and the CERAD Constructional Praxis test (Morris et al., 1989) for visual-spatial functions, the Trailmaking test A and B (Reitan, 1958) for attention and executive function. The Geriatric Depression Scale (Yesavage et al., 1983) was administered to exclude depression.
4.3. Design
Somatosensory and visual potentials were collected at two different ISIs (1500 ms, 500 ms). Amplitudes of cortical sensory potentials are normally attenuated as ISI decreases, a process known as a refractory effect. Refractory effects define the rate of recovery of neurons after activation. We tested whether MCI showed abnormal changes of their recovery functions for amplitude and latency compared to controls and whether ChEIs use influenced recovery functions.
For somatosensory testing, a PC-based Neuroscan stimulation system (Stim 1) was used to control timing and triggering. For somatosensory testing, square-wave pulses of 0.1 ms duration were delivered to the median nerve of the dominant hand (1 control and 1 treated MCI stimulated at the left hand), 2 cm proximal to the crease at the wrist from a battery-operated Tektronix 2420 isolated electrical stimulator. Between 200-300 stimuli were delivered at 1500 ms ISI, and 600-800 stimuli were presented at 500 ms ISI. Stimulus intensity was just sufficient to elicit an observable twitch of the thumb that yields maximum amplitudes of the short latency (N20) cortical response (Lesser et al., 1979).
For visual testing, a reversing checkerboard pattern of white and black squares (2.5 cm x 4 cm) was used. Individual squares (8 × 8) subtended 1.5° of visual angle with pattern luminance of 48.7 cd/m2 for white squares were presented on a computer monitor placed ˜ 100 cm in front of the subject. Monocular stimulation was presented to each eye for two blocks of 1500 ms and 500 ms ISIs. One stimulus block comprised 120 trials. Subjects were instructed to fixate on a green dot at the center of the pattern and to avoid blinking during the test block. Subjects wore corrective glasses if necessary, and the unstimulated eye was covered. One MCI subject (untreated MCI) did not receive visual testing because of impaired acuity secondary to retinal damage. All subjects were instructed to keep their eyes open and remain awake during the studies, and short rest breaks were provided between blocks.
4.4. Electrophysiological recordings
Scalp recordings were made from 8-mm diameter Ag/AgCl surface electrodes (In Vivo Metric). Electrode placement was based on the 10/20 system (Jasper, 1958). For somatosensory potentials, electrodes were placed at Cz′, C3′, and C4′; sites located 2 cm posterior to Cz, C3, and C4 sites, respectively. An electrode placed at Fz served as a reference. Peripheral nerve conduction was recorded from electrodes placed at left and right Erb’s points above the clavicle overlying the brachial plexus. For visual evoked potentials, electrodes were located at Oz′, O1′, and O2′ sites located 5 cm anterior to Oz, O1, and O2 sites, respectively, referenced to Fz. Additional electrodes were placed above and below the left eye to monitor eye movements, and on the forehead to serve as a ground. Scalp impedances between electrodes after preparation measured less than 5 Kohm.
A PC-based Neuroscan recording system (Scan) with SynAmps I biological amplifiers was used to collect the electrophysiological (EEG, EOG) data. Amplifier bandpass was set between DC and 500 Hz. Ongoing data was continuously digitized at a rate of 2,000 Hz. During data collection, the EEG and EOG were monitored to ensure that subjects kept their eyes open and there was no indication of drowsiness. Off-line corrections were made for ocular artifact with system software (Scan). Continuous EEG records that exceeded 75 μV on electrode sites (e.g., muscle and body movements) were automatically rejected.
4.5. Data analysis
The digitized EEG was epoched, averaged, and digitally filtered (Scan) depending on the particular component peaks analyzed.
Somatosensory potentials (N20, P30, N40, P50) were bandpass filtered (1-200 Hz, 12 dB/octave), and amplitudes were computed relative to the average voltage in the 20 ms baseline period before stimulus presentation. The N20 was defined as the maximum negativity between 20-28 ms. The P30 was the maximum positivity between 27-38 ms. The N40 was the maximum negativity from 32-43 ms. The P50 was maximum positivity between 40-65 ms. Peak latencies were computed from stimulus onset to peak maximum. Response of peripheral nerve conduction, N9, was not detectable in a number of subjects (5/15 controls, 9/15 MCI subjects) due to poor signal-to-noise ratio, and N9 measures were not included in data analysis. Somatosensory evoked potentials were recorded over an area on the scalp contralateral to the stimulus at the dominant wrist.
Visual potentials (N70, P100, N150) were bandpass filtered (1-20 Hz, 12 dB/octave) and amplitudes were defined relative to the 100 ms baseline immediately before stimulus presentation. The N70 was defined as the maximum negativity between 50-90 ms. The P100 was the maximum positivity between 90-120. The N150 was the maximum negativity from 100-165 ms. Peak latencies were computed from stimulus onset to peak maximum. Visual evoked potentials were recorded at Oz’ site.
4.6. Statistical analysis
For neuropsychological test scores, independent sample t-tests were used to compare controls with MCI and between subsets of MCI (Treated MCI vs. Untreated MCI). Peak amplitude and latency were separately analyzed using analysis of variance (ANOVA) for repeated measures. Measures for somatosensory and visual testing included the factors of diagnosis (Controls, MCI), ISI (1500 ms, 500 ms), and ChEIs treatment (Treated MCI, Untreated MCI). P values of < .05 were considered significant for ANOVAs and t-tests. Post-hoc comparisons of the means used the Tukey procedure.
Acknowledgments
This work was supported by NIH grant #AG-019681. The authors wish to thank Carl Cotman for his support, and Malcolm Dick and the UC Irvine Alzheimer’s Disease Research Center and Successful Aging Program staff, Hillel Pratt, and Yuna Chun for valuable discussions concerning these experiments.
Abbreviations
- MCI
Mild Cognitive Impairment
- ChEIs
Cholinesterase inhibitors
Footnotes
Publisher's Disclaimer: This is a PDF file of an unedited manuscript that has been accepted for publication. As a service to our customers we are providing this early version of the manuscript. The manuscript will undergo copyediting, typesetting, and review of the resulting proof before it is published in its final citable form. Please note that during the production process errorsmaybe discovered which could affect the content, and all legal disclaimers that apply to the journal pertain.
Contributor Information
Rie Irimajiri, Department of Neurology and Institute for Brain Aging and Dementia, University of California, Irvine, CA, USA.
Henry J Michalewski, Department of Neurology and Institute for Brain Aging and Dementia, University of California, Irvine, CA, USA.
Edward J Golob, Department of Psychology and Program in Neuroscience, Tulane University, New Orleans, LA, USA.
Arnold Starr, Department of Neurology and Institute for Brain Aging and Dementia, University of California, Irvine, CA, USA.
References
- Allison T. Scalp and cortical recordings of initial somatosensory cortex activity to median nerve stimulation in man. Ann N Y Acad Sci. 1982;388:671–678. doi: 10.1111/j.1749-6632.1982.tb50833.x. [DOI] [PubMed] [Google Scholar]
- Bajalan AA, Wright CE, van der Vliet VJ. Changes in the human visual evoked potential caused by the anticholinergic agent hyoscine hydrobromide: comparison with results in Alzheimer’s disease. J Neurol Neurosurg Psychiatry. 1986;49:175–182. doi: 10.1136/jnnp.49.2.175. [DOI] [PMC free article] [PubMed] [Google Scholar]
- Bell-McGinty S, Lopez OL, Meltzer CC, Scanlon JM, Whyte EM, Dekosky ST, Becker JT. Differential cortical atrophy in subgroups of mild cognitive impairment. Arch Neurol. 2005;62:1393–1397. doi: 10.1001/archneur.62.9.1393. [DOI] [PubMed] [Google Scholar]
- Celesia GG, Daly RF. Effects of aging on visual evoked responses. Arch Neurol. 1977;34:403–407. doi: 10.1001/archneur.1977.00500190037005. [DOI] [PubMed] [Google Scholar]
- Davis KL, Mohs RC, Marin D, Purohit DP, Perl DP, Lantz M, Austin G, Haroutunian V. Cholinergic markers in elderly patients with early signs of Alzheimer disease. J Am Med Assoc. 1999;281:1401–1406. doi: 10.1001/jama.281.15.1401. [DOI] [PubMed] [Google Scholar]
- Desmedt JE, Cheron G. Somatosensory evoked potentials to finger stimulation in healthy octogenarians and in young adults: wave forms, scalp topography and transit times of parietal and frontal components. Electroencephalogr Clin Neurophysiol. 1980;50:404–425. doi: 10.1016/0013-4694(80)90007-3. [DOI] [PubMed] [Google Scholar]
- Desmedt JE, Cheron G. Non-cephalic reference recording of early somatosensory potentials to finger stimulation in adult or aging normal man: differentiation of widespread N18 and contralateral N20 from the prerolandic P22 and N30 components. Electroencephalogr Clin Neurophysiol. 1981;52:553–570. doi: 10.1016/0013-4694(81)91430-9. [DOI] [PubMed] [Google Scholar]
- Di Lazzaro V, Oliviero A, Pilato F, Saturno E, Dileone M, Marra C, Daniele A, Ghirlanda S, Gainotti G, Tonali P. Motor cortex hyperexcitability to transcranial magnetic stimulation in Alzheimer’s disease. J Neurol Neurosurg Psychiatry. 2004;75:555–559. doi: 10.1136/jnnp.2003.018127. [DOI] [PMC free article] [PubMed] [Google Scholar]
- Di Lazzaro V, Oliviero A, Pilato F, Saturno E, Dileone M, Marra C, Ghirlanda S, Ranieri F, Gainotti G, Tonali P. Neurophysiological predictors of long term response to AChE inhibitors in AD patients. J Neurol Neurosurg Psychiatry. 2005;76:1064–1069. doi: 10.1136/jnnp.2004.051334. [DOI] [PMC free article] [PubMed] [Google Scholar]
- Dick MB, Hsieh S, Bricker J, Dick-Muehlke C. Facilitating acquisition and transfer of a continuous motor task in healthy older adults and patients with Alzheimer’s disease. Neuropsychology. 2003;17:202–212. doi: 10.1037/0894-4105.17.2.202. [DOI] [PubMed] [Google Scholar]
- Doody RS, Dunn JK, Clark CM, Farlow M, Foster NL, Liao T, Gonzales N, Lai E, Massman P. Chronic donepezil treatment is associated with slowed cognitive decline in Alzheimer’s disease. Dement Geriatr Cogn Disord. 2001;12:295–300. doi: 10.1159/000051272. [DOI] [PubMed] [Google Scholar]
- Ducati A, Fava E, Motti E. Neuronal generators of the visual evoked potentials: intracerebral recording in awake humans. Electroencephalogr Clin Neurophysiol. 1988;71:89–99. doi: 10.1016/0168-5597(88)90010-x. [DOI] [PubMed] [Google Scholar]
- Folstein MF, Folstein SE, McHugh PR. “Mini-mental state”. A practical method for grading the cognitive state of patients for the clinician. J Psychiatr Res. 1975 ;12:189–198. doi: 10.1016/0022-3956(75)90026-6. [DOI] [PubMed] [Google Scholar]
- Geula C, Mesulam MM. Cortical cholinergic fibers in aging and Alzheimer’s disease: a morphometric study. Neuroscience. 1989;33:469–481. doi: 10.1016/0306-4522(89)90399-0. [DOI] [PubMed] [Google Scholar]
- Goldman WP, Baty JD, Buckles VD, Sahrmann S, Morris JC. Motor dysfunction in mildly demented AD individuals without extrapyramidal signs. Neurology. 1999;53:956–962. doi: 10.1212/wnl.53.5.956. [DOI] [PubMed] [Google Scholar]
- Golob EJ, Starr A. Effects of stimulus sequence on event-related potentials and reaction time during target detection in Alzheimer’s disease. Clin Neurophysiol. 2000;111:1438–1449. doi: 10.1016/s1388-2457(00)00332-1. [DOI] [PubMed] [Google Scholar]
- Golob EJ, Irimajiri R, Starr A. Auditory cortical activity in amnestic mild cognitive impairment: Relationship to initial subtypes and conversion to dementia. Brain. doi: 10.1093/brain/awl375. [DOI] [PubMed] [Google Scholar]
- Golob EJ, Johnson JK, Starr A. Auditory event-related potentials during target detection are abnormal in mild cognitive impairment. Clin Neurophysiol. 2002;113:151–161. doi: 10.1016/s1388-2457(01)00713-1. [DOI] [PubMed] [Google Scholar]
- Golob EJ, Ovasapyan V, Starr A. Event-related potentials accompanying motor preparation and stimulus expectancy in the young, young-old and oldest-old. Neurobiol Aging. 2005;26:531–542. doi: 10.1016/j.neurobiolaging.2004.04.002. [DOI] [PubMed] [Google Scholar]
- Heckers S, Geula C, Mesulam MM. Acetylcholinesterase-rich pyramidal neurons in Alzheimer’s disease. Neurobiol Aging. 1992;13:455–460. doi: 10.1016/0197-4580(92)90072-6. [DOI] [PubMed] [Google Scholar]
- Huttunen J, Jaaskelainen IP, Hirvonen J, Kaakkola S, Ilmoniemi RJ, Pekkonen E. Scopolamine reduces the P35m and P60m deflections of the human somatosensory evoked magnetic fields. Neuroreport. 2001;12:619–623. doi: 10.1097/00001756-200103050-00038. [DOI] [PubMed] [Google Scholar]
- Irimajiri R, Golob EJ, Starr A. Auditory brain-stem, middle- and long-latency evoked potentials in mild cognitive impairment. Clin Neurophysiol. 2005;116:1918–1929. doi: 10.1016/j.clinph.2005.04.010. [DOI] [PubMed] [Google Scholar]
- Jasper HH. The ten-twenty electrode system of the international federation. Electroencephalogr Clin Neurophysiol. 1958;10:371–375. [PubMed] [Google Scholar]
- Kaplan E, Snodgrass H, Weintraub S. In: Boston Naming Test . Lea, Febiger, editors. Philadelphia, PA: 1983. [Google Scholar]
- Kluger A, Gianutsos JG, Golomb J, Ferris SH, George AE, Franssen E, Reisberg B. Patterns of motor impairment in normal aging, mild cognitive decline, and early Alzheimer’s disease. J Gerontol B Psychol Sci Soc Sci. 1997;52:28–39. doi: 10.1093/geronb/52b.1.p28. [DOI] [PubMed] [Google Scholar]
- Kordower JH, Chu Y, Stebbins GT, DeKosky ST, Cochran EJ, Bennett D, Mufson EJ. Loss and atrophy of layer II entorhinal cortex neurons in elderly people with mild cognitive impairment. Ann Neurol. 2001;49:202–213. [PubMed] [Google Scholar]
- Lesser RP, Koehle R, Lueders H. Effect of stimulus intensity on short latency somatosensory evoked potentials. Electroencephalogr Clin Neurophysiol. 1979;47:377–382. doi: 10.1016/0013-4694(79)90289-x. [DOI] [PubMed] [Google Scholar]
- Liegeois-Chauvel C, Musolino A, Badier JM, Marquis P, Chauvel P. Evoked potentials recorded from the auditory cortex in man: evaluation and topography of the middle latency components. Electroencephalogr Clin Neurophysiol. 1994;92:204–214. doi: 10.1016/0168-5597(94)90064-7. [DOI] [PubMed] [Google Scholar]
- Mesulam M, Shaw P, Mash D, Weintraub S. Cholinergic nucleus basalis tauopathy emerges early in the aging-MCI-AD continuum. Ann Neurol. 2004;55:815–828. doi: 10.1002/ana.20100. [DOI] [PubMed] [Google Scholar]
- Metherate R. Nicotinic acetylcholine receptors in sensory cortex. Learn Mem. 2004;11:50–59. doi: 10.1101/lm.69904. [DOI] [PubMed] [Google Scholar]
- Metherate R, Tremblay N, Dykes RW. The effects of acetylcholine on response properties of cat somatosensory cortical neurons. J Neurophysiol. 1988;59:1231–1252. doi: 10.1152/jn.1988.59.4.1231. [DOI] [PubMed] [Google Scholar]
- Morris JC, Heyman A, Mohs RC, Hughes JP, van Belle G, Fillenbaum G, Mellits ED, Clark C. The Consortium to Establish a Registry for Alzheimer’s Disease (CERAD). Part I. Clinical and neuropsychological assessment of Alzheimer’s disease. Neurology. 1989;39:1159–1165. doi: 10.1212/wnl.39.9.1159. [DOI] [PubMed] [Google Scholar]
- Morris JC, Price AL. Pathologic correlates of nondemented aging, mild cognitive impairment, and early-stage Alzheimer’s disease. J Mol Neurosci. 2001;17:101–118. doi: 10.1385/jmn:17:2:101. [DOI] [PubMed] [Google Scholar]
- Morris JC, Storandt M, Miller P, McKeel DW, Jr, Price JL, Rubin EH, Berg L. Mild cognitive impairment represents early-stage Alzheimer’s disease. Arch Neurol. 2001;58:397–405. doi: 10.1001/archneur.58.3.397. [DOI] [PubMed] [Google Scholar]
- Mufson EJ, Chen EY, Cochran EJ, Beckett LA, Bennett DA, Kordower JH. Entorhinal cortex beta-amyloid load in individuals with mild cognitive impairment. Exp Neurol. 1999;158:469–490. doi: 10.1006/exnr.1999.7086. [DOI] [PubMed] [Google Scholar]
- Petersen R. Mild cognitive impairment as a diagnostic entity. J Intern Med. 2004;256:183–194. doi: 10.1111/j.1365-2796.2004.01388.x. [DOI] [PubMed] [Google Scholar]
- Petersen RC, Smith GE, Waring SC, Ivnik RJ, Tangalos EG, Kokmen E. Mild cognitive impairment: clinical characterization and outcome. Arch Neurol. 1999;56:303–308. doi: 10.1001/archneur.56.3.303. [DOI] [PubMed] [Google Scholar]
- Petersen RC, Thomas RG, Grundman M, Bennett D, Doody R, Ferris S, Galasko D, Jin S, Kaye J, Levey A, Pfeiffer E, Sano M, van Dyck CH, Thal LJ, Group., AsDCS Vitamin E and donepezil for the treatment of mild cognitive impairment. N Engl J Med. 2005;352:2379–2388. doi: 10.1056/NEJMoa050151. [DOI] [PubMed] [Google Scholar]
- Pettersson AF, Olsson E, Wahlund LO. Motor function in subjects with mild cognitive impairment and early Alzheimer’s disease. Dement Geriatr Cogn Disord. 2005;19:299–304. doi: 10.1159/000084555. [DOI] [PubMed] [Google Scholar]
- Philpot MP, Amin D, Levy R. Visual evoked potentials in Alzheimer’s disease: correlations with age and severity. Electroencephalogr Clin Neurophysiol. 1990;77:323–329. doi: 10.1016/0168-5597(90)90053-g. [DOI] [PubMed] [Google Scholar]
- Reitan RM. Validity of the trail making test as an indicator of organic brain damage. Percept Mot Skills. 1958;8:271–276. [Google Scholar]
- Reite M, Teale P, Zimmerman J, Davis K, Whalen J. Source location of a 50 msec latency auditory evoked field component. Electroencephalogr Clin Neurophysiol. 1988;70:490–498. doi: 10.1016/0013-4694(88)90147-2. [DOI] [PubMed] [Google Scholar]
- Restuccia D, Della Marca G, Valeriani M, Rubino M, Paciello N, Vollono C, Capuano A, Tonali P. Influence of cholinergic circuitries in generation of high-frequency somatosensory evoked potentials. Clin Neurophysiol. 2003;114:1538–1548. doi: 10.1016/s1388-2457(03)00138-x. [DOI] [PubMed] [Google Scholar]
- Rogers SL, Doody RS, Mohs RC, Friedhoff LT. Donepezil improves cognition and global function in Alzheimer disease: a 15-week, double-blind, placebo-controlled study. Donepezil Study Group. Arch Intern Med. 1998;158:1021–1031. doi: 10.1001/archinte.158.9.1021. [DOI] [PubMed] [Google Scholar]
- Sloan EP, Fenton GW, Standage KP. Anticholinergic drug effects on quantitative electroencephalogram, visual evoked potential, and verbal memory. Biol Psychiatry. 1992;31:600–606. doi: 10.1016/0006-3223(92)90246-v. [DOI] [PubMed] [Google Scholar]
- Smith GE, Petersen RC, Parisi JE, Ivnik RJ, Kokmen E, Tangalos EG, Waring SC. Definition, course, and outcome of mild cognitive impairment. Aging Neuropsychol Cogn. 1996;3:141–147. [Google Scholar]
- Spreen O, Benton AL. Neuropsychology Laboratory. University of Victoria; Victoria, B.C.: 1977. Neurosensory Center Comprehensive Examination for Aphasia. [Google Scholar]
- Wechsler D. Wechsler Adult Intelligence Scale - Revised . Harcourt Brace Jovanovich; New York, NY: 1981. [Google Scholar]
- Wechsler D. Wechsler memory scale. 3. Psychological Corporation; San Antonio: 1997. [Google Scholar]
- Winblad B, Engedal K, Soininen H, Verhey F, Waldemar G, Wimo A, Wetterholm AL, Zhang R, Haglund A, Subbiah P. A 1-year, randomized, placebo-controlled study of donepezil in patients with mild to moderate AD. Neurology. 2001;57:489–495. doi: 10.1212/wnl.57.3.489. [DOI] [PubMed] [Google Scholar]
- Wright CE, Harding GF, Orwin A. The flash and pattern VEP as a diagnostic indicator of dementia. Doc Ophthalmol. 1986;62:89–96. doi: 10.1007/BF00140551. [DOI] [PubMed] [Google Scholar]
- Wright CE, Williams DE, Drasdo N, Harding GF. The influence of age on the electroretinogram and visual evoked potential. Doc Ophthalmol. 1985;59:365–384. doi: 10.1007/BF00159171. [DOI] [PubMed] [Google Scholar]
- Yan JH, Dick MB. Practice effects on motor control in healthy seniors and patients with mild cognitive impairment and early Alzheimer’s disease. Aging Neuropsychol Cogn. 2006;13:385–410. doi: 10.1080/138255890969609. [DOI] [PubMed] [Google Scholar]
- Yesavage JA, Brink TL, Rose TL, Lum O, Huang V, Adey M, Leirer VO. Development and validation of a geriatric depression screening scale: a preliminary report. J Psychiatr Res. 1983;17:37–49. doi: 10.1016/0022-3956(82)90033-4. [DOI] [PubMed] [Google Scholar]