

Summary
The bacterial primase (DnaG)–helicase (DnaB) interaction is mediated by the C-terminal domain of DnaG (p16) and a linker that joins the N- and C-terminal domains (p17 and p33 respectively) of DnaB. The crystal and nuclear magnetic resonance structures of p16 from Escherichia coli and Bacillus stearothermophilus DnaG proteins revealed a unique structural homology with p17, despite the lack of amino acid sequence similarity. The functional significance of this is not clear. Here, we have employed a ‘domain swapping’ approach to replace p17 with its structural homologue p16 to create chimeras. p33 alone hydrolyses ATP but exhibits no helicase activity. Fusing p16 (p16-p33) or DnaG (G-p33) to the N-terminus of p33 produced chimeras with partially restored helicase activities. Neither chimera interacted with DnaG. The p16-p33 chimera formed hexamers while G-p33 assembled into tetramers. Furthermore, G-p33 and DnaB formed mixed oligomers with ATPase activity better than that of the DnaB/DnaG complex and helicase activity better than the sum of the individual DnaB and G-p33 activities but worse than that of the DnaB/DnaG complex. Our combined data provide direct evidence that p16 and p17 are not only structural but also functional homologues, albeit their amino acid composition differences are likely to influence their precise roles.
Introduction
The helicase–primase interaction is essential for DNA replication. It mediates the recruitment of the primase at the oriC, regulates the formation of the Okazaki fragments during lagging strand synthesis and synchronizes lagging and leading strand synthesis (Tougu and Marians, 1996; Frick and Richardson, 1999; Yuzhakov et al., 1999; Patel and Picha, 2000; Lee et al., 2006). A distinct C-terminal p16 domain of the primase, separate from the N-terminal Zn-binding p12 and the central polymerization p37 domains, mediates the interaction with the helicase (Tougu et al., 1994; Bird et al., 2000). The primase p16 comprises two subdomains. The C1 subdomain links the primase active site to the C2 subdomain. The C2 subdomain binds to the DnaB helicase at the linker between its N-terminal p17 domain and its C-terminal p33 domain. (Thirlway et al., 2004; Syson et al., 2005). p16 is thought to interact with a linker region that joins the N-terminal p17 and C-terminal p33 domains of the helicase (Maurer and Wong, 1988; Stordal and Maurer, 1996; Bird et al., 2000; Thirlway et al., 2004). A ‘two-way’ functional modulation results in modulation of the initiation specificity, stimulation of primer synthesis, reduction of primer size by DnaG (Lu et al., 1996; Bhattacharyya and Griep, 2000; Johnson et al., 2000; Mitkova et al., 2003; Corn et al., 2005; Koepsell et al., 2006; Thirlway and Soultanas, 2006) and stimulation of the ATPase and helicase activities of DnaB (Bird et al., 2000; Thirlway et al., 2004). This is directly relevant to their in vivo functions during DNA replication but a clear understanding of the structural/functional mechanism is still eluding us.
The recent crystal and nuclear magnetic resonance (NMR) structures of the Escherichia coli (Oakley et al., 2005) and Bacillus stearothermophilus (Syson et al., 2005) p16 domain of the primase revealed a unique and surprising structural homology with the p17 domain of the helicase (Fig. S1), despite their poor overall sequence conservation. The functional significance of this is still unknown but a speculative model has been proposed to account for several structural and functional features of the helicase–primase complex (Soultanas, 2005; Syson et al., 2005). It has been established that binding of DnaG to DnaB results in an apparent conversion of the hexameric DnaB from a mixture of C6 (sixfold) and C3 (threefold) rings to exclusively C3 rings (Thirlway et al., 2004). The structural features that define the C3 DnaB ring involve interactions of p17 with alternate neighbouring p33 domains of the ring (Yu et al., 1996). The functional significance of these interactions around the ring is not clear but may represent a stimulated helicase that mimics the ring conformation when complexed with DnaG as the model suggests. The structural model takes into account this finding and proposes that p16 replaces p17 maintaining the interactions necessary for stabilizing the C3 ring. Furthermore, a network of surface residues that could be significant for the function of the DnaB–DnaG complex is spatially conserved between p16 and p17 but its structural/functional role has not been investigated (Soultanas, 2005). Although the main stoichiometry of the complex is DnaB6–DnaG3 (Bird et al., 2000) complexes with mixed stoichiometries of DnaB6–DnaG2 and DnaB6–DnaG1 can also form (Thirlway et al., 2004) and these may be important for the regulation of primer synthesis. Corn et al. have shown that primase subunits in the DnaB–DnaG complex ‘cross-talk’ to regulate selection of initiation sites and primer length (Corn et al., 2005). It is evident that complexes with different stoichiometries of DnaG molecules will exhibit different initiation site selection and will synthesize different size primers. The N-terminal p17 domain of DnaB appears to be crucial for oligomerization and helicase activity because in its absence the C-terminal P33 domain retains full ATPase activity but lacks helicase activity and the hexamers disintegrate in low ionic strength conditions (Biswas et al., 1994; Fass et al., 1999; Weigelt et al., 1999; Bird et al., 2000).
To test the hypothesis that the interaction between the primase and helicase is mediated by an ancestrally duplicated primase p16 and helicase p17, a set of chimeric proteins were created in which these domains were swapped, by fusing either the p16 domain (residues 454–597) of B. stearothermophilus DnaG or the full-length DnaG to the N-terminus of the p33 domain (residues 154–454) of B. stearothermophilus DnaB to produce the chimeras p16-p33 and G-p33 respectively. Comparative analytical gel filtration studies and velocity ultracentrifugation experiments revealed that p16-p33 forms hexamers and G-p33 assembles into tetramers. While p33 has only ATPase activity and no detectable helicase activity, both chimeras exhibited helicase activities but lost the ability to interact functionally with DnaG. However, G-p33 associates with DnaB to form mixed oligomers with stimulated ATPase activity comparable to that of the DnaB–DnaG complex and with helicase activity somewhat better than the sum of the individual G-p33 and DnaB helicase activities but worse than that of the DnaB/DnaG complex. Our data show that p16 (residues 454–597) can functionally replace p17 (residues 1–154) and restore the helicase activity when fused at the N-terminus of p33. Therefore, p16 and p17 are not only structural but also functional homologues. Furthermore, the helicase activity of G-p33 suggests that a DnaB6–DnaG6 complex may also be active in vivo. This is consistent with the notion that the stoichiometric variability of the DnaG molecules in the complex may be an important regulatory mechanism in bacterial DNA replication. Our findings are also consistent with the proposed DnaB–DnaG model that offers an initial platform to unravel the molecular mechanism of action of the bacterial helicase–primase complex.
Results and discussion
Fusing DnaG to the N-terminus of p33 restores the helicase activity
The B. stearothermophilus DnaB (Bird and Wigley, 1999) and DnaG (Pan et al., 1999) proteins form a stable functional complex in vitro (Bird et al., 2000; Thirlway et al., 2004). The interaction is mediated by the p16 domain [molecular weight (MW) 16 490 Da] of DnaG, as p16 also forms a stable complex with DnaB and stimulates its ATPase and helicase activities (Bird et al., 2000; Soultanas and Wigley, 2002). The p33 domain of DnaB is devoid of helicase activity despite the fact that it contains all the helicase signature motifs and has ATPase activity comparable to the intact DnaB (Bird et al., 2000). It forms hexamers but does not interact with DnaG and/or p16. By comparison the G-p33 chimera exhibited ATPase and helicase activities comparable to DnaB (Fig. 1). Both DnaB and gp33 helicase activities were much less compared with the activity of the DnaB/DnaG complex (Fig. 1). Therefore, G-p33 has restored helicase activity and its activity is not stimulated by the fused DnaG molecules in a manner analogous to DnaB interacting with DnaG. As p17 (MW 17 073 Da) is essential for helicase activity, it appears that fusing DnaG to p33 has provided the structurally homologous p16 domain to restore the helicase activity. To verify that the presence of p16 is sufficient to restore the helicase activity we fused p16 at the N-terminus of p33 to produce the p16-p33 chimera.
Fig. 1.

G-p33 exhibits helicase activity. Time-courses of the helicase activity of G-p33 were compared with the activities of p33, DnaB and the DnaB/DnaG complex. The quantitative analysis of the data from these gels is shown in the graph below. No activity was detectable for p33 and therefore no plot is shown for p33. The inset in the graph shows an expanded view of the G-p33 and DnaB graphs for clarity. All reactions with single proteins were carried out with 37.5 nM (hexamers) of the appropriate protein (G-p33, p33 or DnaB). Mixing experiments were carried out with 37.5 nM (hexamers) DnaB in the presence of 675 nM (monomers) DnaG. C1 represents a G-p33 reaction for 30 min in the absence of ATP, while C2 represents an equivalent reaction in the absence of protein. Lanes labelled ‘a’ and ‘b’ show annealed and boiled controls respectively.
Fusing of the p16 domain to p33 is sufficient to restore helicase activity but the chimera is not stimulated significantly by DnaG
Fusing p16 to p33 was sufficient to restore the helicase activity (Fig. 2). p16-p33 exhibited helicase activity marginally weaker than G-p33. Mixing the two chimeras together resulted in additive helicase activity (Fig. 2), while mixing G-p33 with DnaB resulted in activity marginally better than the sum of the activities of the separate proteins (Fig. 1), indicating that they may form mixed hexamers (see later). Therefore, simply swapping the p17 domain of DnaB with the p16 domain of DnaG is sufficient to preserve the helicase activity but abolishes the ability to be stimulated by DnaG. The question remains whether p16-p33 is unable to interact with DnaG or there is an interaction but it is non-functional. This question is answered later.
Fig. 2.

p16-p33 exhibits helicase activity. Fusing of the p16 domain to p33 has restored the helicase activity as shown in the top two graphs. Mixing p16-p33 with G-p33 shows an additive effect while mixing with DnaG shows no significant stimulation as that observed for the DnaB/DnaG complex in Fig. 1. Reactions with single proteins were carried out with 18.75 nM (hexamers) protein (p16-p33, G-p33 or p33). Mixing experiments were carried out with 18.75 nM (hexamers) in the presence of 675 nM (monomers) DnaG or 18.75 nM (hexamers) G-p33, as appropriate. Lanes labelled ‘a’ and ‘b’ show annealed and boiled controls respectively. C1 represents a p16-p33 reaction for 30 min in the absence of ATP. No activity was detectable for p33 and therefore no plot is shown for p33.
The helicase activity of G-p33 is not stimulated by DnaG
The presence of excess DnaG in mixing experiments with G-p33 did not cause stimulation of helicase activity (Fig. 3). Therefore, even in the presence of excess DnaG, G-p33 exhibits activity comparable to DnaB but less than the activity of the DnaB/DnaG complex. Mixing G-p33 with DnaB caused a stimulation of the helicase activity that was marginally more than the additive activities of both proteins alone (Fig. 3). By comparison mixing with p33 had no effect (Fig. 3). Again, the question whether there is a non-functional interaction or no interaction with DnaG is answered later.
Fig. 3.

G-p33 mixing experiments. Time-courses of the helicase activity of G-p33 in the presence or absence of DnaB, p33 and DnaG, as indicated. Mixing G-p33 with DnaB caused only an additive effect, whereas mixing with DnaG or p33 did not affect the helicase activity of G-p33. Data from these gels were plotted in the left graph. DnaG exhibited no detectable helicase activity and therefore no graph is shown for DnaG. The right graph is an expansion of the four graphs squashed at the bottom of the left graph, for clarity. Reactions with single proteins were carried out with 18.75 nM (hexamers) G-p33 or DnaB and 675 nM (monomers) DnaG. Mixing reactions were carried out with 18.75 nM (hexamers) G-p33 in the presence of 18.75 nM (hexamers) DnaB or p33 or 675 nM (monomer) DnaG. Lanes a1 and b represent annealed and boiled controls, respectively, while a2 represents a 30 min control reaction with G-p33 in the absence of ATP.
p16-p33 does not form a stable complex with DnaG
The lack of a DnaG-mediated stimulatory effect for both chimeras may be the result of either a non-functional interaction or no interaction at all with the DnaG. Because DnaB and DnaG form a complex in vitro that can be isolated by gel filtration we investigated the interactions of both chimeras with DnaG by analytical gel filtration, using two columns with different resolving power. As expected, DnaB formed a hexamer eluting at 10.25 ml and 13.91 ml through the Superdex S200 and Superose 6 columns, respectively, while DnaG was monomeric eluting at 13.39 ml and 16.28 ml through the same columns (Fig. 4A and B). The DnaB–DnaG complex eluted at 9.51 ml and 13.02 ml through the same columns (Fig. 4A and B). Neither of the columns had sufficient resolving power to separate clearly the complex from the DnaB hexamer, but a shift in the complex peak-maximum relative to that of DnaB alone, as well as SDS-PAGE analysis of fractions from the peaks, revealed the formation of the complex. p16-p33 eluted at 10.63 ml and 13.91 ml through the Superdex S200 and Superose 6 columns respectively (Fig. 4A and B). Mixing with excess DnaG did not reveal a shift in the peak, suggesting that p16-p33 does not form a stable complex with DnaG. Comparing the elution volumes of DnaB and p16-p33 suggests that the latter also forms hexamers. However, the p16-p33 peak appeared uneven and tailed slowly suggesting that although the main oligomeric form is hexameric, minor species of lower oligomers may also form.
Fig. 4.
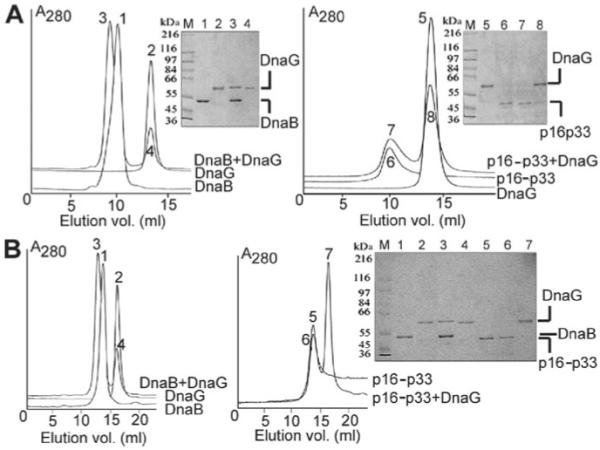
G-p33 and p16-p33 do not form a stable complex with DnaG.
A. The right panel shows a mixture of p16-p33 (969 nM hexamers) and DnaG (3.9 μM monomers) that was resolved through a Superdex S200 column and the elution profile compared with those of p16-p33 and DnaG alone. Samples from the peaks were analysed by SDS-PAGE. The left panel shows the same experiment carried out with DnaB and DnaG, for comparison.
B. The same experiment described in A was carried out but this time using a Superose 6 column.
For all the panels the arbitrary numbers on the peaks correspond to the same numbers of the lanes in the gel, as indicated. Molecular weight markers are shown in lane M.
The absence of a stable complex with DnaG in vitro does not preclude the formation of a transient complex. For example, E. coli DnaB and DnaG proteins form a transient functional complex that cannot be isolated by gel filtration but can be assayed by monitoring the effects on the ATPase and helicase activities. Although, we have shown that the presence of DnaG does not stimulate the helicase activity of p16-p33 we have not eliminated the possibility that the helicase and ATPase activities in p16-p33 have been uncoupled and therefore DnaG may be able to still interact transiently to stimulate only the ATPase activity. This was investigated by examining the effects of DnaG on the ATPase activities of p16-p33 and G-p33.
DnaG does not stimulate the ATPase activities of G-p33 and p16-p33
The steady-state ATPase kinetics of DnaB do not obey Michaelis–Menten kinetics (Bird et al., 2000). In the range 0–1.2 mM ATP the activity curve exhibits an apparent Michaelis–Menten behaviour but at higher ATP concentrations it becomes irregular. In order to compare quantitatively the activities of the chimeras and the effect of DnaG we investigated their activity profiles over the 0–1.2 mM ATP range. The ATPase activity of p16-p33 was assayed in the presence and absence of DnaG and compared with that of DnaB (Fig. 5A and B). p16-p33 exhibited an ATPase activity marginally less than DnaB and it was not stimulated by DnaG. As expected, the ATPase activity of DnaB was stimulated by DnaG. Because DnaG does not affect the ATPase and helicase activities and also does not form a stable complex with p16-p33, we conclude that the chimera has lost the ability to interact with DnaG. Because DnaG interacts with the linker region between p17 and p33 of DnaB it is likely that this region has been affected in the p16-p33 chimera thus abolishing the interaction. As expected, p33 also exhibited ATPase activity comparable to DnaB that was not stimulated by DnaG and DnaG had no detectable ATPase activity (Bird et al., 2000 and data not shown).
Fig. 5.

DnaG does not stimulate the ATPase activity of G-p33 and p16-p33. The effect of DnaG on the ATPase activity of DnaB (A), p16-p33 (B) and G-p33 (C) was examined. DnaG stimulated the activity of DnaB but exhibited no effect on the chimeras. All reactions were carried out in triplicate with 30 nM DnaB, p16-p33 or G-p33 in the presence and absence of 90 nM DnaG. DnaG stimulates the activity of DnaB but not the activities of the chimeras.
Similar experiments with G-p33 and DnaG also revealed that free DnaG does not stimulate the ATPase activity of G-p33 (Fig. 5C). The latter has an activity comparable to DnaB indicating that fusing DnaG to p33 does not result in stimulation of the ATPase activity of p33, despite the fact that it restores helicase activity. Therefore, the restoration of helicase activity by fusing DnaG or p16 to p33 is likely to be a consequence of restoring the formation of a functional hexamer on the DNA by providing the homologous p16 domain in place of the p17 domain. The stimulatory effects of DnaG on the DnaB helicase are transmitted by an interaction with the linker between p17 and p33 but this linker has been modified somewhat in both chimeras thus resulting in abolition of the interaction.
G-p33 and DnaB form mixed oligomers
G-p33 formed an oligomer eluting at 12.84 ml through the Superose 6 column, earlier than DnaB (13.91 ml) and the DnaB–DnaG complex (13.02 ml), indicating the formation of a bigger oligomer (compare Figs 4B and 6). Like the p16-p33 peak (see Fig. 4) the G-p33 peak also appeared somewhat uneven and tailed slowly, suggesting the presence of minor smaller oligomeric species. Mixing with a four molar excess of DnaB produced a new peak eluting at 7.47 ml earlier than the gp33 and DnaB peaks (Fig. 6). SDS-PAGE analysis revealed that both G-p33 and DnaB were present in this early peak, indicating the formation of a big species of ‘mixed oligomers’. Although the stoichiometry of the mixed oligomers can vary (DnaB5–G-p331, DnaB4–G-p332, DnaB3–G-p333, DnaB2–G-p334, DnaB1–G-p335), if we assume that the G-p33 oligomer is hexameric then mixing G-p33 and DnaB should have resulted in mixed oligomers smaller than the G-p33 hexamer but instead they appear to be bigger. Therefore, G-p33 does not form hexamers in solution in the absence of DNA. The precise stoichiometries of these oligomers were analysed by analytical ultracentrifugation (AUC). Similar mixing experiments with G-p33 and 2.2 molar excess of p16-p33 did not reveal a significant shift in the peaks with both G-p33 and p16-p33 peaks overlapping (data not shown).
Fig. 6.

A mixture of G-p33 (109.2 nM hexamers) and DnaB (464 nM hexamers) was separated through a Superose 6 gel filtration column. Two peaks were resolved. Samples from the peaks (labelled 3 and 4) were analysed by SDS-PAGE (lanes 3 and 4) and compared with control samples of DnaB (lane 1) and gp33 (lane 2). Both DnaB and G-p33 were present in the early peak indicating a mixed oligomer. Molecular weight markers are shown in lane M.
Determination of stoichiometry by AUC and its biological significance
In order to assign more accurately masses for these oligomers we carried out velocity ultracentrifugation analysis of G-p33, p16-p33, DnaB and the G-p33/DnaB mixture (Fig. 7). DnaB has been shown previously by velocity and equilibrium ultracentrifugation analysis to form hexamers (Bird et al., 2000; Haroniti et al., 2003). Under our experimental conditions, in velocity ultracentrifugation experiments DnaB sedimented with major peaks at 7.3S corresponding to a mass of 300–350 kDa, consistent with a hexamer (303 858 Da) (Fig. 7A). There is a minor component (Fig. 7A) that on first analysis could correspond to an octamer; however, trace aggregate species that are not resolved using this technique can cause a lengthening and slight skewing of the distributions along the molecular weight axis. This is because this parameter is the least resolved hydrodynamic paramater in sedimentation velocity experiments (Brown and Schuck, 2006). However, even with this minor component the analysis shows clearly that the majority of DnaB is hexameric. p16-p33 exhibited a single major oligomer with an apparent sedimentation coefficient s* = 7S, corresponding to a mass between 260 and 310 kDa, consistent with a hexamer (301 966 kDa) (Fig. 7B). By comparison, G-p33 exhibited a major oligomer with an apparent sedimentation coefficient s* = 8.8S corresponding to a mass between 350 and 450 kDa, consistent with a tetramer (403 905 Da), possibly a dimer of dimers (Fig. 7C), again as there is a mixture of minor species, the resolution of these species along the molecular weight axis is lowered. However, the major higher order species appears to be a tetramer. It is unlikely that the tetramer will be the oligomer that carries out the helicase reaction. Instead, G-p33 should be able to re-assemble onto the DNA as a functional hexamer to unwind the duplex. Such a hexamer will have six DnaG molecules attached to six molecules of p33 and will be equivalent to a DnaG6–DnaB6 complex. The fact that it displays helicase activity is of biological significance, suggesting that it is not only the major DnaG3–DnaB6 complex that can carry out unwinding. Indeed, other complexes with variable stoichiometries (DnaG2–DnaB4 and DnaG1–DnaB5) have been observed (Thirlway et al., 2004). Such variable complexes will result in different inter-subunit cross-talk between the primase molecules in the complex. Such differences will be crucial for primer site selection and the regulation of primer length during DNA replication (Corn et al., 2005). Furthermore, the helicase activity of the G-p33 chimera suggests that a DnaG6–DnaB6 complex is also active, consistent with the notion that the in vivo function of the complex is regulated via intersubunit cross-talk between the primase molecules.
Fig. 7.

Analysis of stoichiometries by velocity ultracentrifugation using c(s,ffo) analysis. Contours are coloured from blue to red as the probability of a species with that combination of molecular weights/sedimentation coefficients increases.
A. DnaB. Here DnaB exhibits predominately a hexameric oligomeric state. There is a trace of minor aggregate that skews the trace in the molecular weight axis; however, the predominate species still can be seen to be DnaB6.
B. p16-p33. This is a single species and is clearly a hexamer.
C. Gp33. The predominate species is tetrameric. Again, as in the case of DnaB, there is a trace of higher order aggregate that skews the trace along the molecular weight axis. However, again, the highest probability species is G-p334.
D. DnaB + G-p33. Here the possible species free DnaB6 (301 966 kDa) and complexes G-p331–DnaB5 (354 191 kDa), G-p332–DnaB4 (404 524 kDa) and G-p332–DnaB10 (708 382 kDa) are marked.
p16 and p17 are structural and functional homologues
The unique structural homology of the p16 and p17 domains raises one obvious question. Is this structural homology fortuitous or a reflection of functional significance? The p33 domain of DnaB has all the helicase signature motifs and displays ATPase activity comparable to full-length DnaB but it does not have helicase activity. Therefore, p17 seems to be essential for helicase activity. A simple replacement of p17 by p16 restores the helicase activity on p33 directly implying a functional homology. Indeed both domains may have arisen from a linker domain in a single ancestral protein with both primase and helicase activities (Ilyina et al., 1992; Soultanas, 2005). The p16 domain acquired the C-terminal hairpin (C2 subdomain) that is involved directly in the interaction with the helicase, while the C1 subdomain maintained the necessary features (found also in p17) that are essential for helicase activity (Soultanas, 2005; Thirlway and Soultanas, 2006). The G-p33 chimera could be considered as a protein analogous to this ancestral bi-functional primase–helicase protein.
Experimental procedures
Engineering the DnaG-P33, P16-P33 and P12-P49-DnaB chimeras
The DNA fragments coding for B. stearothermophilus DnaG, p16 and p33 had been cloned previously as pET21d-dnaG, pET21d-p16 and pET22d-p33 respectively (Bird et al., 2000; Brown and Schuck, 2006). The cloning strategy involved a combination of polymerase chain reaction (PCR) and ‘cut and paste’ reactions summarized in Fig. 8. PCRs were carried out with KOD DNA polymerase (Novagen), according to the manufacturer’s instructions, to obtain the dnaG gene flanked by NdeI sites and abolish the stop codon. The forward primer (GBF) was 5′-GAGATATTACCCATATGGGACATCGCATTCCCG-3′. The start codon is italicized. The reverse primer (GBB) was 5′-GGCCGCAAGCCTACATATGTGAGGAAGATAACA-3′. In both primers the NdeI site is emboldened and areas of mismatch are underlined. The PCR product was treated with NdeI and the p16 3′ fragment (Fig. 8A and B) was gel-extracted and inserted by ligation into the NdeI linearized pET22b-p33. Clones with the insert in the correct orientation produced the pET22b-p16 3′-p33* intermediate construct (Fig. 8C). The XbaI-SacI fragment from the pET21d-dnaG vector was then inserted into the equivalent sites of the pET22b-p16 3′-p33 vector (Fig. 8D and E) to produce the pET22b-dnaG-p33 vector coding for the G-p33 chimera (Fig. 8F). The XbaI-SacI fragment from the pET21d-p16 vector was also inserted into the equivalent sites of the pET22b-p16 3′-p33 vector (Fig. 8D and E) to produce the pET22b-p16-p33 vector coding for the p16-p33 chimera (Fig. 8F). The sequences and the domain boundaries of all the proteins used in this study are shown in Fig. S2.
Fig. 8.

Engineering of G-p33 and p16-p33 chimeras. A schematic diagram outlining the cloning steps involved in the engineering of the pET22b-dnaG-p33 and pET22b-p16-p33 vectors coding for the G-p33 and p16-p33 chimeras respectively. For a detailed explanation see Experimental procedures and Fig. S1.
Protein purifications
The amino acid sequences and molecular weights of all proteins used in this study are shown in the Supplementary material (Fig. S1). DnaB (amino acids 1–454; MW 50 643 Da), DnaG (amino acids 1–597; MW 67 111 Da) and p33 (amino acids 154–454; MW 33 587 Da) were purified as described before (Bird et al., 2000). The Gp33 (MW 100 976 Da) and p16-p33 (MW 50 658 Da) chimeras were overexpressed in E. coli BL21 DE3 and purified by a combination of HiTrap Heparin, Resource Q and Superdex S200 columns. After the final gel filtration step the proteins were greater than 99% pure as determined by SDS-PAGE (Fig. 9). All proteins were in a final solution of 50 mM Tris pH 7.4, 2 mM EDTA, 1 mM DTT, 100 mM NaCl, 10% v/v glycerol and stored at −80°C.
Fig. 9.

All the proteins used in this study.
A. A schematic diagram indicating the domain organization of DnaB and DnaG and the domain swapping carried out to construct three chimeras. The domain boundaries are indicated by amino acid numbers for the DnaB and DnaG proteins, as indicated (see also Supplementary material).
B. SDS-PAGE analysis showing the purified proteins used in this study.
Helicase assays
The DNA substrate for helicase reactions was prepared by radiolabelling the oligonucleotide 5′-GTTATTGCATGAAAGCCCGGCTGACTCTAGAGGATCCCCGGGTACGTTATTGCATGAAAGCCCGGCTG-3′ at the 5′ end using [γ -32P]-ATP and T4 polynucleotide kinase and annealing to ssM13mp18 to produce a 3′-5′ tailed DNA substrate. One molecule of DNA substrate is defined as one molecule of ssM13mp18 with one molecule of oligonucleotide annealed to it. Reactions were carried out in 50 mM Tris pH 7.4, 50 mM NaCl, 12.5 mM MgCl2, 2.5 mM ATP, 1 mM DTT, 2.5 nM DNA substrate and the appropriate proteins as indicated for each experiment, at 37°C.
In mixing experiments the appropriate proteins were mixed separately and incubated at room temperature for 10 min to enhance complex formation. Reactions were initiated by the addition of ATP and 20 μl of samples was removed at appropriate time intervals. The reaction was terminated by the addition of 5 μl of stop buffer (0.4% w/v SDS, 40 mM EDTA, 8% v/v glycerol, 0.1% w/v bromophenol blue) and stored briefly at 4°C, prior to electrophoresis through a non-denaturing 10% v/v polyacrylamide min-gel at constant voltage, 130 V. Gels were dried under vacuum, imaging and quantitative analysis was carried out by a Molecular Imager FX (Bio-Rad) and associated software. Data were plotted as percentage of radiolabelled oligonucleotide displaced versus time.
ATPase assays
The DNA-independent ATPase activities of DnaB, p33 and the chimeras were assayed by monitoring the ATP-dependent oxidation of NADH to NAD at 340 nm, as described previously (Bird et al., 2000). Unless otherwise stated, all experiments were carried out in the same buffer used for the helicase assays, using 30 nM hexamers DnaB, p16-p33 or G-p33 in the presence or absence of 90 nM DnaG monomers and varying concentrations of ATP. All experiments were carried out in triplicate. Average turnover numbers were plotted as a function of ATP concentration.
Analytical gel filtration
Analytical gel filtration experiments were carried out using Superose 6 and Superdex S200 gel filtration columns (Amersham Pharmacia Biotech), as described previously (Bird et al., 2000; Thirlway et al., 2004). Briefly for the p16-p33 and DnaG mixing experiments, 969 nM p16-p33 hexamers were mixed with 3.9 μM DnaG monomers, left for 10 min at room temperature and then separated through either a Superdex S200 or Supersoe 6 column in 50 mM Tris pH 7.4, 2 mM EDTA, 100 mM NaCl, 1 mM DTT. Samples from the peaks were analysed by SDS-PAGE. Control experiments with DnaB and DnaG were carried out for comparison.
For the G-p33 and DnaB mixing experiments, the two proteins were mixed at 109.2 nM G-p33 hexamers and 464 nM DnaB hexamers, left for 10 min at room temperature and then separated through a Superose 6 column in the same buffer as above. Control experiments with G-p33 (109.2 nM hexamers) and DnaB (464 nM hexamers) were also carried out for comparison.
Analytical ultracentrifugation
All sedimentation velocity AUC experiments were carried out using a Beckman-Coulter XL-A AUC. Samples were loaded into two channel centrepieces and data were taken at 280 nm in 5 min intervals at 40 000 r.p.m. The resulting sedimentation velocity data were analysed using the program sedfit (http://www.analyticalultracentrifugation.com), using the c(s,ffo) analysis as described elsewhere (Brown and Schuck, 2006). All data were fitted with to this model with a residual Z-statistic of between 1 and 4, indicating excellent fits to the data. Data were converted for display in contour plots using Sigmaplot v8.0 (Jandel Software).
Supplementary Material
Fig. S1. The NMR structure of the B. stearothermophilus p16 domain of DnaG and the crystal structure of the E. coli p17 domain of DnaB. The C1 and C2 subdomains of p16 are indicated with different colours.
Fig. S2. Detailed primary sequence and molecular weight information for all the domains and proteins used in this study.
Acknowledgements
This work was supported by a BBSRC grant to P.S. (BB/ E004717/1).
Footnotes
This material is available as part of the online article from http://www.blackwell-synergy.com
Please note: Blackwell Publishing is not responsible for the content or functionality of any supplementary materials supplied by the authors. Any queries (other than missing material) should be directed to the corresponding author for the article.
References
- Bhattacharyya S, Griep MA. DnaB helicase affects the initiation specificity of E. coli primase on single-stranded DNA templates. Biochem. 2000;39:745–752. doi: 10.1021/bi991555d. [DOI] [PubMed] [Google Scholar]
- Bird LE, Wigley DB. The B. stearothermophilus replicative helicase: cloning, overexpression and activity. Biochim Bioph Acta. 1999;1444:424–428. doi: 10.1016/s0167-4781(99)00024-x. [DOI] [PubMed] [Google Scholar]
- Bird LE, Pan H, Soultanas P, Wigley DB. Mapping protein : protein interactions within a stable complex of DNA primase and DnaB helicase from B. stearothermophilus. Biochem. 2000;39:171–182. doi: 10.1021/bi9918801. [DOI] [PMC free article] [PubMed] [Google Scholar]
- Biswas SB, Chen PH, Biswas EE. Structure and function of E. coli DnaB protein: role of the N-terminal domain in helicase activity. Biochem. 1994;33:11307–11314. doi: 10.1021/bi00203a028. [DOI] [PubMed] [Google Scholar]
- Brown PH, Schuck P. Macromolecular size-and-shape distributions by sedimentation velocity analytical ultracentrifugation. Biophy J. 2006;20:4651–4661. doi: 10.1529/biophysj.106.081372. [DOI] [PMC free article] [PubMed] [Google Scholar]
- Corn JE, Pease PJ, Hura GL, Berger JM. Crosstalk between primase subunits can act to regulate primer synthesis in trans. Mol Cell. 2005;20:391–401. doi: 10.1016/j.molcel.2005.09.004. [DOI] [PubMed] [Google Scholar]
- Fass D, Bogden CE, Berger JM. Crystal structure of the N-terminal domain of the DnaB hexameric helicase. Structure. 1999;7:691–698. doi: 10.1016/s0969-2126(99)80090-2. [DOI] [PubMed] [Google Scholar]
- Frick DN, Richardson CC. DNA primases. Annu Rev Biochem. 1999;70:39–80. doi: 10.1146/annurev.biochem.70.1.39. [DOI] [PubMed] [Google Scholar]
- Haroniti A, Anderson C, Doddridge Z, Gardiner L, Roberts CJ, Allen S, Soultanas P. The clamp-loader-helicase interaction in Bacillus. Atomic force microscopy reveals the structural organization of the DnaB-τ complex in Bacillus. J Mol Biol. 2003;336:381–393. doi: 10.1016/j.jmb.2003.12.043. [DOI] [PMC free article] [PubMed] [Google Scholar]
- Ilyina TV, Gorbalenya AE, Koonin EV. Organization and evolution of bacterial and bacteriophage primase-helicase systems. J Mol Evol. 1992;34:351–357. doi: 10.1007/BF00160243. [DOI] [PubMed] [Google Scholar]
- Johnson SK, Bhattacharyya S, Griep MA. DnaB helicase stimulates primer synthesis activity on short oligonucleotide templates. Biochem. 2000;39:736–744. doi: 10.1021/bi991554l. [DOI] [PubMed] [Google Scholar]
- Koepsell SA, Larson MA, Griep MA, Hinrichs SH. Staphylococcus aureus helicase but not Escherichia coli helicase stimulates S. aureus primase activity and maintains initiation specificity. J Bacteriol. 2006;188:4673–4680. doi: 10.1128/JB.00316-06. [DOI] [PMC free article] [PubMed] [Google Scholar]
- Lee J-B, Hite RK, Hamdan SM, Sunney-Xie X, Richardson CC. DNA primase acts as a molecular brake in DNA replication. Nature. 2006;439:621–624. doi: 10.1038/nature04317. [DOI] [PubMed] [Google Scholar]
- Lu YB, Ratnakar PVAL, Mohanty BK, Bastia D. Direct physical interaction between DnaG primase and DnaB helicase of E. coli is necessary for optimal synthesis of primer RNA. Proc Natl Acad Sci USA. 1996;93:12902–12907. doi: 10.1073/pnas.93.23.12902. [DOI] [PMC free article] [PubMed] [Google Scholar]
- Maurer R, Wong A. Dominant-lethal mutations in the dnaB helicase gene of Salmonella typhimurium. J Biol Chem. 1988;278:52253–52261. doi: 10.1128/jb.170.8.3682-3688.1988. [DOI] [PMC free article] [PubMed] [Google Scholar]
- Mitkova AV, Khopde SM, Biswas SB. Mechanism and stoichiometry of interaction of DnaG primase with DnaB helicase of E. coli in RNA primer synthesis. J Biol Chem. 2003;278:52253–52261. doi: 10.1074/jbc.M308956200. [DOI] [PubMed] [Google Scholar]
- Oakley AJ, Loscha KV, Schaeffer PM, Liepinsh E, Pintacuda G, Wilce MC, et al. Crystal and solution structures of the helicase-binding domain of E. coli primase. J Biol Chem. 2005;280:11495–11504. doi: 10.1074/jbc.M412645200. [DOI] [PubMed] [Google Scholar]
- Pan H, Bird LE, Wigley DB. Cloning, expression and purification of B. stearothermophilus DNA primase and crystallization of the zinc-binding domain. Biochim Bioph Acta. 1999;1444:429–433. doi: 10.1016/s0167-4781(99)00025-1. [DOI] [PubMed] [Google Scholar]
- Patel SS, Picha KM. Structure and function of hexameric helicases. Ann Rev Biochem. 2000;69:651–697. doi: 10.1146/annurev.biochem.69.1.651. [DOI] [PubMed] [Google Scholar]
- Soultanas P. The bacterial helicase–primase interaction: a common structural/functional module. Structure. 2005;13:839–844. doi: 10.1016/j.str.2005.04.006. [DOI] [PMC free article] [PubMed] [Google Scholar]
- Soultanas P, Wigley DB. Site-directed mutagenesis reveals roles for conserved amino acid residues in the hexameric DNA helicase DnaB from B. stearothermophilus. Nucleic Acids Res. 2002;30:4051–4060. doi: 10.1093/nar/gkf527. [DOI] [PMC free article] [PubMed] [Google Scholar]
- Stordal L, Maurer R. Defect in general priming conferred by linker region mutants of Escherichia coli DnaB. J Bacteriol. 1996;178:4620–4627. doi: 10.1128/jb.178.15.4620-4627.1996. [DOI] [PMC free article] [PubMed] [Google Scholar]
- Syson K, Thirlway J, Hounslow AM, Soultanas P, Waltho JP. The solution structure of the helicase interaction domain of the primase DnaG: a model for the helicase activation. Structure. 2005;13:609–616. doi: 10.1016/j.str.2005.01.022. [DOI] [PMC free article] [PubMed] [Google Scholar]
- Thirlway J, Soultanas P. In the B. stearothermophilus DnaB–DnaG complex the activities of the two proteins are modulated by distinct but overlapping networks of residues. J Bacteriol. 2006;188:1534–1539. doi: 10.1128/JB.188.4.1534-1539.2006. [DOI] [PMC free article] [PubMed] [Google Scholar]
- Thirlway J, Turner IJ, Gibson CT, Gardiner L, Brady K, Allen S, et al. DnaG interacts with a linker region that joins the N- and C-terminal domains of DnaB and induces the formation of 3-fold symmetric rings. Nucleic Acids Res. 2004;32:2977–2986. doi: 10.1093/nar/gkh628. [DOI] [PMC free article] [PubMed] [Google Scholar]
- Tougu K, Marians KJ. The interaction between helicase and primase sets the replication fork clock. J Biol Chem. 1996;271:21398–21405. doi: 10.1074/jbc.271.35.21398. [DOI] [PubMed] [Google Scholar]
- Tougu K, Peng H, Marians KJ. Identification of a domain of Escherichia coli primase required for functional interaction with the DnaB helicase at the replication fork. J Biol Chem. 1994;269:4675–4682. [PubMed] [Google Scholar]
- Weigelt J, Brown SE, Miles CS, Dixon NE, Otting G. NMR structure of the N-terminal domain of E. coli DnaB helicase: implications for structure rearrangements in the helicase hexamer. Structure. 1999;7:681–690. doi: 10.1016/s0969-2126(99)80089-6. [DOI] [PubMed] [Google Scholar]
- Yu X, Jezewska MJ, Bujalowski W, Egelman EH. The hexameric E. coli DnaB helicase can exist in different quaternary states. J Mol Biol. 1996;259:7–14. doi: 10.1006/jmbi.1996.0297. [DOI] [PubMed] [Google Scholar]
- Yuzhakov A, Kelman Z, O’Donnell M. Trading places on DNA – a three point switch underlies primer handoff from primase to the replicative DNA polymerase. Cell. 1999;96:153–163. doi: 10.1016/s0092-8674(00)80968-x. [DOI] [PubMed] [Google Scholar]
Associated Data
This section collects any data citations, data availability statements, or supplementary materials included in this article.
Supplementary Materials
Fig. S1. The NMR structure of the B. stearothermophilus p16 domain of DnaG and the crystal structure of the E. coli p17 domain of DnaB. The C1 and C2 subdomains of p16 are indicated with different colours.
Fig. S2. Detailed primary sequence and molecular weight information for all the domains and proteins used in this study.