

Abstract
Computer-aided diagnostic (CAD) schemes have been developed for assisting radiologists in the detection of various lesions in medical images. The reliable evaluation of CAD schemes is as important as the development of such schemes in the field of CAD research. In the past, many evaluation approaches, such as the resubstitution, leave-one-out, cross-valiation, and hold-out methods, have been proposed for evaluating the performance of various CAD schemes. However, some important issues in the evaluation of CAD schemes have not been analyzed systematically, either theoretically or experimentally. Such important issues include (1) the analysis and comparison of various evaluation methods in terms of some characteristics, in particular, the bias and the generalization performance of trained CAD schemes; (2) the analysis of pitfalls in the incorrect use of various evaluation methods and the effective approaches to reduction of the bias and variance caused by these pitfalls; (3) the improvement of generalizability for CAD schemes trained with limited datasets. This article consists of a series of three closely related studies that address the above three issues. We believe that this article will be useful to researchers in the field of CAD research who can improve the bias and generalizability of their CAD schemes.
Keywords: computer-aided diagnosis, CAD, resubstitution, leave-one-out, hold-out, cross validation, bias, variance, generalization performance
I. Introduction
Computer-aided diagnostic (CAD) schemes have been developed for detecting various lesions in many medical imaging modalities, including conventional radiography, computed tomography, magnetic resonance imaging, and ultrasound imaging. An important issue for CAD schemes is the reliable evaluation of their performance levels. In early publications on CAD research, a resubstitution (RS) method was commonly used for the evaluation of CAD schemes [1,2]. Because the performance level estimated by use of the RS method is optimistically biased, in recent years investigators have begun to employ more reliable evaluation methods such as the leave-one-out (LOO), cross-validation (CV), and hold-out (HO) methods. However, to our knowledge, no investigator has systematically analyzed and compared these common evaluation methods in terms of some important characteristics, in particular, the bias and generalization performance. As a result, the selection of an evaluation method is generally empirical, and sometimes even arbitrary, in many studies on CAD development. Our first aim was thus to provide such a comprehensive analysis and comparison in order to help researchers select appropriate evaluation methods for improving the quality and reliability of the performance evaluation of their CAD schemes.
An important characteristic of various evaluation methods is the bias in the estimated performance level of a CAD scheme. Some evaluation methods such as LOO, CV, and HO are almost unbiased only if they are used appropriately. Incorrect use of these methods can lead to significant bias in the estimated performance levels. To understand whether CAD schemes were appropriately evaluated in recent publications, we reviewed all research articles on the development and evaluation of CAD schemes that were published in prestigious journals such as Medical Physics and IEEE Transactions on Medical Imaging in 2004. Among the 10 papers we reviewed, nine employed flawed evaluation methods leading to increased bias and variance in the estimated performance levels. Therefore, we identified a number of typical pitfalls in the incorrect evaluation methods for CAD schemes, and we conducted experiments to demonstrate quantitatively the extent of bias and/or variance caused by each of the pitfalls. In addition, for promoting and utilizing a high standard for reliable evaluation of CAD schemes, we attempted to make recommendations, whenever possible, for overcoming these pitfalls. This was our second aim for this article.
Another important characteristic of various evaluation methods is the generalization performance level, which measures how well a trained CAD scheme will perform when it is applied to a large number of future new cases. Apparently, it is very important to improve the generalization performance of a CAD scheme in order to provide an increased performance level for new cases. Because, to our knowledge, the improvement of the generalization performance of a CAD scheme has not been studied to date, we attempted to address this issue in this article. It is well known that one of the most effective ways to improve the generalization performance of CAD schemes is to increase the sample size of the training dataset. Although we cannot increase the actual size of a given training dataset, we do have means to expand the “effective” size of that dataset. To do so, we first estimate the probability density function (PDF) from the real cases in the training dataset, and then generate some “virtual” cases from the estimated PDF whose characteristics are similar to those of the given “real” cases, and finally add the virtual cases to the given real cases to form an expanded dataset. With the expanded dataset, we are able to improve the generalization performance of a trained CAD scheme. This was our third aim for this article. In accordance with the three aims, we conducted three studies, i.e., the comparison of various evaluation methods in terms of important characteristics including primarily the bias and generalization performance; the reduction of the bias in the estimated performance; and the improvement of the generalization performance for CAD schemes trained with small datasets.
II. Study 1: Analysis and comparison of various evaluation methods
II-1. Generalization performance, estimated performance, and bias
For a CAD scheme trained with a finite sample, there are two performance levels. The first is the generalization performance, which measures how well the CAD scheme would perform for a population of patients (all future new cases). The generalization performance is what investigators want to know when developing a CAD scheme. Once a CAD scheme is trained, its generalization performance is a fixed value. Unfortunately, the generalization performance is usually unachievable in practice because investigators are unable to obtain the population of patients when the CAD scheme is designed. Therefore, one often has to estimate the performance by applying the trained CAD scheme to a small test sample, generally with tens or hundreds of patients. The estimated performance is a random value that depends on the small test sample used, and therefore can be higher or lower than the generalization performance. If, on average, the generalization and estimated performance levels are the same, the estimated performance is unbiased; otherwise, it is biased, either optimistically (when the mean estimated performance is greater than the generalization performance) or pessimistically (when the mean estimated performance is less than the generalization performance). Different evaluation methods (RS, LOO, CV, and HO) have different ways to select the test sample and, consequently, can be either biased or unbiased. The bias and generalization performance are two important concepts for evaluation of CAD schemes.
II-2. Methods
The first study, i.e., the analysis and comparison of various evaluation methods in terms of the bias and generalization performance, was conducted based on datasets obtained from 4 Monte Carlo simulation experiments with 4 different sample sizes N (N=50, 100, 150, 200). Each Monte Carlo experiment consisted of 100 trials. In each trial, we randomly generated N normal and N abnormal synthetic objects. Each object had 6 features. For normal objects, each feature obeyed a Gaussian distribution with a variance of 1 and a mean of 0. For abnormal objects, each of the six features obeyed a Gaussian distribution with a variance of 1 and respective means of {0.9, 0.9, 0.9, 0.75, 0.75, 0.75}. We trained a CAD algorithm and calculated its estimated performance levels by use of the RS, LOO, and HO methods. We also created a massive test dataset with 10,000 normal and 10,000 abnormal objects and applied the trained CAD algorithm to the massive test dataset for determination of the generalization performance levels of the CAD scheme. The mean difference between the generalization performance and the estimated performance was determined as the bias in the estimated performance.
The CAD algorithm employed consisted of three steps. The first step was the selection of features based on Wilks’ lambda and the corresponding F-value [3,4]. The second step was the application of a classifier based on a Bayesian artificial neural network (ANN) [5,6]. The third step was the selection of a cutoff threshold for the output values of the ANN [7]. In this experiment, we always selected the cutoff threshold in such a way that a sensitivity of 0.80 could be achieved. The average of the sensitivity and specificity was calculated as the accuracy and was employed as a performance level for this study. We primarily analyzed and compared 3 different evaluation methods, i.e., RS, LOO, and HO. We did not include the CV method because its characteristics are similar to those of either LOO or HO. However, we listed the characteristics of the CV evaluation method in a table.
In a practical situation, one is provided with a finite sample for developing a CAD scheme. The sample is often partitioned into at least two subsets, i.e., a training set and a test set. The former is used for training a CAD scheme, and the latter for obtaining the estimated performance. In the RS method, the entire sample is used for both training and testing of a CAD scheme. In a k-fold CV method, the entire sample is first randomly partitioned into k disjoint subsets of nearly equal size, and then each of the k subsets is used as a test set for evaluation of a CAD scheme trained on the other (k-1) subsets. When the size of the subset is equal to 1, the CV is equivalent to the LOO method. In the HO method, the entire sample is partitioned into two subsets (not necessarily, but often, of equal size), one of which is used only for training of the CAD scheme, and the other only for testing of the trained classifier, which yields the estimated performance.
II-3. Results
Figure 1 shows the generalization accuracies of the CAD schemes trained with the RS, LOO, and HO methods for the 100 trials of the Monte Carlo experiment. It is apparent from Fig. 1 that the curves of the generalization accuracies for the RS and LOO methods almost overlap, which indicates that the CAD algorithms trained with the RS and LOO methods had almost the same generalization accuracies. This was because the RS and LOO methods employed almost the same number of cases for the training of their respective CAD algorithms (more precisely, the RS method used all cases, and the LOO method used all but one case in the available sample). Another important observation is that the CAD algorithms trained with the RS and LOO methods achieved a higher generalization accuracy than did the CAD algorithms trained with the HO method, because the HO method utilized only half of the available sample for training of the CAD algorithm. Therefore, with a given sample of cases, CAD schemes trained with the RS and LOO will provide better results for a large number of future cases than that trained with the HO method.
Figure 1.
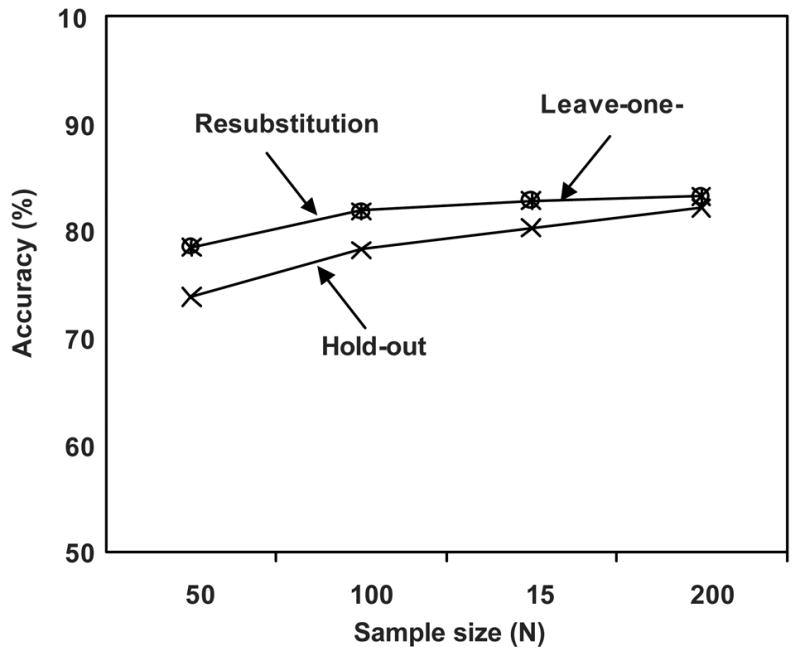
Generalization performance levels obtained with the resubstitution, leave-one-out, and hold-out methods for 100 trials of Monte Carlo experiments
Figure 2(a) shows the generalization accuracies and the mean estimated accuracies for the 100 trials by use of the RS method. Because the mean estimated accuracies were much higher than the generalization accuracies, in particular when the available samples were small, the estimated accuracies were optimistically biased. Figures 2(b) and 2(c) show the generalization accuracies and the mean estimated accuracies for the 100 trials by use of, respectively, the LOO and HO methods. Because the mean estimated accuracies by use of the LOO and HO methods were almost equal to the corresponding generalization accuracies, the LOO and HO methods were almost unbiased.
Figure 2.

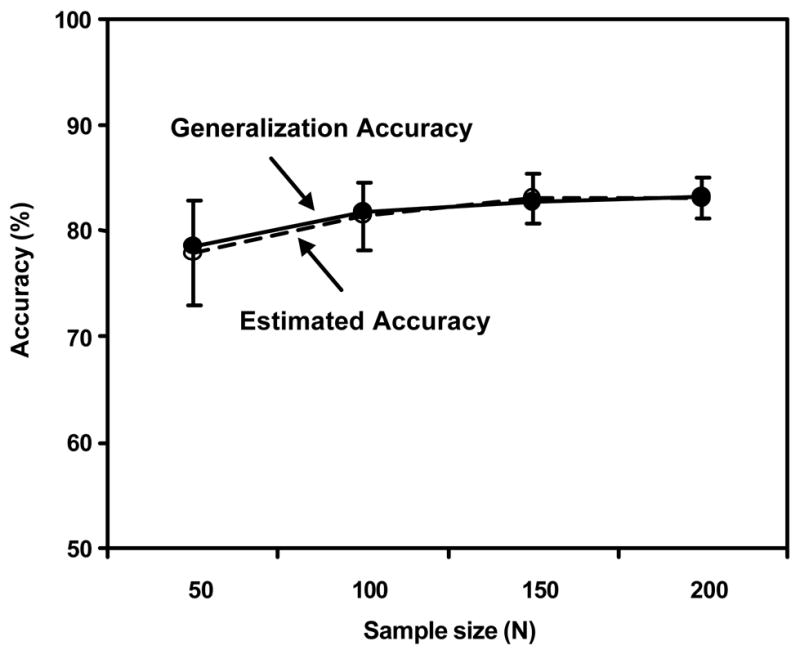
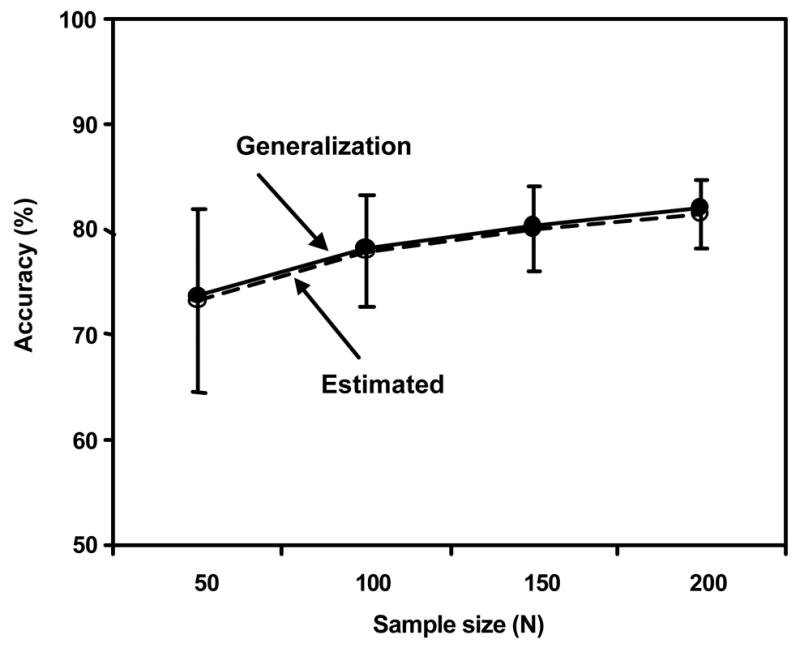
Figure 2(a) Generalization accuracy and mean estimated accuracy for the resubstitution method
Figure 2(b) Generalization accuracy and mean estimated accuracy for the leave-one-out method
Figure 2(c) Generalization accuracy and mean estimated accuracy for the hold-out method
II-4. Application of various evaluation methods
Table 1 summarizes the goodness of the generalization accuracy, the bias of the estimated accuracy, and an additional important characteristic, i.e., the uniqueness of the CAD algorithm, for the RS, LOO, and HO evaluation methods, as well as 2-fold and 10-fold cross-validation methods. The uniqueness of the CAD scheme implies that a single CAD scheme is obtained with a specific evaluation method. It is apparent from the table that each evaluation method has its critical shortcoming. For example, the RS method estimates an optimistically biased accuracy; the HO method provides a degraded generalization accuracy for future new cases; and the LOO method does not provide a unique CAD algorithm for a given sample because each case in the sample corresponds to a different CAD scheme. In our opinion, no single evaluation method is universally superior to the others.
Table 1.
Important characteristics of the resubstitution, leave-one-out, hold-out, and cross-validation evaluation methods
| Evaluation method | Unique CAD algorithm? | Good generalization accuracy? | Almost unbiased estimated accuracy? |
|---|---|---|---|
| Resubstitution | Yes | Yes | No |
| Hold-out | Yes | No | Yes |
| Leave-one-out | No | Yes | Yes |
| 2-fold cross-validation | No | No | Yes |
| 10-fold cross-validation | No | Yes | Yes |
In the early stage of CAD development conducted in many research institutions, investigators often want to estimate the accuracy of their CAD algorithm reliably based on a given finite sample, whereas it is often not important whether a unique CAD algorithm exists. In such situations, the LOO method appears superior to the others because it can provide an almost unbiased accuracy estimate for a CAD algorithm with “good” generalization performance. Neither the RS method nor the HO method is appropriate for these situations, because the former provides a biased performance estimate, and the latter does not provide a performance level as good as what the LOO method provides.
In some other situations, investigators not only are interested in the accuracy of their CAD algorithm, but also want to conduct an observer performance study with a unique trained CAD algorithm, in order to examine whether their CAD algorithm helps radiologists improve their diagnostic performance. The essential requirements in such situations are the uniqueness of a CAD algorithm and the unbiased performance estimate for the cases to be used in the observer study. It is apparent that, in these situations, the HO method is more appropriate than the other methods. To employ the HO method, one first reserves a test subset from the available sample for the observer performance study, then trains the CAD algorithm with the remaining cases, and finally applies the trained CAD algorithm to the reserved test set to obtain an unbiased accuracy estimate. The output of the CAD algorithm for the reserved test set will also be shown to the radiologists in the observer performance study.
Further, in more realistic situations, investigators want to design practical CAD systems for future use, such as all commercial CAD systems and some prototype CAD systems designed for clinical evaluation in some research institutions. Such a CAD system should be a unique one with a good generalization performance for new cases; and, if possible, the generalization performance of the CAD system should be reliably estimated at the time when the system is designed. Although none of the evaluation methods satisfies all of the above requirements, the combination of the RS and LOO methods should be adequate for such situations. The CAD designers can first employ the RS method to design a unique CAD system with a good generalization performance. They can then employ the LOO method to estimate the generalization performance reliably. Such an estimate of generalization performance is an unbiased one for the LOO method, and is also an unbiased one for the RS method employed in the design of the CAD system, because, as shown in Fig. 1, the generalization performance for the RS and that for the LOO method are almost the same.
III. Study 2: Reduction of bias and variance in the estimated performance
As shown in Table 1, the LOO, CV, and HO methods are almost unbiased only if they are used appropriately. Their improper use can lead to significant bias in the estimated performance levels. In addition to the bias, another important factor for reliable evaluation of CAD schemes is the variance of the estimated performance levels. In this second study, we analyze some typical pitfalls that may introduce bias and increase the variance, and we attempt to minimize the bias and variance by correcting these pitfalls [8].
III-1. Pitfall 1: Training and testing only part of a CAD scheme with an appropriate evaluation method
A CAD scheme generally consists of three major steps, i.e., feature selection, classifier, and cutoff threshold selection [8]. In the ten CAD-related papers we reviewed that were published in Medical Physics and IEEE Transactions on Medical Imaging in 2004, most investigators included only the classifier step in their evaluation methods such as the LOO and CV methods, and they left out other steps such as feature selection and cutoff threshold selection. This implies that the steps of feature selection and cutoff threshold selection are trained and tested with an RS evaluation method based on not only a training dataset, but also a test dataset.
We conducted a Monte Carlo simulation experiment with 50 abnormal and 200 normal synthetic objects to verify that the bias caused by such a pitfall can be large. Our CAD scheme consisted of three steps, including feature selection, classifier [linear discriminant analysis (LDA)], and cutoff threshold selection. We employed 4 LOO-based evaluation methods in this experiment, i.e., a full LOO method including all three steps of the CAD scheme, and three partial LOO methods, each with an additinoal step left out. Figure 3 shows the average specificities estimated by the full LOO and three partial LOO evaluation methods when the sensitivity of the CAD was set to 0.84. As shown in Table 1, the full LOO method was unbiased; therefore, the performance level estimated by use of the full LOO was considered to be a reference standard. It is apparent that the performance levels estimated by the three partial LOO methods were optimistically biased. Figure 3 also shows the amount of bias caused by each of the three steps, i.e., cutoff threshold selection, feature selection, and classifier training. In this experiment, the step of feature selection was the main source of bias. Therefore, it is important to include not only the classifier, but also all other steps in an appropriate evaluation procedure.
Figure 3.

Average specificities estimated by a full (F) and three partial (P) leave-one-out evaluation methods at a fixed sensitivity of 0.84
III-2. Pitfall 2: Adjustment of parameters with “test” dataset
Even if all three steps are included in an appropriate evaluation method, a bias may still occur. For example, if we use a complex classifier such as a Bayesian ANN, we have to determine some important parameters of the ANN, such as the number of units in each hidden layer, the number of epochs for training the ANN, etc. Unfortunately, investigators often select a “good” combination of parameters by looking at the results for the “test” dataset, which leads to a bias because the “test” dataset becomes part of a training dataset. Please note that this pitfall does not happen to “simple” classifiers such as LDA because parameter tuning is not needed in these simple classifiers.
We conducted a Monte Carlo simulation experiment with 50 abnormal and 200 normal synthetic objects to verify this type of bias. Our CAD scheme consisted of feature selection, classifier (Bayesian ANN), and cutoff threshold selection. The number of hidden units for the Bayesian ANN was the only parameter we planned to tune, whereas all other parameters were fixed. We employed a three- and a two-subset CV evaluation method in this experiment [8]. In the two-subset method, we utilized the “test” dataset for selecting an ANN with an “optimal” number of hidden units, whereas in the three-subset CV method, we further partitioned the training dataset equally into a new training subset and a tuning subset, and employed the tuning subset to determine the “optimal” number of hidden units. Figure 4 shows the average specificities estimated by the three- and two-subset CV evaluation methods when the sensitivity of the CAD was set to 0.84. In the three-subset CV evaluation method, because the test dataset was independent of the CAD training process, the estimated performance level was unbiased. The two-subset CV evaluation method thus had a large bias, as shown in Fig. 4. Therefore, whenever possible, it is preferable to estimate the performance level of a CAD scheme based on a complex classifier by use of a three-subset evaluation method instead of a conventional two-subset method. If the three-subset evaluation method is not practical, the investigators should be aware of the bias in the estimated performance level obtained by use of the two-subset method.
Figure 4.
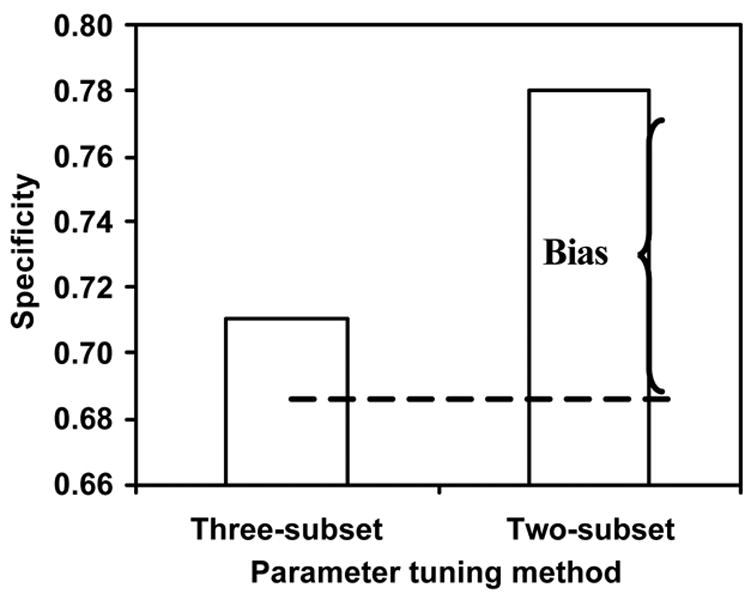
Average specificities estimated by the three- and two-subset evaluation methods at a fixed sensitivity of 0.84
III-3. Pitfall 3: Estimating performance level with only part of available dataset
In addition to the bias, another factor of reliability is the variance of the estimated performance levels. A key point to reduce the variance of the estimated performance of a CAD scheme trained with a given dataset is to ensure that each object in the entire dataset is used at least once as a training object and once as a test object (although not at the same time). For example, CV is an evaluation method that satisfies the above condition, whereas HO evaluation does not because some objects in the HO method are employed only as training objects and the others only as test objects, but not both. In other words, the CV evaluation method has wider coverage of cases and thus a wider spectrum for the training and test datasets than does the HO evaluation method, which makes the CV method more precise.
We conducted a Monte Carlo simulation experiment with 100 abnormal and 400 normal synthetic objects to compare the variance of the performance levels estimated by a CV and an HO evaluation method. Our CAD scheme consisted of feature selection, LDA classifier, and cutoff threshold selection. Figure 5 shows the average specificities (disks) and the standard deviation (bars) estimated by the CV and HO evaluation methods when the sensitivity of the CAD was set to 0.84. It is apparent that the average specificities obtained by the CV and HO methods were almost the same. Under such a circumstance, the one with a smaller variance is considered more reliable. It is apparent that the CV is a more precise method than the HO because the standard deviation of the performance level estimated by the CV was significantly smaller than that estimated by the HO. Therefore, the CV should be employed to replace the HO except in some specific situations such as in an observer performance study as described in Section II-4.
Figure 5.

Average specificities (disks) and standard deviations (bars) estimated by the cross-validation and hold-out evaluation methods at a fixed sensitivity of 0.84
IV. Study 3: Improvement of Generalization Performance
The above studies focus on the analysis and reduction of the bias and the variance in the estimated performance levels. To our knowledge, another important issue, i.e., improvement of the generalization performance, has not been studied yet. Therefore, our goal for this study was to investigate how to improve the generalization performance of a CAD scheme by adding “virtual” cases to the real cases in a given small training dataset.
IV-1. Data
We employed two datasets for improving the generalization performance levels of CAD schemes in this study. We first generated simulated data by conducting 4 Monte Carlo experiments with 4 different training sample size N (N=25, 50, 75, 100). Each Monte Carlo experiment consisted of 100 trials. In each trial, we randomly generated N normal and N abnormal synthetic objects as a training dataset. We also generated a massive sample of 10,000 normal and 10,000 abnormal synthetic objects as a test dataset for determining the generalization performance level.
In addition to the simulation datasets, we employed a real dataset consisting of 117 thoracic CT scans with 153 nodules, which were obtained from the University of Chicago (32 CT scans with 62 lung nodules) and Shinshu University (85 CT scans with 91 nodules), Nagano, Japan [9]. We applied an initial detection technique to the CT scans for identifying initial nodule candidates based on a selective nodule enhancement filter [10]. We thus identified 151 (98.7%) nodules with 6593 false positives. Finally, we determined 18 features for each identified nodule candidate from the original and nodule-enhanced images. These features for all nodules and false positives were employed below for removal of many false positives.
IV-2. Methods
To improve the generalization performance of a CAD scheme, we first generated many “virtual” data by resampling a PDF that was estimated from a given training dataset by use of a kernel estimation method [11,12]. We then combined the resampled virtual data with the original training data to form a new, expanded training dataset. Next, we trained our CAD scheme with the expanded training dataset in order to improve the generalization performance for future cases. Finally, the trained CAD scheme was evaluated with a massive test dataset for determining the generalization performance.
Figure 6 shows in one dimension an example for estimating a kernel PDF from a sample of 25 data points. The sample of 25 data points (X’s on the horizontal axis) was drawn from an underlying PDF (dashed curve), which we wanted to estimate from the sample. To do so, we placed a Gaussian kernel function (thin solid curves) at each data point, and added these to obtain a kernel PDF (thick solid curve) as an estimate of the underlying PDF. From the estimated PDF, we can generate as many “virtual” data as we want to expand the original small database. The combination of the original and the virtual datasets was called an expanded dataset, which was utilized for training of our CAD scheme. The ratio of the size of the expanded dataset to the size of the original dataset was called an expansion factor. For example, when the expansion factor was 1, only original data (with no virtual data) were included in the expanded dataset.
Figure 6.
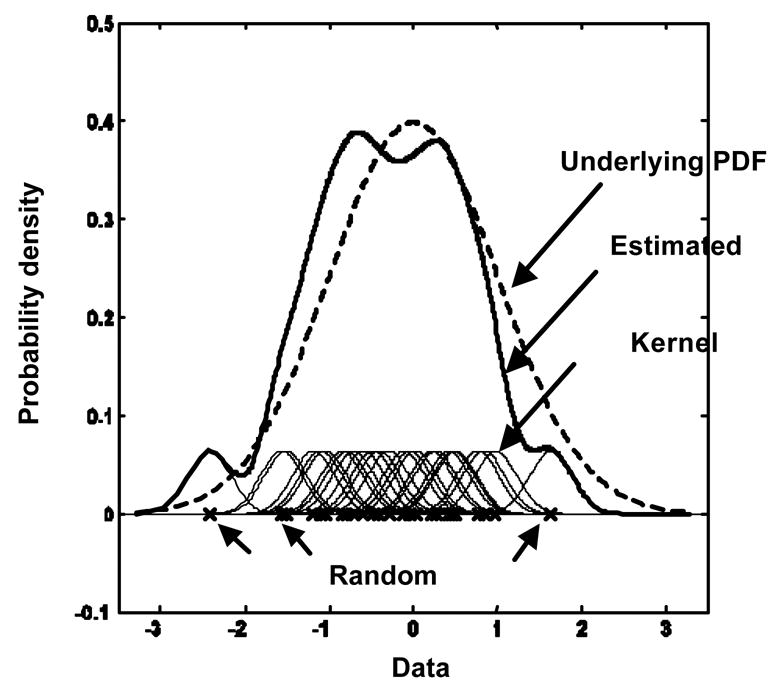
The underlying probability density function, a random sample of 25 data, 25 kernel functions, and the estimated probability density function
Our CAD scheme consisted of feature selection, LDA classifier, and cutoff threshold selection. In this experiment, we always selected the cutoff threshold in such a way that a sensitivity of 80% was achieved. The specificity (for the simulation dataset) or the number of false positives per case (for the real CT dataset) was reported and analyzed for the comparison of the CAD schemes trained without and with the use of virtual data.
IV-3. Results
Figure 7 shows the mean specificities at a fixed sensitivity of 80% for the Monte Carlo simulation experiment at 6 different expansion factors. The first important finding in Fig. 7 was that using the resampled virtual data did improve the mean specificities. For example, when the original training dataset included 25 normal and 25 abnormal objects (N=25), the mean specificity was improved considerably from 67.1% (expansion factor = 1) to 81.4% (expansion factor = 16) by use of the resampled virtual data (P<0.001, two-tailed paired t-test). The second finding was that the standard deviations in the specificities, which are shown as error bars only for N=25 for clarity, decreased considerably from 8.0% (expansion factor = 1) to 3.5% (expansion factor = 16). The third finding was that the extent of improvement in the mean specificities gradually diminished as the size of the original training dataset increased. For example, when N=100, the mean specificity was improved only slightly from 82.6% (expansion factor = 1) to 84.2% (expansion factor = 16) by use of the resampled virtual data (P<0.001). In summary, the use of virtual data improved both the generalization performance level and its variance, in particular, when the original training dataset was small.
Figure 7.
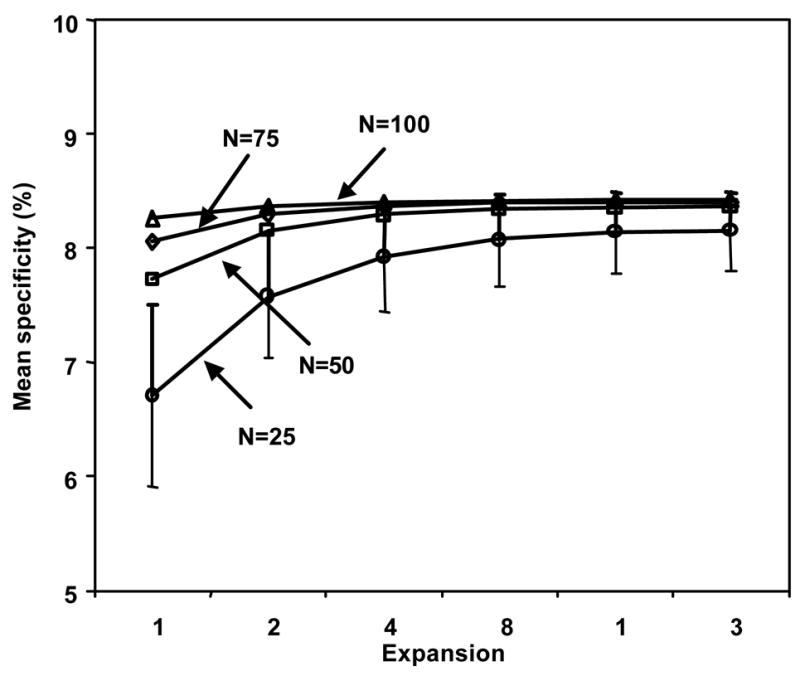
Mean specificities at a fixed sensitivity of 80% for the Monte Carlo simulation experiment
Figure 8 shows the mean number of false positives per case at a fixed sensitivity of 80% for the real CT datasets at 6 different expansion factors. Apparently, all findings indicated in Fig. 7 were correct in Fig. 8. When the original training dataset included 25 cases (including, on average, 32 nodules and 1409 false positives), the mean number of false positives per case (±standard deviation) was reduced considerably from 9.4 (±2.3) to 5.0 (±1.3) (P<0.001) by use of the resampled virtual data (expansion factor = 16).
Figure 8.
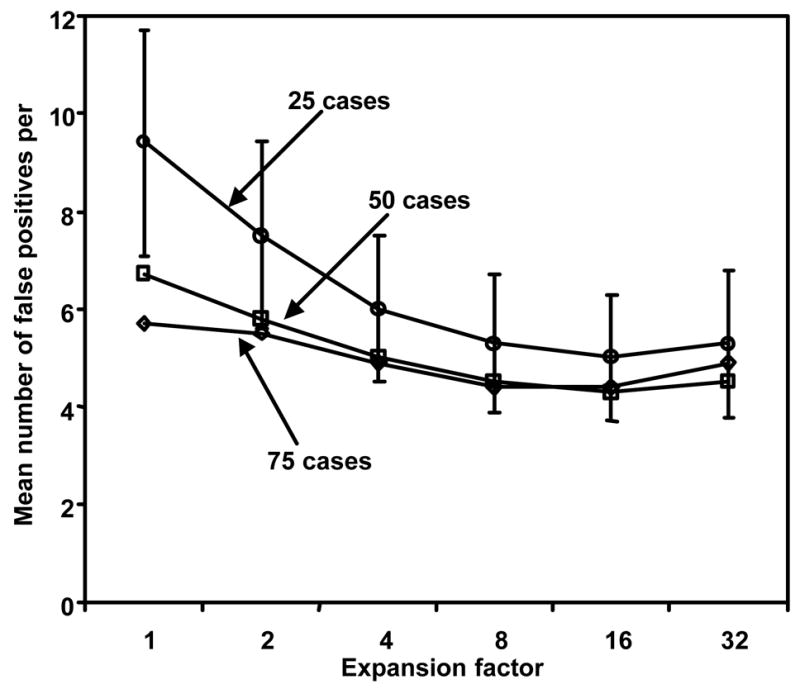
Mean numbers of false positives per case at a fixed sensitivity of 80% for the real CT cases
V. Conclusion
With the definition of a generalization performance and a bias, we compared the characteristics of various evaluation methods, reduced the bias and variance in the estimated performance levels by identifying and solving typical pitfalls in various evaluation methods, and improved the generalization performance levels of CAD schemes by use of expanded training datasets. This article is important for researchers in the field of CAD research who wish to train their CAD schemes with improved generalization performance levels for future cases and to reliably evaluate the performance levels of the CAD schemes trained with finite datasets.
Acknowledgments
This work was supported by USPHS grants CA62625, CA64370, and CA113820. Q. Li is a consultant to the Riverain Medical Group, Miamisburg, OH. CAD technologies developed at the Kurt Rossmann Laboratories for Radiologic Image Research, the University of Chicago, have been licensed to companies including R2 Technologies, Riverain Medical Group, Deus Technologies, Median Technology, Mitsubishi Space Software Co., General Electric Corporation, and Toshiba Corporation. It is the policy of the University of Chicago that investigators disclose publicly actual or potential significant financial interests that may appear to be affected by research activities.
Footnotes
Publisher's Disclaimer: This is a PDF file of an unedited manuscript that has been accepted for publication. As a service to our customers we are providing this early version of the manuscript. The manuscript will undergo copyediting, typesetting, and review of the resulting proof before it is published in its final citable form. Please note that during the production process errors may be discovered which could affect the content, and all legal disclaimers that apply to the journal pertain.
References
- 1.Chan HP, Doi K, Vyborny CJ, Schmidt RA, Metz CE, Lam KL, Ogura T, Wu Y, MacMahon H. Improvement in radiologists’ detection of clustered microcalcifications on mammograms: The potential of computer-aided diagnosis. Invest Radiol. 1990;25:1102–1110. doi: 10.1097/00004424-199010000-00006. [DOI] [PubMed] [Google Scholar]
- 2.Kobayashi T, Xu X, MacMahon H, Metz CE, Doi K. Effect of a computer-aided diagnosis scheme on radiologists’ performance in detection of lung nodules on radiographs. Radiology. 1996;199:843–848. doi: 10.1148/radiology.199.3.8638015. [DOI] [PubMed] [Google Scholar]
- 3.Aoyama M, Li Q, Katsuragawa S, Doi K. Automated computerized scheme for distinction between benign and malignant solitary pulmonary nodules on chest images. Med Phys. 2002;29:701–708. doi: 10.1118/1.1469630. [DOI] [PubMed] [Google Scholar]
- 4.Aoyama M, Li Q, Katsuragawa S, Li F, Sone S, Doi K. Computerized scheme for determination of the likelihood measure of malignancy for pulmonary nodules on low-dose CT images. Med Phys. 2003;30:387–394. doi: 10.1118/1.1543575. [DOI] [PubMed] [Google Scholar]
- 5.D.J.C. MacKay. Bayesian methods for adaptive models. PhD Thesis from California Institute of Technology, 1992. http://wol.ra.phy.cam.ac.uk/mackay/thesis.pdf
- 6.Kupinski MA, Edwards DC, Giger ML, Metz CE. Ideal observer approximation using Bayesian classification neural networks. IEEE Trans Med Imaging. 2001;20:886–899. doi: 10.1109/42.952727. [DOI] [PubMed] [Google Scholar]
- 7.Li Q, Doi K. Analysis and Minimization of Overtraining Effect in Rule-based Classifiers for Computer-Aided Diagnosis. Med Phys. 2006;33:320–328. doi: 10.1118/1.1999126. [DOI] [PubMed] [Google Scholar]
- 8.Li Q, Doi K. The reduction of bias and variance for the evaluation of computer-aided diagnostic scheme. Med Phys. 2006;33:868–875. doi: 10.1118/1.2179750. [DOI] [PubMed] [Google Scholar]
- 9.Sone S, Takashima S, Li F, Yang Z, Honda T, Maruyama Y, Hasegawa M, Yamanda T, Kubo K, Hanamura K, Asakura K. Mass screening for lung cancer with mobile spiral computed tomography scanner. Lancet. 1998;351:242–245. doi: 10.1016/S0140-6736(97)08229-9. [DOI] [PubMed] [Google Scholar]
- 10.Li Q, Sone S, Doi K. Selective enhancement filters for nodules, vessels, and airway walls in two- and three-dimensional CT scans. Med Phys. 2003;30:2040–2051. doi: 10.1118/1.1581411. [DOI] [PubMed] [Google Scholar]
- 11.Parzen E. On estimation of a probability function and its mode. Ann Math Statist. 1962;33:1065–1076. [Google Scholar]
- 12.Efron B, Tibshirani RJ. An introduction to the bootstrap. Chapman & Hall/CRC; 1998. [Google Scholar]