Abstract
Although mitochondrial mutation abundance has been recognized to increase in an age-dependent manner, the impact of mutation has been more difficult to establish. Using quantitative PCR, we measured the intracellular abundance of mutant and wild-type mitochondrial genomes along the length of individual laser-captured micro-dissected muscle fibers from aged rat quadriceps. Aged muscle fibers possessed segmental, clonal intracellular expansions of unique somatically-derived mtDNA deletion mutations. When the mutation abundance surpassed 90% of the total mitochondrial genomes, the fiber lost cytochrome C oxidase activity and exhibited an increase in succinate dehydrogenase activity. In addition to the mitochondrial enzymatic abnormalities, some fibers displayed abnormal morphology such as fiber splitting, atrophy and breakage. Deletion mutation accumulation was linked to these aberrant morphologies with more severe cellular pathologies resulting from higher deletion mutation abundance. In summary, our measurements indicate that age-induced mitochondrial DNA deletion mutations expand within individual muscle fibers, eliciting fiber dysfunction and breakage.
Introduction
Due to a multi-factorial etiology, the specific series of molecular events that contribute to the aging process has not been elucidated. Dissecting and deciphering specific physiological mechanisms responsible for age-associated phenotypes is critical for advancing our understanding of the aging process. In accordance with the mitochondrial theory of aging (1, 2), the accumulation of defective mitochondrial genomes has contributed to the physiological decline associated with aging (3–5). Sarcopenia, the age-associated loss of skeletal muscle mass and function (6), is a prime non-pathological contributor to the frailty associated with aging. Of the proposed mechanisms for sarcopenia; loss of muscle stem cell activity, denervation/renervation, endocrine changes, oxidative stress or mitochondrial genome instability, the cumulative loss of individual muscle fibers represents a primary and permanent deficit.
In humans, 40% of muscle mass is lost between the ages of 20 and 80 (7). This muscle mass loss is due to decreased muscle cross-sectional area, a loss of muscle fibers and fiber atrophy (8, 9). In the rat quadriceps muscles, rectus femoris and vastus lateralis, muscle mass decreased by 33% and 60% and fiber number decreased 30% and 58% between 18 and 36 months of age (10, 11).
Concurrent with the age-dependent loss of muscle fibers, multiple mitochondrial DNA (mtDNA) deletion mutations accumulate over time in many tissues and species (12–16). MtDNA deletion mutations were initially considered to be at low abundance (<0.1%) when calculated against the total mitochondria pool in tissue homogenates (17, 18). When, however, discrete numbers of muscle fibers were analyzed, the abundance of mtDNA deletion mutations was found to be inversely proportional to the number of cells analyzed (19). In situ hybridization studies demonstrated that mtDNA deletion mutations were not distributed homogeneously throughout a tissue, but amplified focally within a subset of individual cells, appearing as a segmental pattern along the length of muscle fibers, and a mosaic distribution between cells (20–26).
Mammalian mitochondria encode 22 tRNAs, 2 rRNAs and 13 polypeptides from a 16.5 kilobase circular genome. Mitochondrial genomes exist as a cellular multiplicity and, as a result, mtDNA molecules complement each other, protecting against deleterious mutations. When mutations do occur, a state of heteroplasmy exists within individual mitochondria and cells. The cellular and systemic impact of mtDNA mutation is illustrated by a group of genetic diseases known as the mitochondrial myopathies and encephalomyopathies (27–29). Mitochondrial diseases are caused by the intracellular accumulation of mutated mtDNA to levels that eventually disrupt the synthesis of mitochondrially-encoded components of the electron transport system (ETS). The abundance at which specific mutations cause ETS dysfunction is termed the phenotypic threshold effect (reviewed by (30, 31)). A characteristic cellular phenotype exhibited by patients with mitochondrial myopathies is the histological absence of cytochrome c oxidase (COX) activity and an upregulation of succinate dehydrogenase (SDH) activity (24). In situ hybridization studies on COX− fibers measured mitochondrial transcript abundance and/or mitochondrial DNA concentrations and found that wild-type and deletion specific transcript levels, were proportional to genotype abundance (20–23). Some studies found that wild-type genomes were reduced, while others suggested that wild-type was maintained in COX− regions (reviewed by Shoubridge(32)).
Whereas the same mtDNA mutation is distributed among multiple tissues in the mitochondrial myopathies and encephalomyopathies, mitochondrial mutations also originate as a result of spontaneous somatic mutation events within individual cells. These age-associated mtDNA deletion mutations also induce COX−/SDH++ fibers, and are distributed mosaically intercellularly and segmentally intracellularly (26). Thus, accurate quantitation of the abundance of these enzymatic abnormalities requires the analysis of numerous sections of tissue along the length of the muscle. Based on histological analysis of aged muscles, the calculated tissue burden of ETS abnormalities was found to be 15% of all remaining muscle fibers in 36-month old rat rectus femoris (10), and 60% in 34-year old rhesus monkey vastus lateralis (26). Additionally, muscles that display a large age-dependent loss of skeletal muscle fibers contain high levels of ETS abnormalities (33). Concomitant with observed ETS enzymatic abnormalities are often morphological changes in muscle fiber structure including fiber splitting, atrophy and breakage.
The association of ETS abnormalities, mtDNA deletion mutations, fiber loss and muscle mass loss suggest that these age-dependant events might share a common etiology. In this study, we tested the hypothesis that mtDNA mutation accumulation underlies the fiber splitting, atrophy and breakage associated with ETS abnormalities. By taking a longitudinal single fiber approach to understanding the relationship between mitochondrial genotype and cellular phenotype, we link mtDNA deletion mutation accumulation with these dysfunctional cellular phenotypes and, ultimately, with muscle fiber loss.
Methods
Animals and Tissue Preparation
The rectus femoris and the vastus lateralis muscles were dissected from 36-month old male Fischer 344 × Brown Norway F1 hybrid rats purchased from the National Institute on Aging colony maintained by Harlan Sprague Dawley (Indianapolis, IN). Rats were housed and euthanized in accordance with the guide for the care and use of laboratory animals. The muscles were bisected at the mid-belly, embedded in optimal cutting media (Miles Inc., Elkhart, IN) and flash frozen in liquid nitrogen. Samples were stored at − 80°C until analyzed. Using a cryostat, one or two hundred 10-micron-thick serial transverse cryosections were cut and placed on Probe-on Plus slides. At 60-micron intervals, cross-sections were stained for cytochrome c oxidase (COX) and succinate dehydrogenase (SDH) as previously described (10) and ETS abnormal fibers identified. Fibers were also stained for cell morphology and nuclei with hematoxylin and eosin.
Laser Capture Micro-dissection
Histological sections were dehydrated through a series of graded ethanol and xylene (10). ETS abnormal fibers were subsequently micro-dissected using a PixCell II laser capture microscope (Arcturus). Finally, captured fibers were further dissected from the capture film to eliminate all potential contamination.
DNA Isolation, Breakpoint Analysis and Quantitative real-time PCR
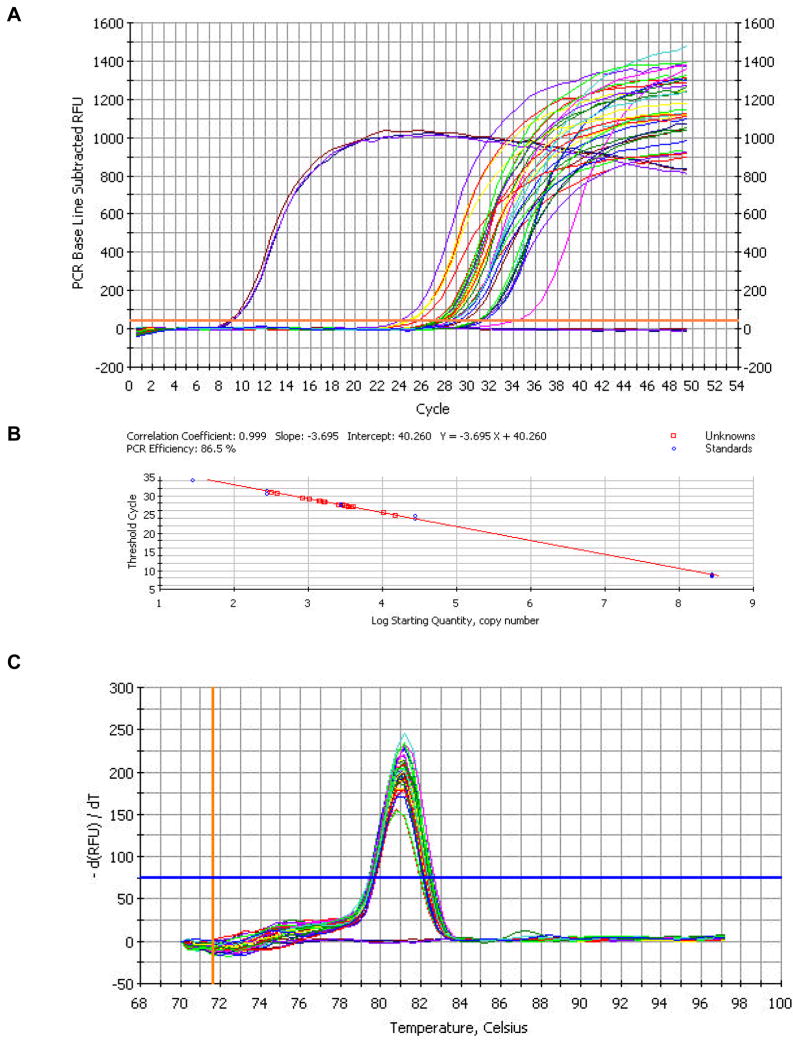
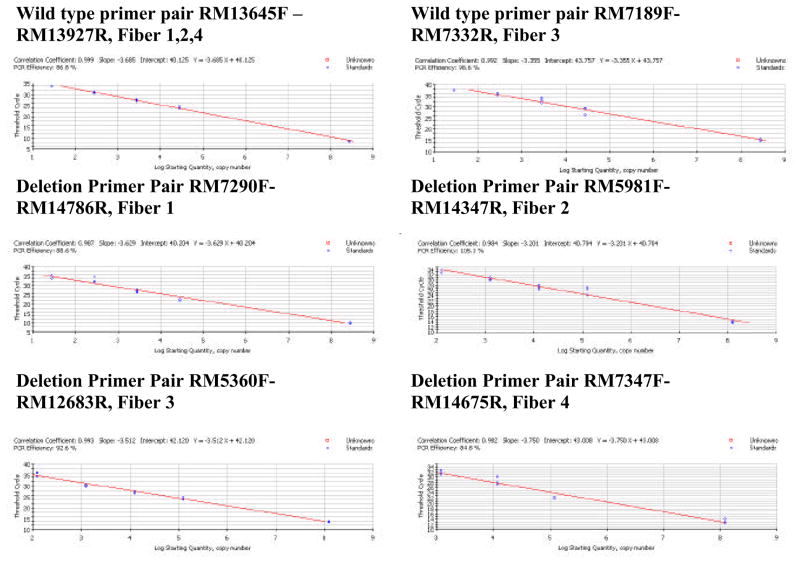
DNA isolation and mtDNA breakpoint analysis were performed as previously described (34). Oligonucleotide primers (Table 1) specific for either full-length or deleted genomes were designed for use in quantitative PCR assays based upon the unique sequence of each mtDNA deletion obtained from the breakpoint analysis. The full-length primer set is designed to amplify a region of the genome within the confines of the deleted mtDNA. This ensures that the primers specifically amplify full-length wild-type genomes. Deletion primer sets flank the breakpoint such that amplification of the deleted genomes yields an amplicon of ~200 base pairs. The deletion primer sets cannot amplify full-length mtDNA due to the short extension time in the elongation phase of the PCR. Total DNA concentration is determined every cycle by the fluorescence emission generated by the binding of SYBR Green to the minor groove of DNA. Micro-dissected samples are amplified in parallel with known standards generated by cloning the deletion-specific as well as full-length sequences into the pGEM T-easy vector (Promega Inc., Madison, WI.). Standards were quantified by spectrophotometry at A260 and dilutions prepared using NIST calibrated volumetric pipets. Linearity of dilutions was confirmed by quantitative PCR and regression analysis. Samples and standards for both wild-type and deletion specific primer sets were amplified in triplicate using iQ SYBR Green supermix (BIO-RAD Laboratories, Hercules, CA). Standard curves were generated for the primer sets (Figures 1b, 2), and the starting quantities of wild-type and deleted mitochondrial genomes were calculated. Specificity of amplification reactions was confirmed by melting point analysis (Figure 1c, d) and gel electrophoresis.
Table 1.
Primers for quantitative PCR
| Fiber | Primer Pair | Wt/del | Sequence 5′-3′ |
|---|---|---|---|
| 1,2,4 | RM13645F RM13927R |
Wt | CAACATAACCCCAACATCATCAATCTCATACA AATAGTTTTAGGGTTTGGGGGTTCGTTTTT |
| 1 | RM7290F RM14786R |
del | AGGACACCAATGATACTGAAGCTATGAATATACTGACTA ATGGAATGGGATTTTGTCTGCGTCG |
| 2 | RM5981F RM14347R |
del | CTTCGACCCCGCTGGAGGTGGAGAC GATGAGAATGCTGTTATGGTATCAGACGTGTAGTG |
| 3 | RM7189F RM7332R |
Wt | ATTCTCCCAGCTGTCATTCTTATTCTAATTGCCCTTCC TTCATAGTCAGTATATTCATATTCATAGCTTCAGTATCATT GGTGTCCT |
| 3 | RM5360F RM12683R |
del | CCTCTATAGGCTCATTCATCTCACTTACGCC GCAAATGTGGAGGAAAGCAAGGTAGGGT |
| 4 | RM7347F RM14675R |
del | CTCCTACATAATCCCAACCAATGACCTAAAACC GATGAAGTGGAATGCGAAGAAGCGTGT |
Figure 1.
Typical quantitative PCR data from wild-type primer pair RM13645F- RM13927R. (A) Amplification curves for standards and mtDNA from laser-captured muscle fibers. The baseline curves are no-template control reactions. RFU is Relative Fluorescence Units. (B) Standard Curve generated by amplifying cloned wild-type standards. Log starting quantity of the mtDNA from the laser captured sample is interpolated from the equation of the best-fit line. (C) Melt-curve analysis of real-time amplification products illustrating the specificity of melting temperature and confirming product identity. Plot of the first derivative of fluorescence with regard to temperature.
Figure 2.
Standard curves generated by amplifying serial dilutions of wild-type or deletion-specific plasmids.
Results
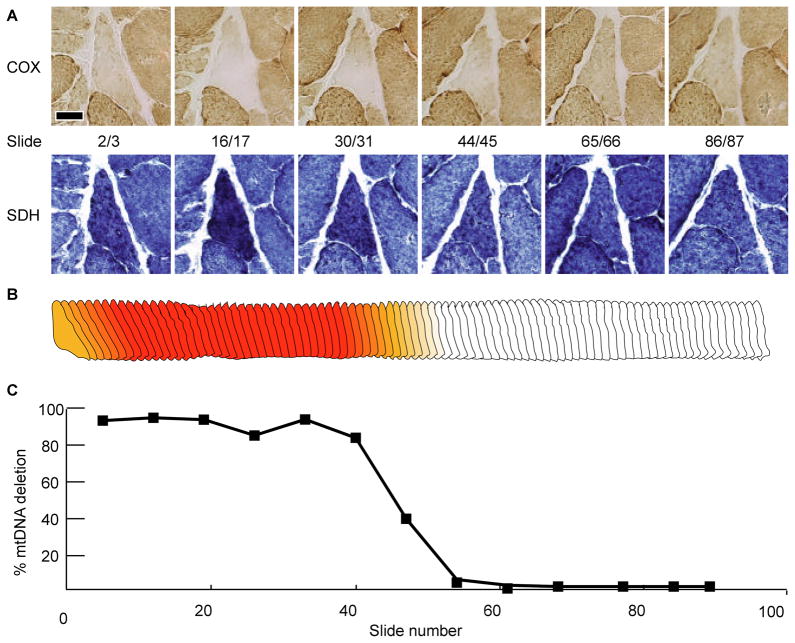
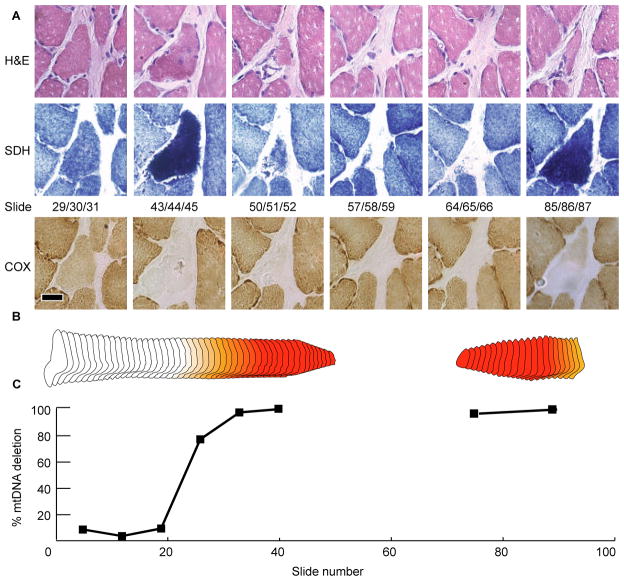
Serial longitudinal cross-sections of aged muscle tissue were stained histochemically at 60μm intervals to identify muscle fibers containing ETS abnormal regions (Figures 3–6a). Four fibers containing COX−/SDH++ regions were selected based upon their morphology and the contiguity of the ETS abnormal region within the series of sections. Fibers one and two contain a 440μm and 460μm non-atrophic ETS abnormal phenotype (Figures 3,4). Fiber three contains an ETS abnormal region that co-localizes with a region undergoing fiber splitting. The fiber splits along its length first into two and, subsequently, three fibers before returning to a single unified fiber (Figure 5). Fiber four atrophies, eventually becoming undetectable for 250 microns, and then reappears as an ETS abnormal fiber (Figure 6).
Figure 3. Fiber One.
(A) Serial micrographs showing enzymatic staining for COX and SDH. The scale bar represents 25μm. (B) Morphometric digital reconstruction of fiber one. The color denotes the ETS abnormal phenotype, red is COX−/SDH++ and orange is COX−/SDHnormal. (C) Percentage of mtDNA genomes that are mutant along the length of the abnormal fiber.
Figure 6. Fiber Four.
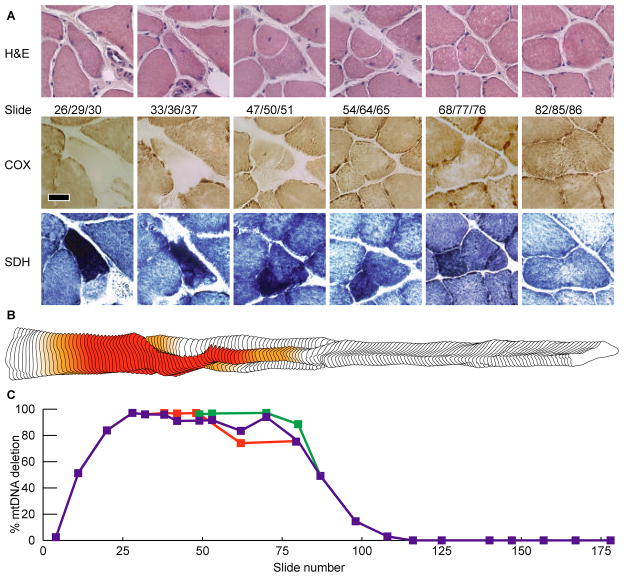
(A) Serial micrographs staining for morphology with H & E and enzymatic activities for COX and SDH. The ETS abnormal region extends for over 700μm and includes a 250μm region where the fiber has ruptured and cannot be detected. The scale bar is 25μm. (B) Morphometric digital reconstruction of fiber four. The color denotes the ETS abnormal phenotype, red is COX−/SDH++ and orange is COX−/SDHnormal. (C) Percentage of mtDNA genomes that are mutant along the length of the abnormal fiber. The same mtDNA deletion mutation is detected across the broken fiber region and the highest levels (>99%) of mutation are found immediately flanking the fiber break.
Figure 5. Fiber Three.
(A) Serial micrographs staining for morphology with H & E and enzymatic activities for COX and SDH. The muscle fiber splits into three distinct sub-fibers before fusing back together. The deletion mutation was detected throughout 1080μm. The scale bar is 25μm. (B) Morphometric digital reconstruction of fiber three. The color denotes the ETS abnormal phenotype, red is COX−/SDH++ and orange is COX−/SDHnormal. (C) Percentage of mtDNA genomes that are mutant along the length of the abnormal fiber. The unique mtDNA deletion mutation was found at high levels within different “branches” of the same fiber.
Multiple sections of each of these fibers were individually micro-dissected, DNA isolated and, through the use of mtDNA specific primers, amplified and, subsequently, sequenced. A single smaller than wild-type genome (a mitochondrial DNA deletion mutation) was identified in each fiber’s ETS abnormal region. The size of these deletion-containing genomes varied between fibers and ranged from 8,148 to 11,268 base pairs. All deletion mutations removed portions of the wild-type mitochondrial genome along the major arc and disrupted or abrogated genes coding for; cytochrome c oxidase, ATP synthase, NADH dehydrogenase as well as the interspersed mitochondrial tRNAs. The specific deletion mutation in fiber one removed nucleotides 6,013–14,165, fiber two nucleotides 7,455–14,731, fiber three nucleotides 6,710–12,542 and fiber four nucleotides 7,389–14,485.
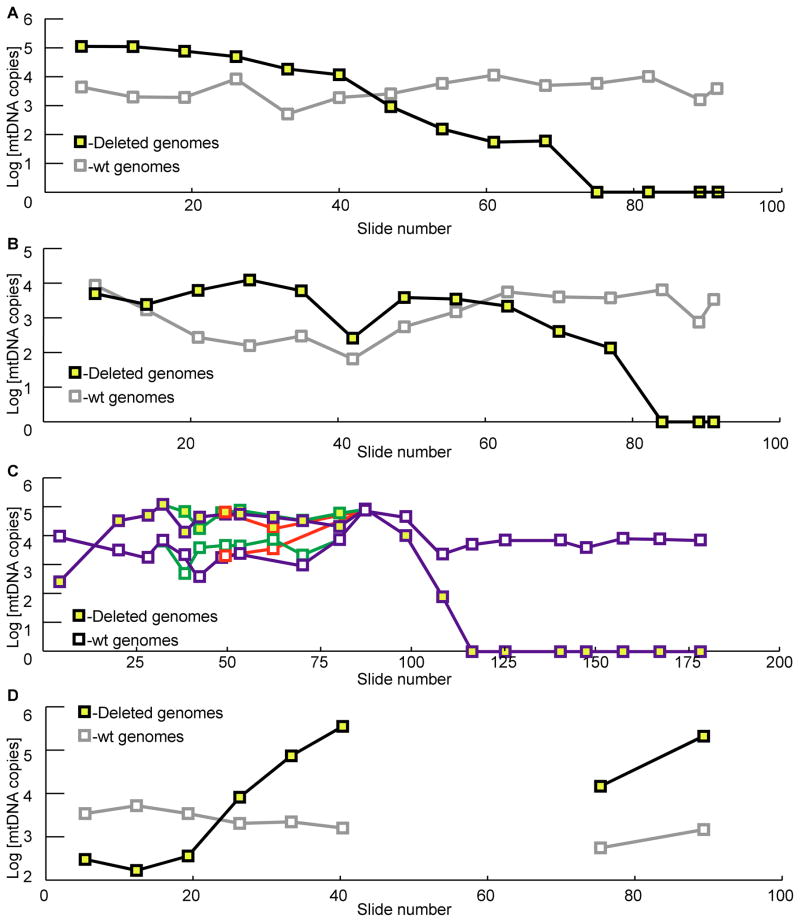
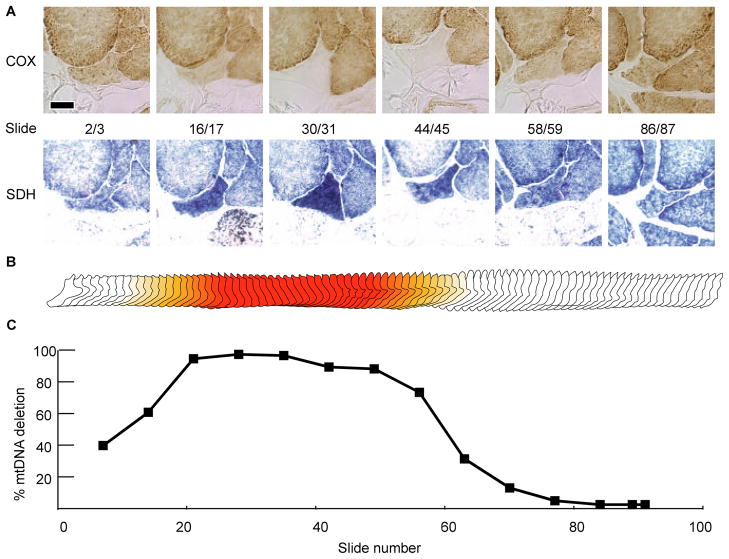
The absolute quantity of deleted and wild-type mitochondrial genomes was determined by breakpoint-specific quantitative PCR assays on laser-captured cell sections collected along the length of individual muscle fibers. The intracellular abundance of mtDNA deletion mutations within each fiber’s ETS abnormal region was greater than 90%. In every fiber, the COX−/SDH++ phenotype was flanked by adjacent ETS normal regions that contained detectable levels of deletion mutations albeit, at lower levels (Figures 3–6). Fiber one, for example, contained a 440μm ETS abnormal region within a 770μm region that contained an accumulation of mtDNA deletion mutations. As the abundance of mtDNA mutation decreased, there was an intermediate ETS abnormal transitional phenotype characterized by slightly reduced COX activity, and slightly increased SDH activity (Figure 3a, slides 44/45, 4a, slides 16/17). In fiber regions distant from the ETS abnormality, only wild-type genomes were detected and mtDNA deletion mutations were undetectable. The COX negative, SDH hyper phenotype occurred in regions that contained greater than 90% mutant mtDNA (Figures 3–6). Wild-type genomes were consistently detected in both ETS normal and abnormal regions (Figure 7).
Figure 7.
Absolute quantification of mtDNA genomes. (A) Fiber one. (B) Fiber two. (C) Fiber three. Each branch of the split fiber is represented by a different color line. (D) Fiber four.
Discussion
Age-associated mtDNA deletion mutations form as the result of somatic mutation of wild-type genomes. The cellular impact, however, is the result of the clonal accumulation of mutant genomes to sufficiently high levels to affect mitochondrial and cellular function. The presence of mutant mtDNA genomes outside the ETS abnormal phentoype (Figures 3–6) indicates that the ETS abnormal phenotype results from the intracellular accumulation of mtDNA deletion mutations, not vice versa. The maintenance of wild-type genomes throughout the abnormal region (Figure 7) at levels that are similar to ETS normal regions and the coordinated decrease in mutation abundance in the ETS normal region indicates that the accumulation of deleted genomes, and not the selective depletion of wild-type, is responsible for phenotypic threshold effect. The loss of COX activity in the presence of wild-type genomes suggests incompetent genomes and their derived transcripts may compete with wild-type genomes for binding of transcriptional and translational machinery leading to a breakdown in the amount of functional polypeptides and loss of enzymatic activity.
We measured the absolute quantity of mitochondrial genomes, full-length and deletion-containing, to determine the threshold for the loss of COX activity. A 90% threshold for age-induced mtDNA mutations is consistent with previous measurements that determined the threshold for loss of COX activity to be between 60(35) and 90(20, 21, 36) percent depending upon tissue type; HeLa cells or multi-nucleated muscle fibers from patients with mitochondrial myopathies respectively. The maintenance of full-length wild-type genomes in ETS abnormal segments is consistent with in situ hybridization studies from patients with mitochondrial myopathies (20, 21) as well as aged muscle fibers (25, 26).
Muscle fiber splitting is a characteristic phenotype of many primary muscle diseases including dystrophies. In the split muscle fiber (Figure 5), the same molecular mutation was detected in each of the daughter fibers. This indicates that the mutation was present before the split occurred and, consequently, that the fiber is undergoing splitting and not fusion. Muscle fiber splitting has been observed to be associated with 35% of ETS abnormal muscle fibers, however, the split region rarely co-localized with the abnormal enzymatic phenotype (10). Our data suggests that, while there is no overlap between the ETS abnormal region and the split fiber regions, there is a co-localization of fiber splitting and the accumulation of mtDNA deletion mutations (Figure 5c), albeit at levels below the threshold for the expression of the ETS abnormal phenotype. Splitting may represent a precursor phenotype to fiber atrophy via the independent breakage of daughter fibers or a protective mechanism that allows segregation of mutant and wild-type genomes altering the level of heteroplasmy in each branch.
We have previously reported, in aged rat quadriceps muscle, that 25% of ETS abnormal fibers are associated with fiber atrophy and 7% with fiber breakage (10). Similar observations have been made in rhesus macaques (25, 26). The proliferation of a mtDNA deletion mutation across a broken fiber segment (Figure 6) and the subsequent ETS abnormality directly supports the hypothesis that accumulation of mtDNA deletions can result in fiber breakage. The broken ends of the fiber (Figure 6c) contain exceedingly high levels of the same unique mtDNA deletion mutation suggesting that the fiber was once continuous, subsequently atrophied and ruptured. The broken ends of the fiber contain the highest level of mtDNA mutations measured, 3×10⁵ mutant genomes, demonstrating a profound ETS abnormal phenotype.
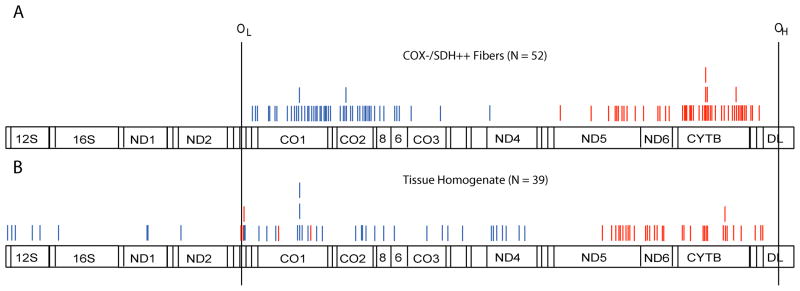
The mechanism driving mtDNA deletion mutation proliferation is not known. MtDNA deletion mutations could accumulate because they possess a replication advantage, because of stochastic events, or because their destruction is disadvantaged. These possibilities have been put forth as biological hypotheses: replicative advantage(21), random drift(37), and survival of the slowest (38), respectively. These mechanisms are not mutually exclusive, however, and the mechanism of mtDNA accumulation may be more complex, especially in multi-nucleated tissue such as muscle fibers. The strikingly high copy number of deletion-containing genomes (~100,000 copies) measured within an ETS abnormal section, combined with the relatively stable numbers of wild-type genomes (~1,000 copies), implies that muscle fibers do not maintain a steady state of mtDNA molecules in response to dysfunctional oxidative phosphorylation. That is, mitochondrial deletion mutation replication does not occur at the expense of wild-type replication. Moreover, these measurements suggest that deleted mtDNA molecules are advantaged, replicating to high abundance. One prediction of the advantaged model is the presence of neutral mtDNA deletion mutations that do not accumulate to high levels due to genome size or specific breakpoint location. We compared the specific deletion mutation breakpoints that accumulate in individual ETS abnormal fibers with the breakpoint sequences observed in muscle tissue homogenates (Figure 8). The deletion breakpoints in tissue homogenates were distributed throughout the mitochondrial genome, whereas deletion breakpoints from abnormal fibers were confined to the major arc of the mtDNA indicating specificity for mutations that could accumulate to cause ETS abnormal fibers. The localization of mtDNA deletion mutation breakpoints from ETS abnormal fibers to the major-arc was previously attributed to the existence of a “hotspot” for mutation formation (34, 39). The difference in deletion mutation patterns between tissue homogenates and single cells, however, suggests an alternative explanation; that the generation of mtDNA deletion mutants is random but that certain mutations, those producing small genomes (large deletions) while retaining both origins of replication, are more prone/likely to accumulate to high intracellular abundance.
Figure 8.
Distribution of the mtDNA deletion breakpoints. Red lines represent the 5′ breakpoint. The blue lines represent the 3′ breakpoint. OL, OH, light and heavy strand origins of replication respectively. (A) Deletion mutations from individual ETS abnormal fibers. Breakpoints occur within the major arc of the mitochondrial genome adjacent to the light and heavy strand origins of replication. (B) Deletion mutations from tissue homogenates. Breakpoints are scattered throughout the mitochondrial genome, occasionally removing the light strand origin, but never removing the heavy strand origin.
Many mechanisms have been proposed to explain the age-associated loss of muscle mass. Our molecular observations of the role of mtDNA deletion mutations in sarcopenia are consistent with the hypothesis that the intracellular accumulation of mitochondrial DNA deletion mutations causes mitochondrial dysfunction. The abrogation of mitochondrial and cellular processes induces morphological changes in the fiber such as splitting. The fiber atrophies and eventually ruptures. The somatic generation and subsequent intracellular accumulation of mtDNA deletion mutations contributes to the age-dependent loss of muscle fibers and sarcopenia.
Supplementary Material
Figure 4. Fiber Two.
(A) Serial micrographs showing enzymatic staining for COX and SDH. The scale bar is 25μm. (B) Morphometric digital reconstruction of fiber two. The color denotes the ETS abnormal phenotype, red is COX−/SDH++ and orange is COX−/SDHnormal. (C) Percentage of mtDNA genomes that are mutant along the length of the abnormal fiber.
Acknowledgments
We thank the NIEHS Center for Molecular and Developmental Toxicology (ES 09090) for access to laser capture micro-dissection. This work is supported by The National Institute on Aging award #R01 AG011604.
References
- 1.Harman D. The biologic clock: the mitochondria? Journal of the American Geriatrics Society. 1972;20(4):145–7. doi: 10.1111/j.1532-5415.1972.tb00787.x. [DOI] [PubMed] [Google Scholar]
- 2.Miquel J, et al. Mitochondrial role in cell aging. Exp Geront. 1980;15:575–591. doi: 10.1016/0531-5565(80)90010-8. [DOI] [PubMed] [Google Scholar]
- 3.Wallace DC. Mitochondrial Diseases in Man and Mouse. Science. 1999;283(5407):1482–1488. doi: 10.1126/science.283.5407.1482. [DOI] [PubMed] [Google Scholar]
- 4.Trifunovic A, et al. Premature ageing in mice expressing defective mitochondrial DNA polymerase. Nature. 2004;429(6990):417–23. doi: 10.1038/nature02517. [DOI] [PubMed] [Google Scholar]
- 5.Kujoth GC, et al. Mitochondrial DNA mutations, oxidative stress, and apoptosis in mammalian aging. Science. 2005;309(5733):481–4. doi: 10.1126/science.1112125. [DOI] [PubMed] [Google Scholar]
- 6.Rosenberg IH. Sarcopenia: origins and clinical relevance. J Nutr. 1997;127:990S–991S. doi: 10.1093/jn/127.5.990S. [DOI] [PubMed] [Google Scholar]
- 7.Evans W. Functional and metabolic consequences of sarcopenia. Journal of Nutrition. 1997;127(5 Suppl):998S–1003S. doi: 10.1093/jn/127.5.998S. [DOI] [PubMed] [Google Scholar]
- 8.Lexell J, Taylor CC, Sjostrom M. What is the cause of the ageing atrophy? Total number, size and proportion of different fiber types studied in whole vastus lateralis muscle from 15- to 83-year old men. J Neurol Sci. 1988;84:275–294. doi: 10.1016/0022-510x(88)90132-3. [DOI] [PubMed] [Google Scholar]
- 9.Sato T, et al. Age changes in size and number of muscle fibers in human minor pectoral muscle. Mechanisms of Ageing & Development. 1984;28(1):99–109. doi: 10.1016/0047-6374(84)90156-8. [DOI] [PubMed] [Google Scholar]
- 10.Wanagat J, et al. Mitochondrial DNA deletion mutations colocalize with segmental electron transport system abnormalities, muscle fiber atrophy, fiber splitting, and oxidative damage in sarcopenia. FASEB Journal. 2001;15(2):322–32. doi: 10.1096/fj.00-0320com. [DOI] [PubMed] [Google Scholar]
- 11.McKiernan SH, et al. Early-onset calorie restriction conserves fiber number in aging rat skeletal muscle. FASEB Journal. 2004;18(3):580–1. doi: 10.1096/fj.03-0667fje. [DOI] [PubMed] [Google Scholar]
- 12.Cortopassi GA, Arnheim N. Detection of a specific mitochondrial DNA deletion in tissues of older humans. Nucleic Acids Res. 1990;18(23):6927–6933. doi: 10.1093/nar/18.23.6927. [DOI] [PMC free article] [PubMed] [Google Scholar]
- 13.Linnane AW, et al. Mitochondrial gene mutation: the ageing process and degenerative diseases. Biochem Int. 1990;22(6):1067–1076. [PubMed] [Google Scholar]
- 14.Lee CM, et al. Multiple mitochondrial DNA deletions associated with age in skeletal muscle of rhesus monkeys. J Gerontol Biol Sci. 1993;48(6):B201–B205. doi: 10.1093/geronj/48.6.b201. [DOI] [PubMed] [Google Scholar]
- 15.Melov S, et al. Detection of deletions in the mitochondrial genome of Caenorhabditis elegans. Nucleic Acids Research. 1994;22(6):1075–8. doi: 10.1093/nar/22.6.1075. [DOI] [PMC free article] [PubMed] [Google Scholar]
- 16.Chung SS, et al. Multiple age-associated mitochondrial DNA deletions in skeletal muscle of mice. Aging (Milano) 1994;6(3):193–200. doi: 10.1007/BF03324239. [DOI] [PubMed] [Google Scholar]
- 17.Simonetti S, et al. Accumulation of deletions in human mitochondrial DNA during normal aging: analysis by quantitative PCR. Biochim Biophys Acta. 1992;1180:113–122. doi: 10.1016/0925-4439(92)90059-v. [DOI] [PubMed] [Google Scholar]
- 18.Edris W, et al. Detection and quantitation by competitive PCR of an age-associated increase in a 4.8 kb deletion in rat mitochondrial DNA. Mutat Res. 1994;316:69–78. doi: 10.1016/0921-8734(94)90009-4. [DOI] [PubMed] [Google Scholar]
- 19.Schwarze SR, et al. High levels of mitochondrial DNA deletions in skeletal muscle of old rhesus monkeys. Mech Ageing Dev. 1995;83:91–101. doi: 10.1016/0047-6374(95)01611-3. [DOI] [PubMed] [Google Scholar]
- 20.Mita S, et al. Detection of "deleted" mitochondrial genomes in cytochromec oxidase-deficient muscle fibers of a patient with Kearns-Sayre syndrome. Proc Natl Acad Sci USA. 1989;86:9509–9513. doi: 10.1073/pnas.86.23.9509. [DOI] [PMC free article] [PubMed] [Google Scholar]
- 21.Shoubridge EA, Karpati G, Hastings KEM. Deletion mutants are functionally dominant over wild-type mitochondrial genomes in skeletal muscle fiber segments in mitochondrial disease. Cell. 1990;62:43–49. doi: 10.1016/0092-8674(90)90238-a. [DOI] [PubMed] [Google Scholar]
- 22.Oldfors A, et al. Mitochondrial DNA deletions and cytochrome c oxidase deficiency in muscle fibres. J Neurol Sci. 1992;110:169–177. doi: 10.1016/0022-510x(92)90025-g. [DOI] [PubMed] [Google Scholar]
- 23.Moraes CT, et al. Molecular analysis of the muscle pathology associated with mitochondrial DNA deletions. Nature Genetics. 1992;1:359–367. doi: 10.1038/ng0892-359. [DOI] [PubMed] [Google Scholar]
- 24.Müller-Höcker J, et al. Different in situ hybridization patterns of mitochondrial DNA in cytochrome c oxidase-deficient extraocular muscle fibres in the elderly. Virchows Archiv A, Pathological Anatomy & Histopathology. 1993;422(1):7–15. doi: 10.1007/BF01605127. [DOI] [PubMed] [Google Scholar]
- 25.Lee CM, et al. Association of age-related mitochondrial abnormalities with skeletal muscle fiber atrophy. Free Rad Biol Med. 1998;25(8):964–972. doi: 10.1016/s0891-5849(98)00185-3. [DOI] [PubMed] [Google Scholar]
- 26.Lopez ME, et al. Cellular phenotypes of age-associated skeletal muscle mitochondrial abnormalities in rhesus monkeys. Mutation Research. 2000;452(1):123–38. doi: 10.1016/s0027-5107(00)00059-2. [DOI] [PubMed] [Google Scholar]
- 27.Holt IJ, Harding AE, Morgan-Hughes JA. Deletions of muscle mitochondrial DNA in patients with mitochondrial myopathies. Nature. 1988;331:717–719. doi: 10.1038/331717a0. [DOI] [PubMed] [Google Scholar]
- 28.Wallace DC. Diseases of the mitochondrial DNA. Annu Rev Biochem. 1992;61:1175–1212. doi: 10.1146/annurev.bi.61.070192.005523. [DOI] [PubMed] [Google Scholar]
- 29.DiMauro S. Mitochondrial diseases: clinical considerations. Biofactors. 1998;7(3):277–285. doi: 10.1002/biof.5520070327. [DOI] [PubMed] [Google Scholar]
- 30.Smeitink J, van den Heuvel L, DiMauro S. The genetics and pathology of oxidative phosphorylation. Nature Reviews Genetics. 2001;2(5):342–52. doi: 10.1038/35072063. [DOI] [PubMed] [Google Scholar]
- 31.Rossignol R, et al. Mitochondrial threshold effects. Biochemical Journal. 2003;370(Pt 3):751–62. doi: 10.1042/BJ20021594. [DOI] [PMC free article] [PubMed] [Google Scholar]
- 32.Shoubridge EA. Mitochondrial DNA diseases: histological and cellular studies. J Bioenerg Biomembr. 1994;26(3):301–310. doi: 10.1007/BF00763101. [DOI] [PubMed] [Google Scholar]
- 33.Bua EA, et al. Mitochondrial abnormalities are more frequent in muscles undergoing sarcopenia. Journal of Applied Physiology. 2002;92(6):2617–24. doi: 10.1152/japplphysiol.01102.2001. [DOI] [PubMed] [Google Scholar]
- 34.Cao Z, et al. Mitochondrial DNA deletion mutations are concomitant with ragged red regions of individual, aged muscle fibers: analysis by laser-capture microdissection. Nucleic Acids Research. 2001;29(21):4502–8. doi: 10.1093/nar/29.21.4502. [DOI] [PMC free article] [PubMed] [Google Scholar]
- 35.Hayashi J, et al. Introduction of disease-related mitochondrial DNA deletions into HeLa cells lacking mitochondrial DNA results in mitochondrial dysfunction. Proc Natl Acad Sci U S A. 1991;88(23):10614–8. doi: 10.1073/pnas.88.23.10614. [DOI] [PMC free article] [PubMed] [Google Scholar]
- 36.He L, et al. Detection and quantification of mitochondrial DNA deletions in individual cells by real-time PCR. Nucleic Acids Research. 2002;30(14):e68. doi: 10.1093/nar/gnf067. [DOI] [PMC free article] [PubMed] [Google Scholar]
- 37.Elson JL, et al. Random intracellular drift explains the clonal expansion of mitochondrial DNA mutations with age. American Journal of Human Genetics. 2001;68(3):802–6. doi: 10.1086/318801. [DOI] [PMC free article] [PubMed] [Google Scholar]
- 38.de Grey ADNJ. A proposed refinement of the mitochondrial free radical theory of aging. Bioessays. 1997;19(2):161–167. doi: 10.1002/bies.950190211. [DOI] [PubMed] [Google Scholar]
- 39.Gokey NG, et al. Molecular analyses of mtDNA deletion mutations in microdissected skeletal muscle fibers from aged rhesus monkeys. Aging Cell. 2004;3(5):319–26. doi: 10.1111/j.1474-9728.2004.00122.x. [DOI] [PubMed] [Google Scholar]
Associated Data
This section collects any data citations, data availability statements, or supplementary materials included in this article.


