Abstract
Null mutations in the IL1-receptor accessory protein-like 1 gene (IL1RAPL1) are responsible for an inherited X-linked form of cognitive impairment. IL1RAPL1 protein physically interacts with neuronal calcium sensor-1 (NCS-1), but the functional impact of the IL1RAPL1/NCS-1 interaction remains unknown. Here, we demonstrate that stable expression of IL1RAPL1 in PC12 cells induces a specific silencing of N-type voltage-gated calcium channels (N-VGCC) activity that explains a secretion deficit observed in these IL1RAPL1 cells. Importantly, this modulation of VGCC activity is mediated by NCS-1. Indeed, a specific loss-of-function of N-VGCC was observed in PC12 cells overexpressing NCS-1, and a total recovery of N-VGCC activity was obtained by a down-regulation of NCS-1 in IL1RAPL1 cells. The functional relevance of the interaction between IL1RAPL1 and NCS-1 was also suggested by the reduction of neurite elongation observed in nerve growth factor (NGF)-treated IL1RAPL1 cells, a phenotype rescued by NCS-1 inactivation. Because both proteins are highly expressed in neurons, these results suggest that IL1RAPL1-related mental retardation could result from a disruption of N-VGCC and/or NCS-1-dependent synaptic and neuronal activities.
Keywords: PC12 cells, neuronal calcium sensor-1, X-linked mental retardation, exocytosis
Cognitive impairment or mental retardation (MR) affects ≈2% of the population, leading to moderate (IQ <70) up to severe (IQ <50) handicap. The underlying causes are extremely heterogeneous, including genetic causes, many of which are X-linked (XLMR) (1, 2). Null mutations in the IL1-receptor accessory protein-like 1 gene (IL1RAPL1) [National Center for Biotechnology Information (NCBI) accession no. NM_014271.2] have been involved in a nonsyndromic form of XLMR (3). IL1RAPL1 and the closely related protein IL1RAPL2 (NCBI accession no. NM_017416) belong to a previously unrecognized class of the interleukin-1/toll receptor family characterized by the presence of a 150-aa C terminus domain with unknown function (3, 4). IL1RAPL1 and IL1RAPL2 have specific, but not redundant, temporal and spatial expression pattern in the brain, Il1rapl1, the mouse homologue of IL1RAPL1, being specifically expressed in adult brain structures that are known to be involved in the hippocampal memory system (3).
Most of physiological and biological properties of IL1RAPL proteins remain largely unknown. Recent studies have demonstrated that expression of IL1RAPL1 in PC12 cells leads to a profound inhibition of ATP-induced growth hormone (GH) release (4). The underlying cellular pathways remain to be elucidated; however, IL1RAPL1 has been shown to interact by way of its 150-aa C-terminal domain with the neuronal calcium sensor-1 protein (NCS-1), a protein widely expressed in neurons (5) and the related chromaffin and PC12 cells (6).
NCS-1 belongs to a large Ca2+-binding protein family (7) implicated in the regulation of Ca2+-dependent exocytosis (6) through its activation of PI4 kinase and PIP2 formation (8–10). Moreover, NCS-1 modulates Ca2+ channels trafficking and activity in various cellular models (11, 12) and has effects on synaptic transmission by way of activity-dependent facilitation of P/Q-type calcium currents at presynaptic nerve terminals (13). Finally, at the behavioral level, NCS-1 appears also to be involved in associative learning and memory (14).
Here, we focus on IL1RAPL1 functions by studying the physiological impact of IL1RAPL1/NCS-1 interaction in PC12 cells, a well known model of both nerve growth factor (NGF)-induced neuronal differentiation and Ca2+-dependent exocytosis. We show that expression of IL1RAPL1 in PC12 cells, which do not normally express the IL1RAPL1 protein, mediates, through IL1RAPL1/NSC-1 interaction, a down-regulation of N-type voltage-gated calcium channel (N-VGCC) activity and has an impact on NGF-induced neurite outgrowth. With regard to the well established role of N-VGCC in neurotransmission and of neurite outgrowth in synaptogenesis and neuronal network building-up, we propose that a misbalance of NCS-1 functions may be the initial defect causing the nonsyndromic form of X-linked MR (XLMR) linked to the absence of IL1RAPL1.
Results
IL1RAPL1 Induces a Specific Reduction in Amplitude of High-Voltage Activated (HVA) Ca2+ Currents in PC12 Cells.
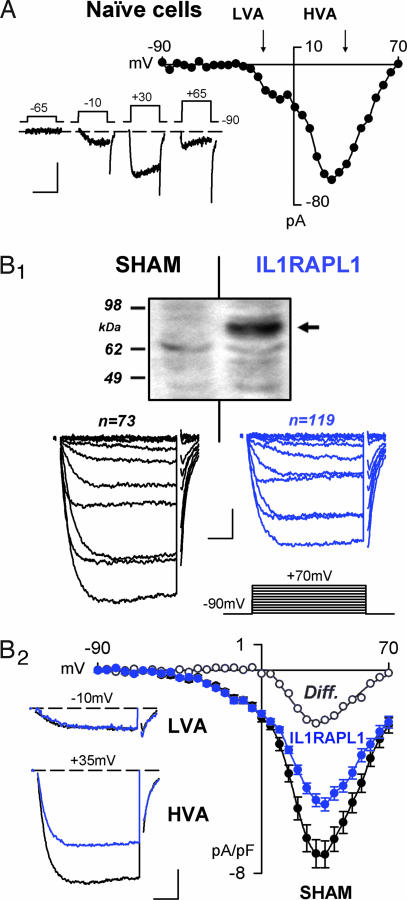
IL1RAPL1 has been shown to physically interact with NCS-1, a regulator of VGCC activity (4, 11). To test whether IL1RAPL1 controls Ca2+ channels, we analyzed the Ca2+ currents in PC12 cell lines lacking (SHAM cells) or stably expressing IL1RAPL1 (IL1RAPL1 cells, Fig. 1B, see also Materials and Methods). We used the whole-cell patch-clamp technique under the voltage-clamp mode and appropriate experimental conditions to prevent K+ and Na+ currents (see Materials and Methods).
Fig. 1.
HVA Ca2+ currents of reduced amplitude at IL1RAPL1-expressing PC12 cells. (A) Whole-cell Ca2+ current in naïve cells. Typical Ca2+ currents (lower traces) recorded in PC12 cells and I/V curve are presented. Note the presence of LVA and HVA currents. (Scale bars: 50 pA and 25 msec.) (B1) Whole-cell average Ca2+-current densities in SHAM (black line) and IL1RAPL1 (blue lines) PC12 cells. (Top) Western blot denoting the presence of IL1RAPL1 protein (≈83-kDa) in stably transfected PC12 cells (arrow) but not in SHAM cells. Ca2+ current traces induced by depolarization (Middle) from −90 mV to +70 mV by 15-mV, 30-ms steps (Bottom Right). (Scale bars: 1 pA/pF and 5 msec.) (B2) The corresponding I/V curves. Note the reduced amplitude of the HVA (at +35 mV, Left Lower) but not LVA (at −10 mV, Left Upper) current densities in IL1RAPL1 cells (blue traces). ∗, P < 0.05; ∗∗∗, P < 0.001. (Scale bars: 2 pA/pF and 8 msec.)
Upon depolarization, naïve PC12 cells elicited inward Ca2+ currents (Fig. 1A) as indicated by (i) the reversal of the I/V curve at approximately +70 mV (Fig. 1A) and (ii) the blockade of the currents by the Ca2+ channel blocker Cd2+ (200 μM) [supporting information (SI) Fig. 8A]. According to previous studies (15–17), we found that the whole-cell Ca2+ currents in naïve cells were comprised of low-voltage activated (LVA) and high voltage activated (HVA) conductances (Fig. 1A). Despite a 5-fold variation in the cell size (from ≈3 to ≈15 pF), mean LVA and HVA currents densities were similar in small (capacitance <3.5 pF) and large (capacitance >15 pF) cells, indicating that PC12 cells may be considered as a homogeneous population (data not shown).
We then characterized the Ca2+ currents in IL1RAPL1 cells (Fig. 1B1 Right) or SHAM cells (empty vector, Fig. 1B1 Left) and found that HVA current densities were significantly depressed in IL1RAPL1 cells (Fig. 1B2). The LVA current densities remained unaffected as indicated by the lack of significant difference in Ca2+ currents obtained at negative potentials (Fig. 1B2 and SI Fig. 9). These effects were independent of the cell size (data not shown).
Expression of IL1RAPL1 in PC12 Cells Abolishes N-type Ca2+ Current.
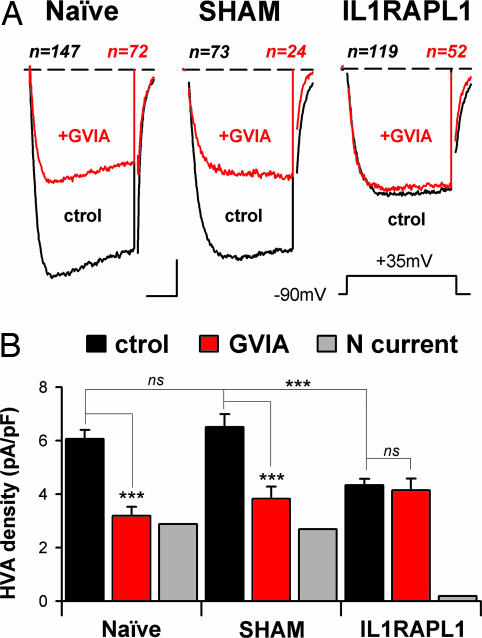
HVA Ca2+ currents comprise N-, P/Q-, L-, and R-type VGCCs that differ in their α1 subunit (18). Pharmacological dissection of N-, P/Q-, and L-type Ca2+ channels by using specific antagonists such as ω-conotoxin GVIA (1 μM), agatoxin-TK (200 nM), or nimodipine (20 μM) allowed us to determine that, in the naïve PC12 cells used here, the N-type Ca2+ channels contribute ≈45% of the whole-cell HVA currents (Fig. 2A Left and B Left), whereas the contribution of P/Q- and L-type Ca2+ channels was only ≈10–15% each (SI Fig. 8 B and C). This result was strikingly different in the IL1RAPL1 cells: Whole-cell Ca2+ current was not sensitive to 1 μM ω-conotoxin GVIA application (Fig. 2 A Right and B Right), pinpointing an almost complete lack of N-type Ca2+ current. The introduction of an empty plasmid (SHAM cells) had no effect on N-type current (Fig. 2 A Center and B Center). Thus, the large reduction in HVA currents in IL1RAPL1 cells results from an absence of N-VGCC activity.
Fig. 2.
Expression of IL1RAPL1 in PC12 cells abolishes N-type Ca2+ current. (A) Same presentation as in Fig. 1B1. Average traces obtained at +35 mV (Inset) from naïve, SHAM, and IL1RAPL1 cells are shown. Cell numbers are indicated above the traces. Black traces indicate Ca2+ currents under control conditions; red traces indicate Ca2+ currents in the presence of 1 μM ω-conotoxin GVIA. (Scale bars: 2 pA/pF and 8 msec.) (B) Mean plateau-current amplitude (20- to 30-msec time-window) recorded at +35 mV in the same cells as in A. ∗∗∗, P < 0.001. ns, not significant. The N-type contribution to the HVA current (gray bars) was obtained by subtracting GVIA currents from those in control condition.
N-Type Current Is Depressed in PC12 Overexpressing NCS-1.
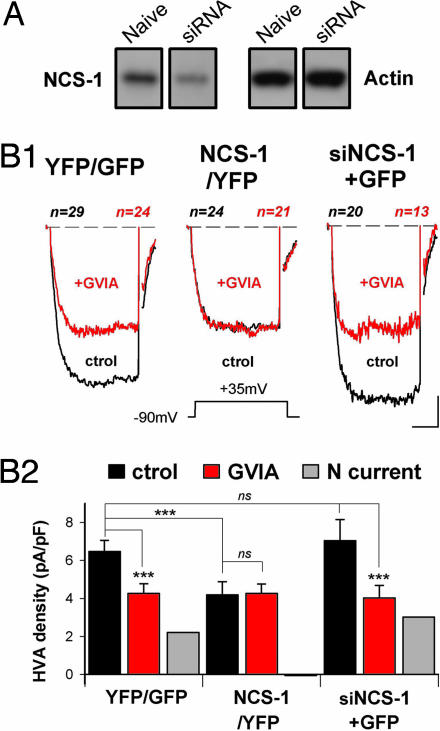
In many cells, including chromaffin cells, NCS-1 positively (13, 19) or negatively (20) modulates Ca2+ channel activities. Yet, this possibility has not been examined in PC12 cells. To analyze the effect of down- and overexpressing NCS-1 on VGCC activities, naïve PC12 cells were respectively transfected with plasmids, allowing the expression of both NCS-1 small interfering RNA (siRNA) and GFP (siNCS-1+GFP) or yellow fluorescent protein (YFP)-tagged NCS-1 protein (NCS-1/YFP). The efficacy of these constructs in controlling expression levels of NCS-1 was assessed by Western blot analysis (Fig. 3A and data not shown). Neither GFP nor YFP expression alone altered HVA Ca2+ currents in PC12 cells (naïve, 6.1 ± 0.3 pA/pF; YFP or GFP, 6.5 ± 0.6 pA/pF; P > 0.05, Figs. 2B and 3 B1 Left and B2 Left). Similar HVA current densities were found in cells submitted to NCS-1 silencing (siNCS-1+GFP, Fig. 3 B1 Right and B2 Right), whereas cells overexpressing NCS-1 exhibited HVA Ca2+ currents of reduced amplitude (NCS-1/YFP, Fig. 3 B1 Center and B2 Center) and no alterations of LVA Ca2+ current (SI Fig. 9). To determine whether this latter effect results from lack of N-VGCC, we examined the action of 1 μM ω-conotoxin GVIA on HVA current densities. ω-Conotoxin GVIA efficiently reduced HVA current densities in the YFP/GFP and siNCS-1+GFP cells (Fig. 3B) but failed to inhibit HVA currents in the NCS-1 overexpressing cells (NCS-1/YFP, Fig. 3B). Therefore, these latter cells appear to display no N-type current, with no modification of the other Ca2+ currents (HVA currents in the presence of ω-conotoxin GVIA; YFP/GFP cells, 4.2 ± 0.5 pA/pF; NCS-1/YFP, 4.2 ± 0.5 pA/pF; siNCS-1+GFP, 4.0 ± 0.7 pA/pF; P > 0.05 between all groups, Fig. 3B2). This situation is similar to the one found in IL1RAPL1 cells.
Fig. 3.
N-type current is depressed in PC12 overexpressing NCS-1. (A) PC12 cells were transfected with plasmids allowing expression of GFP or YFP (YFP/GFP) or expression of YFP-tagged NCS-1 (NCS-1/YFP) or NCS-1 siRNA and GFP (siNCS-1+GFP). (B1) Data presentation is identical as that in Fig. 2A. Cells submitted to recording were identified by epifluorescence. (Scale bars: 2 pA/pF and 8 msec.) (B2) Presentation is the same as that in Fig. 2B.
NCS-1 Is Required for IL1RAPL1-Dependent Inhibition of N-Type Current in PC12 Cells.
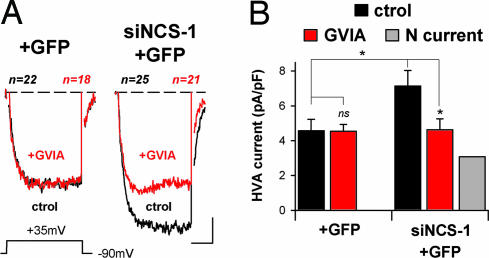
The data suggested that NCS-1 could mediate the negative regulation exerted by IL1RAPL1 on N-VGCC activity. Therefore we assessed the N-type currents in IL1RAPL1 cells after NCS-1 silencing. No difference was found in HVA currents from control IL1RAPL1 cells (4.3 ± 0.2 pA/pF) and IL1RAPL1 cells expressing GFP (4.6 ± 0.6 pA/pF, P > 0.05, Figs. 2 and 4), but the HVA currents recorded in IL1RAPL1 cells transfected with the NCS-1 siRNA and GFP constructs (siNCS-1+GFP, Fig. 4 A Right and B Right) were significantly increased (Fig. 4). The resulting HVA currents were similar to those measured in naïve PC12 cells submitted to NCS-1 silencing (i.e., transfected with siRNA NCS-1 construct; naïve siNCS-1+GFP, 7.0 ± 1.1 pA/pF; IL1RAPL1 siNCS-1+GFP, 7.1 ± 0.9 pA/pF; P > 0.05, Figs. 3B and 4B). The recovery of a high HVA current density was due to reappearance of N-type Ca2+ current in IL1RAPL1/siNCS-1+GFP cells: Indeed, a significant ω-conotoxin GVIA-sensitive component was found in these cells, and this fraction could account for the recovery of HVA currents (Fig. 4B Right). Because no modifications in NCS-1 expression at mRNA or protein levels were present in IL1RAPL1 cells (SI Fig. 10 A and B), our findings indicate that IL1RAPL1 controls indirectly the functionality of N-VGCC by way of NCS-1.
Fig. 4.
NCS-1 is needed for inhibition of N-type current by IL1RAPL1 in PC12 cells. (A) IL1RAPL1 PC12 cells transfected with plasmids allowing expression of GFP alone (+GFP) or NCS-1 siRNA with GFP (siNCS-1+GFP). Data presentation is similar to that in Fig. 2A. Recorded cells were identified by epifluorescence. (Scale bars: 2 pA/pF and 8 msec.) (B) Same presentation as in Fig. 2B. ∗, P < 0.05.
IL1RAPL1's Effect on Secretory Activity Is N-VGCC-Dependent.
Given the well established role of VGCC in secretion (21, 22), we examined whether IL1RAPL1-induced loss of N-type Ca2+ current could explain the reduction of secretion capacity reported in PC12 cells expressing IL1RAPL1 (4). Using the classical GH-secretion assay (4, 8), we found that in SHAM cells, evoked GH release was strongly reduced after application of ω-conotoxin GVIA (−59 ± 1% compared with untreated cells, P < 0.001, n = 2), indicating that Ca2+ influx through N-type Ca2+ channels may participate in the triggering of exocytosis in the PC12 cells in our conditions. Cells stably expressing IL1RAPL1 exhibited a deficit in GH release (−49 ± 6% compared with untreated SHAM cells, P < 0.01, n = 2), but in contrast to SHAM cells, there no significant effect of ω-conotoxin GVIA onto secretion from IL1RAPL1 cells (−16 ± 7% compared with untreated IL1RAPL1 cells, P > 0.05, n = 2). Moreover, after incubation with ω-conotoxin GVIA, the levels of GH release from SHAM and IL1RAPL1 cells were very similar (respectively, 41 ± 1% and 43 ± 4% from that of control-untreated SHAM conditions, P > 0.05), suggesting that the secretion deficit observed in IL1RAPL1 cells results mainly from a lack of N-VGCC activity.
IL1RAPL1 Impairs NGF-Induced Differentiation in PC12 Cells.
When treated with NGF, PC12 cells adopt neuron-like features (23, 24), displaying an increase in cell size, neurite elongation, and the insertion of Ca2+ channels, mainly of the N-type, in the plasma membrane (15, 25, 26). These effects have been shown to partially depend on NCS-1 activity (27). We therefore assessed a possible impact of IL1RAPL1/NCS-1 interaction on these NGF-induced effects.
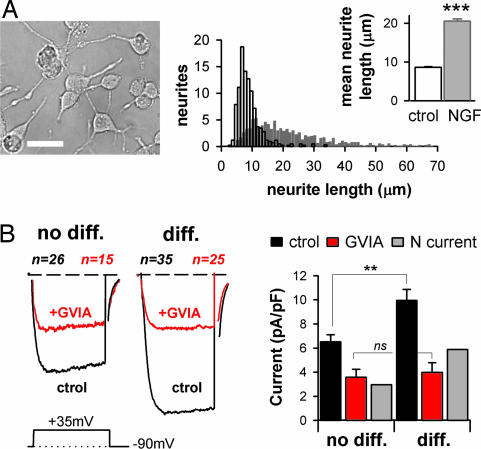
Naïve and SHAM PC12 cells were found to respond similarly to NGF treatment, and data were therefore pooled in a single “naïve/SHAM” group. After 8 days of NGF treatment, significant neurite outgrowth was observed (Fig. 5A), together with a clearly marked increase in cell surface, as assessed by capacitance measurements (from 8.9 ± 0.1 pF to 15.9 ± 0.9 pF, P < 0.001, n = 520 and 130 cells, respectively). Because not all cells responded morphologically to NGF, we selected a subpopulation of NGF-treated cells characterized by large surface area (capacitance >13 pF), and visible neurites. This cell group was denoted as “NGF-differentiated” cells (“diff” in Fig. 5). Other cells were considered as “not differentiated” (“no diff” in Fig. 5). On the basis of this distinction, we found that HVA (Fig. 5B), but not LVA currents (data not shown), were significantly increased in the naïve/SHAM NGF-differentiated cells. NGF-induced increases in HVA currents have been previously reported in PC12 cells and attributed to an increase in N-VGCC activity (15). Accordingly, application of ω-conotoxin GVIA on “NGF-differentiated” cells lowered HVA current densities (Fig. 5B) to the level observed in “not differentiated” cells treated with ω-Conotoxin GVIA. This finding shows that massive plasma membrane insertion/activation of N-VGCC occurs when PC12 cells respond to NGF. This also raises the question of whether this effect is affected by IL1RAPL1/NCS-1 interaction.
Fig. 5.
NGF induces neurite extension and increase in N-type Ca2+ current in PC12 cells. (A) Näive/SHAM cells plus NGF. (Left) Phase-contrast photograph of neuronal-like differentiated PC12 cells after NGF treatment. (Scale bar: 20 μm.) (Right) Distribution histogram of neurites' length emitted by naïve/SHAM cells in absence (ctrol, white bar) or presence of NGF for 8 days (gray bar). (Inset) Mean neurite length. ∗∗∗, P < 0.001. (B) Ca2+ currents are presented as in Fig. 2. For distinction between “no-diff” and “diff” cells, see Results. NGF-differentiated PC12 cells (diff) have a cell capacitance >13 pF and visible neurites. (Scale bars: 2 pA/pF and 8 msec.) ∗∗, P < 0.005.
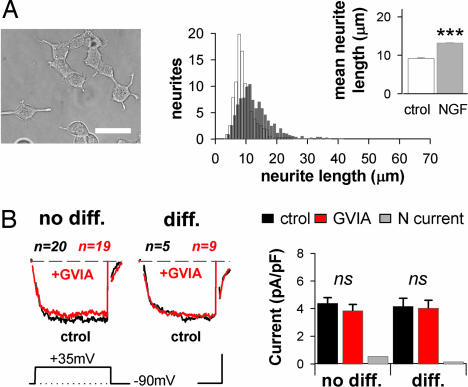
We observed that NGF had less impact on the morphology of IL1RAPL1 cells: For example, the average neurite length was significantly decreased as compared with NGF-treated naïve/SHAM cells (naïve/SHAM+NGF, 20.5 ± 0.6 μm; IL1RAPL1+NGF, 13.2 ± 0.2 μm; P < 0.001, Figs. 5A and 6A), albeit still significantly higher than in control IL1RAPL1 cells (control, 9.2 ± 0.2 μm; P < 0.001 compared with +NGF, Fig. 6A). After NGF treatment, the mean number of neurites per NGF-treated cell was found to be similar in stable IL1RAPL1 and naïve/SHAM cell groups (data not shown), suggesting a deficit in neurite elongation rather than in neurite formation in the presence of IL1RAPL1. Correlating well with the reduced neurite extension, we found that cell capacitance of NGF-treated IL1RAPL1 cells was only slightly increased compared with NGF-untreated cells (no NGF, 8.4 ± 0.2 pF; NGF, 11.2 ± 0.7 pF; P < 0.05, n = 231 and 106, respectively) (Fig. 6A), limiting the number of “differentiated” cells. In the few IL1RAPL1 NGF-treated cells that appeared differentiated, HVA densities were very similar to that of naïve or “not-differentiated” IL1RAPL1 cells (HVA currents: IL1RAPL1, 4.3 ± 0.2 pA/pF; IL1RAPL1+NGF “no diff,” 4.4 ± 0.4 pA/pF; IL1RAPL1+NGF “diff,” 4.2 ± 0.6 pA/pF; P > 0.05, Figs. 2B and 6B). Finally, ω-conotoxin GVIA had no significant effect on the whole-cell Ca2+ currents recorded in both “differentiated” and “not-differentiated” stable IL1RAPL1 cells (Fig. 6B) suggesting that the effect on HVA currents rely on the same mechanism as the one carried out by IL1RAPL1 in control conditions.
Fig. 6.
IL1RAPL1 inhibits NGF-induced neurite elongation and N-type current. (A) IL1RAPL1 cells plus NGF. The presentation is the same as in Fig. 5A. (Scale bar: 20 μm.) (B) Same presentation as in Fig. 5B. (Scale bars: 2 pA/pF and 8 msec.)
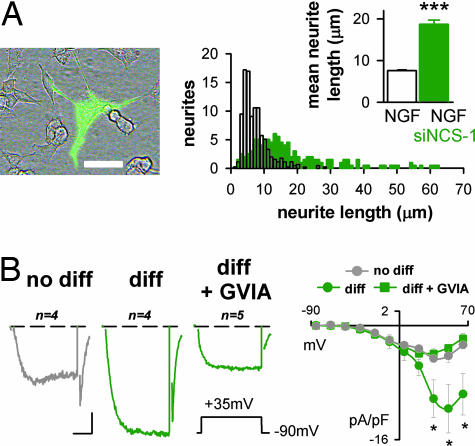
Next, the involvement of NCS-1 in the reduced NGF-induced morphological differentiation observed in IL1RAPL1 cells was examined. After lowering the endogenous level of NCS-1 by siRNA, neurite elongation in IL1RAPL1 cells was found to be comparable to naïve/SHAM cells (naïve/SHAM, 20.5 ± 0.6 μm; IL1RAPL1/siNCS-1/GFP, 18.7 ± 1.0 μm; P > 0.05, Fig. 5A and 7A), and significantly higher than in the adjacent nontransfected IL1RAPL1 cells (8.6 ± 0.2 μm; P < 0.001, Fig. 7A). Confirming that the NGF effect was fully recovered in the absence of NCS-1, large N-type Ca2+ currents were recorded in IL1RAPL1/siNCS-1+GFP/NGF-treated cells: indeed, HVA current densities in “differentiated” cells were comparable in these cells and in the naïve/SHAM cells (10.3 ± 2.6 pA/pF and 10.0 ± 0.9 pA/pF, respectively; P > 0.05, Figs. 5B and 7B). “Not differentiated” cells were only slightly affected (Fig. 7B). To summarize, IL1RAPL1/NCS-1 interaction is mandatory to observe the effect of IL1RAPL1 on NGF-induced neurite elongation in PC12 cells.
Fig. 7.
IL1RAPL1 inhibits NGF-induced neurite elongation and N-type current by way of NCS-1. (A) IL1RAPL1 cells plus NGF. The presentation is the same as in Fig. 6A. Note the morphological difference between the GFP-expressing cells (bright cell) and the surrounding nontransfected IL1RAPL1 cells. (B) (Left) Same presentation as in Fig. 2A. (Scale bars: 2 pA/pF and 8 msec.) (Right) The corresponding I/V curves. Note the increased amplitude of the HVA, but not LVA currents, in “diff” cells (dark green traces). ∗, P < 0.05.
Discussion
In this study, Ca2+ currents analysis using pharmacological tools combined with genetic manipulations of IL1RAPL1 expression in PC12 cells reveals that the N-type, ω-conotoxin GVIA sensitive, Ca2+ current is specifically abolished by IL1RAPL1. We also found that increasing NCS-1 levels in PC12 cells results in the suppression of N-type current whereas NCS-1 silencing prevented the IL1RAPL1-induced inhibition of N-type currents. Manipulation of IL1RAPL1 levels did not change the expression of either NCS-1 or N-VGCC α1B subunit (SI Fig. 10 A and B), suggesting an action of IL1RAPL1 on the functionality of NCS-1 and N-type Ca2+-channels. This finding is consistent with previous demonstrations that IL1RAPL1 specifically interacts with NCS-1, excluding other members of the NCS-1 family, such as calmodulin and hippocalcin (4) and, that NCS-1 regulates the N-, P/Q-, or L-type Ca2+-currents (13, 19, 20, 28). The compelling data reported here clearly establish that IL1RAPL1, through its interaction with NCS-1, regulates the activity of N-type voltage-gated Ca2+-channels.
The IL1RAPL1/NCS-1 interaction is likely to occur at the plasma membrane within a wide range of physiological conditions. IL1RAPL1 is an integral membrane protein. Because the C-terminal part of NCS-1 binds to IL1RAPL1 in a Ca2+-independent manner (4) and significant IL1RAPL1 and NCS-1 have been colocalized in unstimulated cells (4), this complex may form in resting cells. Possibly, IL1RAPL1 allows bypassing the requirement of cell stimulation to recruit NCS-1 at the plasma membrane, as reported in naïve PC12 cells (8). In naïve PC12 cells, which display large N-type Ca2+-currents, NCS-1 silencing has no effect on the Ca2+-currents, indicating that few channels are inhibited by endogenous NCS-1. The same manipulation in IL1RAPL1 cells reveals an important N-type current, suggesting that IL1RAPL1 enhances the negative effect of NCS-1 on N-type Ca2+ channels activity. Therefore, we propose that, under resting conditions, IL1RAPL1 mediates recruitment of NCS-1 to plasma membrane, which is a step dispensable when concentration of NCS-1 is high (Fig. 3B), and stimulates its negative regulatory activity on N-VGCC.
The mechanisms underlying the negative regulatory action of IL1RAPL1/NCS-1 on Ca2+-channels are yet unknown. The fact that NCS-1 controls different Ca2+ current subtypes in a number of cell systems (13, 19, 20, 28) suggests a general mechanism of action. Previous work has shown that the NCS-1-related neuronal calcium binding proteins CaBP1 and VILIP2 bind to the C-terminal domain of α-subunit of P/Q-type channel, thereby regulating its function (29, 30). An interaction of NCS-1 with β-subunits has also been proposed (13, 28). However, in PC12 cells, NCS-1 interacts with and regulates PI4Kβ activity, resulting in phosphoinositol 4,5-diphosphate (PIP2) production (8, 9, 31–33), a well known regulator of Ca2+ channel activity (34, 35). Through this activation of PI4Kβ, NCS-1 also stimulate exocytosis (8, 10, 36) and endocytosis (37) in PC12 cells. However a massive IL1RAPL1-induced endocytosis of N-type channels is unlikely to account for by the observed reduction in N-type current amplitude, as similar amount and localization of the α1B N-VGCC specific subunit were found in SHAM and IL1RAPL1 cells (SI Fig. 10 C and D).
In IL1RAPL1 cells, although inactivation of N-VGCC was responsible for the observed decrease in stimulated exocytosis (ref. 4 and our unpublished data), such a process cannot account for the deficit in neurite elongation. Indeed, chronic inhibition of N-VGCC by ω-conotoxin GVIA is insufficient to prevent neurite outgrowth in NGF-treated PC12 cells (26). In contrast with previous reports (27), we found that NCS-1 silencing in SHAM cells did not increase neurite elongation, whereas, in IL1RAPL1 cells, this induces a large increase in neurite length. These data also indicate that in absence of IL1RAPL1 endogenous NCS-1 plays no or only a minor role in regulating NGF-stimulated neurite elongation in PC12 cells.
On the basis of our data obtained in PC12 cells, it is tempting to speculate that IL1RAPL1 may modulate neurotransmitter release and synaptic activity and/or building-up in the nervous system. IL1RAPL1/NCS-1 interaction could be essential for synaptic physiology: Indeed, NCS-1 modulates VGCC activity at synapses thereby controlling short term plasticity (13). In addition, Ca2+ signaling in both synaptic compartments efficiently controls long term plasticity (38, 39), thought to be the cellular substrate for learning and memory. Our proposals are in line with the recent progress in the field of MR suggesting that synaptic defects may explain the cognitive impairment resulting from mutations in MR-related genes which products are localized at the pre- and/or postsynaptic compartments (2). Therefore, our findings constitute a critical entry point to address neuronal functions mediated by IL1RAPL1/NCS-1 interaction and physiopathological mechanisms underlying cognitive deficit resulting from a loss of function of IL1RAPL1.
Materials and Methods
Cell Culture.
PC12 cells were plated on poly-l-lysine coated glass coverslips, and cultured in DMEM (Invitrogen, Carlsbad, CA) supplemented with 4.5 μg/ml glucose and containing 30 mM NaHCO3, 5% FBS, 10% horse serum, and 100 units/ml of penicillin/streptomycin (4, 8, 40). In “differentiation” experiments (Figs. 5–7), 2.5 S murine NGF (50 ng/ml) was added to the culture medium 24 h after plating or transfection procedure.
Plasmids, siRNA, and Generation of Stable Cell Lines.
IL1RAPL1 and SHAM cells were obtained either with pIREShygro vector (Clontech, Mountain View, CA) containing IL1RAPL1 cDNA or with an empty pIREShygro vector. Hygromycin (150 μg/ml) was added 48 h after transfection, and resistant clones were isolated and amplified. Expression of IL1RAPL1 was controlled by Western blotting (Fig. 1B) using a polyclonal antibody described in ref. 4. NCS-1-YFP was described in ref. 41. For siRNA targeting, see SI Materials and Methods.
GH Secretion in PC12 Cells.
Cultured confluent cells were transfected using GeneReporter (Gene Therapy Systems, Gaithersburg, MD), and 30 μM ATP-mediated GH release was monitored 48 h after transfection (4, 8, 40).
Patch-Clamp Experiments.
For electrophysiological recordings, cells were subjected to the standard whole-cell configuration of the patch-clamp technique after 2–8 days in culture, depending on the experimental conditions. To measure Ca2+ currents, the internal (patch-pipette) solution consisted of 130 mM CsCl, 2 mM MgCl2, 11 mM EGTA, 20 mM Hepes, 2 mM Na2ATP, 0.1 mM GTP, 10 mM glucose, pH 7.3, and 300 mM mOsm, and the bath solution contained 20 mM CaCl2, 125 mM tetraethylammonium (TEA)-Cl, 10 mM Hepes, 10 mM glucose, pH 7.3, and 300 mM mOsm. Transmembrane currents and capacitance measurements were obtained using a multiclamp700B (Axon Instruments, Union City, CA) amplifier and an Axon Digidata 1322a interface. Command voltages and storage of current data were driven by the pClamp 8.2 software (Axon Instruments). Currents were recorded at room temperature (20–25°C), and within the first minute after the seal opening to avoid run-up and run-down of Ca2+ currents. Ca2+ currents were obtained in response to 30 msec depolarizing pulses applied every second from a holding potential of −90 mV in 5-mV increasing steps. Plateau currents (I) were obtained by averaging 20- to 30-msec time periods of three consecutive steps (V), and I/V curves reconstructed. HVA mean currents are considered at +35 mV and presented normalized to the measured cell capacitance to account for cell size.
Neurite Outgrowth Analysis.
After 8 days in NGF-supplemented culture, PC12 cell images were picked blind at random for each experimental group by using a phase contrast or epifluorescence microscope. Neurite length was measured using the ImageTool software.
Materials.
Monoclonal anti-NCS-1 and anti-actin antibodies were purchased from BD Biosciences (San Diego, CA) and Sigma-Aldrich (Dorset, U.K.) respectively. ω-Conotoxin GVIA and Agatoxin-TK were from Alomone labs (Alomone, Jerusalem, Israel), Cadmium and Nimodipine from Sigma-Aldrich.
Data are presented as mean ± SEM. Statistical tests were performed using the two-tailed unpaired t test.
Supplementary Material
Acknowledgments
We thank Dr. J. L. Bossu for helpful discussions; Dr. A. Jeromin (Baylor College of Medicine, Houston, TX) for sharing valuable reagents; Drs. M. F. Bader and N. J. Grant for critical reading of the manuscript; and V. Calco and H. Bekenkampf for their technical assistance. This work was supported by Agence Nationale de la Recherche Grants ANR-06-NEURO-003–01 (to Y.H. and J.C.) and ANR-05-BLAN-0326–01 (to N.V.), Louis-Pasteur University Grant BQR-2006 (to Y.H.), Fondation Jérôme Lejeune, and Fondation pour la Recherche Médicale.
Abbreviations
- GH
growth hormone
- HVA
high-voltage activated
- IL1RAPL1
IL1-receptor accessory protein-like 1 gene
- LVA
low-voltage activated
- MR
mental retardation
- NCS-1
neuronal calcium sensor-1
- NGF
nerve growth factor
- N-VGCC
N-type voltage-gated calcium channels
- siRNA
small interfering RNA
- YFP
yellow fluorescent protein.
Footnotes
The authors declare no conflict of interest.
This article is a PNAS Direct Submission.
This article contains supporting information online at www.pnas.org/cgi/content/full/0701133104/DC1.
References
- 1.Ropers HH, Hamel BCJ. Nat Rev Genet. 2005;6:42–57. doi: 10.1038/nrg1501. [DOI] [PubMed] [Google Scholar]
- 2.Chelly J, Khelfaoui M, Francis F, Cherif B, Bienvenu T. Eur J Hum Genet. 2006;14:701–713. doi: 10.1038/sj.ejhg.5201595. [DOI] [PubMed] [Google Scholar]
- 3.Carrie A, Jun L, Bienvenu T, Vinet MC, McDonell N, Couvert P, Zemni R, Cardona A, Van Buggenhout G, Frints S, et al. Nat Genet. 1999;23:25–31. doi: 10.1038/12623. [DOI] [PubMed] [Google Scholar]
- 4.Bahi N, Friocourt G, Carrie A, Graham ME, Weiss JL, Chafey P, Fauchereau F, Burgoyne RD, Chelly J. Hum Mol Genet. 2003;12:1415–1425. doi: 10.1093/hmg/ddg147. [DOI] [PubMed] [Google Scholar]
- 5.Martone ME, Edelman VM, Ellisman MH, Nef P. Cell Tissue Res. 1999;295:395–407. doi: 10.1007/s004410051246. [DOI] [PubMed] [Google Scholar]
- 6.McFerran BW, Graham ME, Burgoyne RD. J Biol Chem. 1998;273:22768–22772. doi: 10.1074/jbc.273.35.22768. [DOI] [PubMed] [Google Scholar]
- 7.Burgoyne RD, Weiss JL. Biochem J. 2001;353:1–12. [PMC free article] [PubMed] [Google Scholar]
- 8.de Barry J, Janoshazi A, Dupont JL, Procksch O, Chasserot-Golaz S, Jeromin A, Vitale N. J Biol Chem. 2006;281:18098–18111. doi: 10.1074/jbc.M509842200. [DOI] [PubMed] [Google Scholar]
- 9.Rajebhosale M, Greenwood S, Vidugiriene J, Jeromin A, Hilfiker S. J Biol Chem. 2003;278:6075–6084. doi: 10.1074/jbc.M204702200. [DOI] [PubMed] [Google Scholar]
- 10.Zheng Q, Bobich JA, Vidugiriene J, McFadden SC, Thomas F, Roder J, Jeromin A. J Neurochem. 2005;92:442–451. doi: 10.1111/j.1471-4159.2004.02897.x. [DOI] [PubMed] [Google Scholar]
- 11.Weiss JL, Burgoyne RD. Trends Neurosci. 2002;25:489–491. doi: 10.1016/s0166-2236(02)02247-6. [DOI] [PubMed] [Google Scholar]
- 12.Hilfiker S. Biochem Soc Trans. 2003;31:828–832. doi: 10.1042/bst0310828. [DOI] [PubMed] [Google Scholar]
- 13.Tsujimoto T, Jeromin A, Saitoh N, Roder JC, Takahashi T. Science. 2002;295:2276–2279. doi: 10.1126/science.1068278. [DOI] [PubMed] [Google Scholar]
- 14.Gomez M, De Castro E, Guarin E, Sasakura H, Kuhara A, Mori I, Bartfai T, Bargmann CI, Nef P. Neuron. 2001;30:241–248. doi: 10.1016/s0896-6273(01)00276-8. [DOI] [PubMed] [Google Scholar]
- 15.Usowicz MM, Porzig H, Becker C, Reuter H. J Physiol. 1990;426:95–116. doi: 10.1113/jphysiol.1990.sp018128. [DOI] [PMC free article] [PubMed] [Google Scholar]
- 16.Liu H, Felix R, Gurnett CA, De Waard M, Witcher DR, Campbell KP. J Neurosci. 1996;16:7557–7565. doi: 10.1523/JNEUROSCI.16-23-07557.1996. [DOI] [PMC free article] [PubMed] [Google Scholar]
- 17.Del Toro R, Levitsky KL, Lopez-Barneo J, Chiara MD. J Biol Chem. 2003;278:22316–22324. doi: 10.1074/jbc.M212576200. [DOI] [PubMed] [Google Scholar]
- 18.Catterall WA, Perez-Reyes E, Snutch TP, Striessnig J. Pharmacol Rev. 2005;57:411–425. doi: 10.1124/pr.57.4.5. [DOI] [PubMed] [Google Scholar]
- 19.Wang CY, Yang F, He X, Chow A, Du J, Russell JT, Lu B. Neuron. 2001;32:99–112. doi: 10.1016/s0896-6273(01)00434-2. [DOI] [PubMed] [Google Scholar]
- 20.Weiss JL, Archer DA, Burgoyne RD. J Biol Chem. 2000;275:40082–40087. doi: 10.1074/jbc.M008603200. [DOI] [PubMed] [Google Scholar]
- 21.Penner R, Neher E. J Exp Biol. 1988;139:329–345. doi: 10.1242/jeb.139.1.329. [DOI] [PubMed] [Google Scholar]
- 22.Reid CA, Bekkers JM, Clements JD. Trends Neurosci. 2003;26:683–687. doi: 10.1016/j.tins.2003.10.003. [DOI] [PubMed] [Google Scholar]
- 23.Greene LA, Tischler AS. Proc Natl Acad Sci USA. 1976;73:2424–2428. doi: 10.1073/pnas.73.7.2424. [DOI] [PMC free article] [PubMed] [Google Scholar]
- 24.Levi A, Biocca S, Cattaneo A, Calissano P. Mol Neurobiol. 1988;2:201–226. doi: 10.1007/BF02935346. [DOI] [PubMed] [Google Scholar]
- 25.Lewis DL, De Aizpurua HJ, Rausch DM. J Physiol. 1993;465:325–342. doi: 10.1113/jphysiol.1993.sp019679. [DOI] [PMC free article] [PubMed] [Google Scholar]
- 26.Bouron A, Becker C, Porzig H. Naunyn Schmiedebergs Arch Pharmacol. 1999;359:370–377. doi: 10.1007/pl00005363. [DOI] [PubMed] [Google Scholar]
- 27.Hui H, McHugh D, Hannan M, Zeng F, Xu SZ, Khan SU, Levenson R, Beech DJ, Weiss JL. J Physiol. 2006;572:165–172. doi: 10.1113/jphysiol.2005.102889. [DOI] [PMC free article] [PubMed] [Google Scholar]
- 28.Rousset M, Cens T, Gavarini S, Jeromin A, Charnet P. J Biol Chem. 2003;278:7019–7026. doi: 10.1074/jbc.M209537200. [DOI] [PubMed] [Google Scholar]
- 29.Lee A, Westenbroek RE, Haeseleer F, Palczewski K, Scheuer T, Catterall WA. Nat Neurosci. 2002;5:210–217. doi: 10.1038/nn805. [DOI] [PMC free article] [PubMed] [Google Scholar]
- 30.Lautermilch NJ, Few AP, Scheuer T, Catterall WA. J Neurosci. 2005;25:7062–7070. doi: 10.1523/JNEUROSCI.0447-05.2005. [DOI] [PMC free article] [PubMed] [Google Scholar]
- 31.Hendricks KB, Wang BQ, Schnieders EA, Thorner J. Nat Cell Biol. 1999;1:234–241. doi: 10.1038/12058. [DOI] [PubMed] [Google Scholar]
- 32.Zhao X, Varnai P, Tuymetova G, Balla A, Toth ZE, Oker-Blom C, Roder J, Jeromin A, Balla T. J Biol Chem. 2001;276:40183–40189. doi: 10.1074/jbc.M104048200. [DOI] [PubMed] [Google Scholar]
- 33.Taverna E, Francolini M, Jeromin A, Hilfiker S, Roder J, Rosa P. J Cell Sci. 2002;115:3909–3922. doi: 10.1242/jcs.00072. [DOI] [PubMed] [Google Scholar]
- 34.Gamper N, Reznikov V, Yamada Y, Yang J, Shapiro MS. J Neurosci. 2004;24:10980–10992. doi: 10.1523/JNEUROSCI.3869-04.2004. [DOI] [PMC free article] [PubMed] [Google Scholar]
- 35.Lechner SG, Hussl S, Schicker KW, Drobny H, Boehm S. Mol Pharmacol. 2005;68:1387–1396. doi: 10.1124/mol.105.014886. [DOI] [PubMed] [Google Scholar]
- 36.Koizumi S, Rosa P, Willars GB, Challiss RA, Taverna E, Francolini M, Bootman MD, Lipp P, Inoue K, Roder J, Jeromin A. J Biol Chem. 2002;277:30315–30324. doi: 10.1074/jbc.M201132200. [DOI] [PubMed] [Google Scholar]
- 37.Kapp-Barnea Y, Ninio-Many L, Hirschberg K, Fukuda M, Jeromin A, Sagi-Eisenberg R. Mol Biol Cell. 2006;17:4130–4141. doi: 10.1091/mbc.E05-11-1014. [DOI] [PMC free article] [PubMed] [Google Scholar]
- 38.Humeau Y, Shaban H, Bissiere S, Lüthi A. Nature. 2003;426:841–845. doi: 10.1038/nature02194. [DOI] [PubMed] [Google Scholar]
- 39.Humeau Y, Herry C, Kemp N, Fourcaudot E, Bissière S, Lüthi A. Neuron. 2005;45:119–131. doi: 10.1016/j.neuron.2004.12.019. [DOI] [PubMed] [Google Scholar]
- 40.Vitale N, Chasserot-Golaz S, Bailly Y, Morinaga N, Frohman MA, Bader MF. J Cell Biol. 2002;159:79–89. doi: 10.1083/jcb.200203027. [DOI] [PMC free article] [PubMed] [Google Scholar]
- 41.Scalettar BA, Rosa P, Taverna E, Francolini M, Tsuboi T, Terakawa S, Koizumi S, Roder J, Jeromin A. J Cell Sci. 2002;115:2399–2412. doi: 10.1242/jcs.115.11.2399. [DOI] [PubMed] [Google Scholar]
Associated Data
This section collects any data citations, data availability statements, or supplementary materials included in this article.


