

Abstract
Recent findings of vestibular responses in visual cortex — the dorsal medial superior temporal area (MSTd) — suggest that vestibular signals might contribute to cortical processes mediating self-motion perception. We tested this hypothesis in monkeys trained to perform a fine heading discrimination task based solely on inertial motion cues. Neuronal sensitivity was typically lower than psychophysical sensitivity, and only the most sensitive neurons rivaled behavioral performance. MSTd responses were significantly correlated with perceptual decisions, with correlations being strongest for the most sensitive neurons. These results support a functional link between MSTd and heading perception based on inertial motion cues. These cues are mainly of vestibular origin, since labyrinthectomy produced dramatic elevation of psychophysical thresholds and abolished MSTd responses. This study provides the first evidence that links single-unit activity to spatial perception mediated by vestibular signals, and suggests that the role of MSTd in self-motion perception extends beyond optic flow processing.
Keywords: monkey, MST, optic flow, heading, visual, vestibular
The vestibular apparatus provides sensory information about the angular velocity (semicircular canals) and linear acceleration (otolith organs) of the head1, 2. Lesion studies demonstrate that vestibular signals play critical roles in several reflexive processes, including compensatory eye movements (vestibulo-ocular reflex, VOR)3, 4, maintenance of balance, and control of posture5. The neural circuits that mediate these automatic processes—especially the VOR—have been explored extensively6, 7.
The vestibular system should also contribute to processes that are under cognitive control, such as perception of spatial orientation and self-motion8–10. To investigate this, we trained rhesus monkeys to report their perceived direction of heading (leftward vs. rightward relative to straight ahead) based solely on inertial motion cues. We show that trained animals discriminate differences in heading as small as 1–2° (comparable to human performance11), and that damage to the vestibular labyrinth dramatically impairs performance. This establishes the heading discrimination task as a sensitive probe of vestibular function relevant to self-motion perception.
Where in the brain can one find neurons that mediate heading perception based on inertial motion cues? Unlike in other sensory systems, relatively little is known about the cortical processing of vestibular signals. Whereas neural activity has been linked to perception in other systems (e.g., visual and somatosensory12, 13), single neurons have not previously been shown to carry vestibular signals related to spatial perception. Although the parieto-insular vestibular cortex (PIVC)14 and other putative regions of ‘vestibular cortex’15 may contribute to heading perception, they have not been studied in the context of a perceptual task.
Alternatively, perception of heading from inertial motion may be mediated by extrastriate visual areas (e.g., the dorsal medial superior temporal area, MSTd) that have been implicated in heading perception based on visual motion (optic flow)16, 17. Indeed, this would be sensible if robust perception of self-motion ultimately relies on neural representations in which visual and vestibular cues are integrated. MSTd neurons have large visual receptive fields18, respond selectively to large-field optic flow stimuli16, 17, and are thought to constitute a population code for representing heading from optic flow19–22. Electrical microstimulation of MSTd biases monkeys’ reports of heading based on optic flow23, 24, indicating that MSTd carries visual signals used to judge heading.
The hypothesis that MSTd contributes to non-visual heading perception is supported by recent findings that MSTd neurons show directional tuning in the absence of visual stimulation, presumably reflecting vestibular inputs20, 25–27. To test this hypothesis, we examined whether the non-visual responses of MSTd neurons are correlated with perceptual decisions about heading using ‘choice probability’ analysis28, 29. We report that many MSTd neurons show significant correlations with animals’ percepts, and that these correlations are strongest for the most sensitive neurons. These signals are vestibular in origin because labyrinthectomy abolishes MSTd responses to inertial motion. Our findings provide the first evidence for a functional link between single-unit activity and vestibular-mediated perception, and suggest that area MSTd—conventionally considered a visual area— contributes to self-motion perception based on non-visual cues.
RESULTS
Psychophysical performance
To assess self-motion perception based on non-visual (inertial) cues, we trained 4 monkeys to perform a heading discrimination task. Using a motion platform, monkeys were translated along a straight path in the horizontal plane while maintaining fixation on a head-fixed target (Fig. 1a, b). To activate vestibular otolith organs, inertial motion stimuli contained a Gaussian velocity profile with a peak-acceleration of 1 m/s2 (Fig. 1c)25. The direction of heading was varied (Fig. 1a), and the animal classified each stimulus as ‘rightward’ or ‘leftward’ relative to straight ahead. Animals reported their perceived heading by making a saccade toward one of two targets that were presented after the cessation of movement (Fig. 1b).
Figure 1.
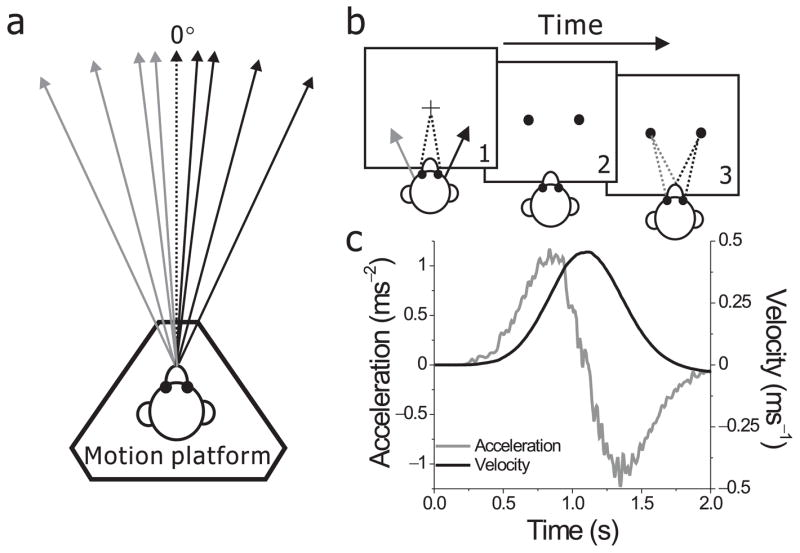
Experimental setup and stimuli. (a) Using a motion platform, animals were translated forward along different heading directions in the horizontal plane. 0° heading denotes straight forward translation. (b) Each trial started with the appearance of a small fixation point in the center of the screen. Monkeys fixate the target while being passively moved. As soon as motion is completed, the fixation point disappears and two choice targets appear. Monkeys are required to make a saccade to one of the two targets to report their perceived heading direction (left or right relative to straight-ahead). (c) The inertial motion stimulus followed a Gaussian velocity profile (black) over the stimulus duration of 2s. The corresponding acceleration profile was biphasic (gray) with a peak acceleration of 0.1 G. The gray curve illustrates the output of a linear accelerometer attached to the motion platform, whereas the black curve corresponds to its integral.
Average psychometric functions are shown in Fig. 2a, b, c, d (black symbols). The proportion of ‘rightward’ decisions is plotted against heading, and the data were fit with cumulative Gaussian functions (black lines). All four animals discriminated small changes in heading based on inertial motion cues, with psychophysical thresholds (the angular deviation from straight ahead yielding 84% correct) of 1.3°, 3.4°, 4.0° and 2.9° (data pooled across all sessions). Discriminability depended on motion strength, but thresholds reached a plateau for peak accelerations above 0.7 m/s2 (Suppl. Fig. 1). The monkeys’ heading thresholds are comparable to human performance in a similar task11.
Figure 2.
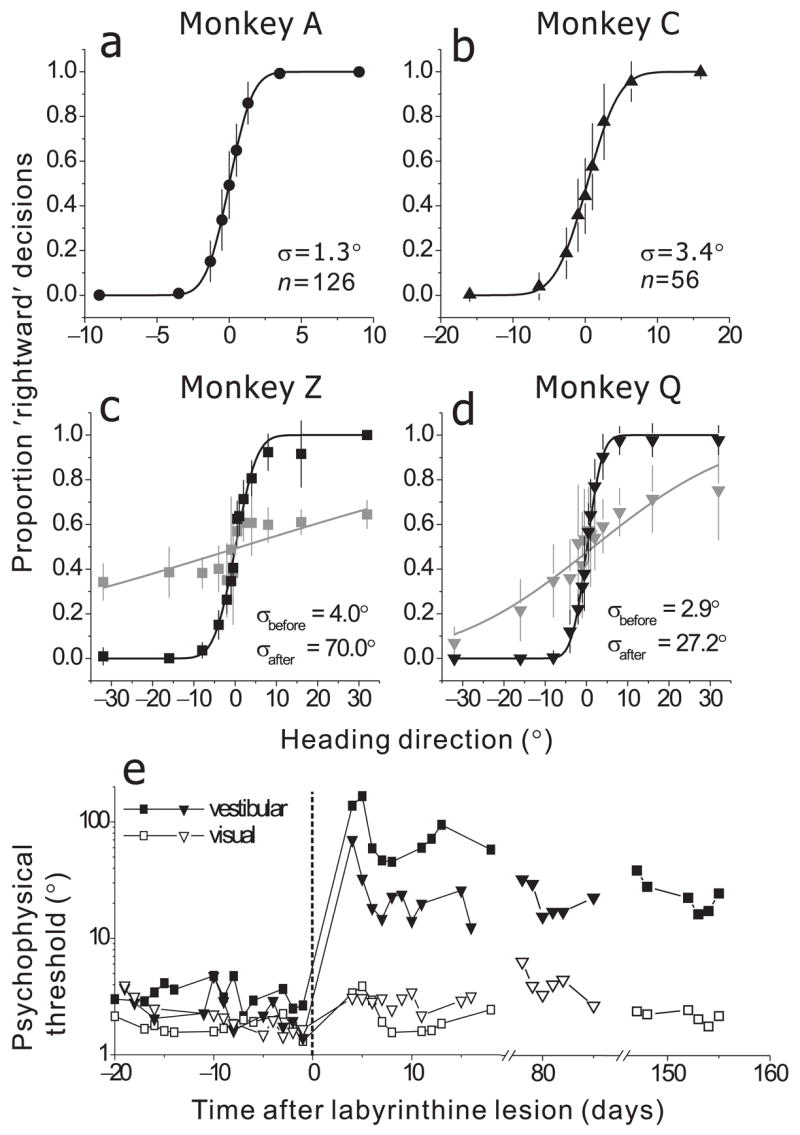
Psychophysical performance in the heading discrimination task. (a, b, c, d) Average psychometric functions for 4 different animals, plotted as proportion of ‘rightward’ decisions (±SD) as a function of heading direction (black symbols). Each datum represents the average across all experimental sessions. Smooth curves represent cumulative Gaussian fits to the data. For monkeys Z and Q, gray symbols and lines illustrate the average psychometric function over several sessions during the first 2 weeks following bilateral labyrinthectomy. (e) Daily psychophysical thresholds before and after labyrinthectomy (0 marks the day of surgery). Data obtained during the heading discrimination task in the absence of optic flow (filled symbols, ‘Vestibular’) are compared with those from a similar task in which heading was defined exclusively by optic flow (open symbols, ‘Visual’). Circles: monkey Z. Triangles: monkey Q.
Because no optic flow information was available during movement, animals most likely use non-visual sensory cues to perform the task. To narrow down the possible cues, we tested monkey C with two variants of the heading task in which inertial motion stimuli were delivered in complete darkness (Suppl. Fig. 2a, b; Suppl. Methods). One variant required central fixation (‘dark fixation’); the other did not (‘dark free viewing’). Behavioral performance was similar in both variants and the standard fixation condition (95% confidence intervals: 2.0–2.3° for dark fixation; 2.0–2.4° for dark free viewing; 1.8–2.1° for standard fixation, Suppl. Fig. 2). In addition, the animal performed well within the first block or two of these task variants (Suppl. Fig. 3), so it was not learning a new task during these conditions. Together, these controls indicate that precise heading discrimination does not rely on retinal slip of the fixation target or on smooth eye movement command signals involved in cancellation of the VOR during fixation.
To directly investigate vestibular contributions to heading discrimination, the behavior of two animals (monkeys Z and Q) was tested after bilateral labyrinthectomy (Suppl. Methods). Performance was severely degraded during the period from 3–18 days after destruction of the labyrinths (Fig. 2c, d; gray symbols/lines). Psychophysical thresholds, obtained by fitting the average psychometric function, increased from 4.0° (95% confidence interval (CI): 3.9–4.2°, n=13) to 69.9° (95% CI: 65.6–76.1°, n=9) for Monkey Z and from 2.9° (95% CI: 2.8–3.0°, n=14) to 27.2° (95% CI: 26.1–29.2°, n=10) for Monkey Q. Even at the largest heading angles (± 32°), labyrinthectomized animals failed to perform near 100% accuracy (Fig. 2c, d; gray symbols).
Daily psychophysical thresholds are shown in Fig. 2e (filled symbols). Thresholds were elevated dramatically following the lesion, improved noticeably over the first few days of post-lesion testing, and showed some further gradual recovery over the subsequent weeks. This partial recovery of function likely results from the animal learning to use other sources of sensory information. Note, however, that discrimination thresholds were still elevated by roughly 10-fold when measured 3 to 6 months following the lesion. Thus, labyrinthectomy produced a severe and long-lasting deficit in heading discrimination.
To control for non-specific effects of labyrinthectomy, we examined psychophysical performance in a purely visual heading task in which the platform remained stationary and heading was specified solely by optic flow (see Suppl. Methods and 23). Labyrinthectomy had a very modest effect on visual heading thresholds (Fig. 2e, open symbols). Over the first 2 weeks of post-operative testing, visual thresholds increased only slightly from 1.9° (95% CI: 1.8–2.0°, n=13) to 2.3° (95% CI: 2.2–2.4°, n=9) for Monkey Z and from 2.4° (95% CI: 2.3–2.5°, n=14) to 2.9° (95% CI: 2.8–3.1°, n=10) for Monkey Q.
We also controlled for potential auditory cues by presenting loud broad-band acoustic noise during performance of the heading task (Suppl. Methods). Both labyrinthine-intact and labyrinthectomized animals were unaffected in the presence of the acoustic noise (p>0.05), indicating that the residual performance after labyrinthectomy (Fig. 2 c, d, gray symbols) most likely arises from somatosensory cues. However, these somatosensory cues appear to allow for only crude heading discrimination. Together, the results from lesioned animals indicate that labyrinthine vestibular signals are necessary for precise heading discrimination in the absence of visual cues.
MSTd responses to translational motion
Approximately two-thirds of optic flow-sensitive neurons in MSTd also exhibit spatial tuning for inertial motion without optic flow20, 25, 26. To test whether these neurons contribute to heading perception, we recorded from single units in MSTd while monkeys A and C performed the heading discrimination task. We searched for neurons with significant vestibular tuning by presenting 10 heading directions broadly spaced throughout the horizontal plane. The animal was simply required to maintain fixation during this screening test. Figure 3a shows the heading tuning curve (black circles/lines) for an example neuron with strong vestibular tuning in the horizontal plane. This neuron responded strongly to rightward (90°), but not leftward (−90°), motion. The same cell was also significantly tuned for heading simulated by optic flow (Fig. 3a, red circles/lines), and heading preferences were matched (i.e, congruent) in the visual and vestibular conditions. This neuron was atypical in having vestibular responses that were stronger than its visual responses. Overall, 29% of MSTd neurons behaved this way (Suppl. Fig. 4, VVR < 1), with the remaining 71% being visually dominant.
Figure 3.

Visual and vestibular tuning for heading. (a) Heading tuning curves for a typical MSTd neuron with congruent visual and vestibular responses. Heading direction was varied in the horizontal plane (8 directions, 45° apart, plus two additional directions ±22.5° away from 0°). The mean firing rate (±SD) calculated during the middle 1s of the stimulus period is plotted as a function of heading direction. Black circles/lines: vestibular condition. Red circles/lines: visual condition. Gray vertical shaded area illustrates the narrow range of motion directions tested during the heading discrimination task. (b) Population vestibular and visual tuning curves, (n=256). Visual responses (red) of each neuron were shifted to align the peaks of all tuning curves (at 0°) prior to averaging across the population. Vestibular responses were averaged across neurons after being aligned either to the vestibular maximum response direction (black) or to the visual maximum response direction (blue). (c) Population vestibular and visual tuning after labyrinthectomy (n=75). Same format as in b. Gray bands in panels b and c indicate the average spontaneous firing rate ± SE. Note that visual responses were larger than spontaneous activity in all directions.
Among 428 neurons screened as in Fig. 3a, 256 (60%) showed significant heading selectivity in response to inertial motion (ANOVA, p < 0.05). By comparison, 413/428 neurons (96%) showed significant heading tuning in response to optic flow, including all 256 neurons with vestibular tuning. To summarize heading selectivity for these 256 multi-modal neurons, we computed population tuning curves (Fig. 3b). Prior to averaging firing rates across neurons, visual responses were aligned such that 0° represents the preferred visual heading of each neuron (Fig. 3b, red curve). Vestibular responses were averaged in two ways. When vestibular responses were aligned to the preferred vestibular heading of each neuron, the population average showed clear tuning (Fig. 3b, black curve). In contrast, when vestibular responses were aligned to the visual preference of each neuron, the population average was nearly flat (Fig. 3b, blue curve). This occurred because MSTd neurons tend to have visual and vestibular heading preferences that are either congruent or opposite25 (Suppl. Fig. 5).
The vestibular responses of MSTd neurons (Fig. 3b, black curve) tend to be higher than spontaneous activity in all directions of motion (anti-preferred motion does not suppress background firing). This property differs from that seen in the vestibular periphery, where neurons typically show ‘cosine tuning’ curves in which responses are both enhanced and suppressed around baseline activity2. This difference may be related to the fact that MSTd neurons have much lower spontaneous activity than peripheral neurons2.
After bilateral labyrinthectomy, MSTd neurons showed little response to vestibular stimulation30, as shown by the population tuning curves for 75 MSTd neurons recorded from monkeys Q and Z (Fig. 3c). Responses to inertial motion (black curve, aligned to vestibular preference) were not significantly different from spontaneous activity (p=0.2, Kolmogorov-Smirnov test) and were very small compared with visual responses (p≪0.001, K-S test). When vestibular responses were aligned to visual preferences (Fig. 3c, blue curve), responses did not significantly exceed spontaneous activity in any direction (p>0.9, K-S test). These data show that MSTd responses observed during inertial motion are of vestibular origin.
Comparison of neuronal and psychophysical sensitivity
MSTd cells with significant vestibular tuning were tested during the heading discrimination task, which involved probing a small heading range (gray area in Fig 3a) that was chosen for each monkey based on psychophysical performance (Methods). Responses recorded during the discrimination task are shown in Fig. 4a for the same neuron as in Fig. 3a. Heading tuning was monotonic over this narrow heading range, with stronger responses to rightward motion (positive headings) than leftward motion (negative headings). Analogous data are shown in Suppl. Fig. 6a–c for all neurons studied.
Figure 4.

Quantification and summary of neuronal sensitivity. (a) Responses (mean±SE) of the same cell as in Fig. 3a during the heading direction discrimination task, tested using a narrow range of 9 heading angles placed symmetrically around straight ahead (0°). Positive values correspond to rightward directions. (b) Response distributions for four pairs of headings (±9°, ±3.5°, ±1.3° and ±0.5°), shown separately for leftward (hatched bars) and rightward (filled bars) motion directions. (c) Proportion ‘rightward’ decisions as a function of heading direction is shown for both the psychophysical (x’s) and neuronal responses (filled circles). The latter was computed using ROC analysis. Dashed and solid curves show cumulative Gaussian fits to the psychometric and neurometric functions. Threshold performance for each function (σpsy or σneu) was computed as the standard deviation of the Gaussian fit. (d,e) Thin gray curves show individual neurometric functions for all neurons recorded from monkey A (N=126) and monkey C (N=56). Filled symbols and thick curves show average neurometric functions for the two animals.
To transform these raw data into a measure of discriminability that can be compared with behavioral performance, we analyzed the distributions of firing rates across trials. Fig. 4b shows, for the example neuron, firing rate histograms for all pairs of heading angles (±9°, ±3.5°, ±1.3° and ±0.5°). The separation between response histograms for leftward and rightward motion increases with heading angle. For ±0.5°, the two distributions are largely overlapping, whereas for ±9° the two distributions are completely non-overlapping. Thus, an observer can reliably discriminate between −9° (leftward) and +9° (rightward) headings by listening to the responses of this neuron, but this would be quite difficult for ±0.5°.
To quantify this intuition, we used signal detection theory (ROC analysis31) to compute the probability that an ideal observer could accurately report ‘rightward’ (vs. ‘leftward’) motion based on the firing rate of this single MSTd neuron (and an ‘anti-neuron’ with opposite tuning; Methods). An ROC value was computed for each pair of heading directions, and the set of these ROC values forms a ‘neurometric’ function (Fig. 4c, filled symbols) that is directly comparable to the monkey’s psychometric function (Fig. 4c, x’s). A neuronal threshold is computed from the standard deviation of the cumulative Gaussian fit. For this example neuron (one of the most sensitive), the neuronal threshold was 1.8°, close to the psychophysical threshold of 1.3° (Fig. 4c). Thus, an ideal observer could use the firing rate of this MSTd neuron to discriminate small changes in heading direction about as well as the monkey could.
Among 256 neurons with significant vestibular tuning, 182 neurons were tested with enough stimulus repetitions (≥10) to be included in this analysis. Fig. 4 d, e show neurometric functions for all 182 neurons (gray curves). The average neurometric function (Fig. 4d, e; black circles) was fit with a cumulative Gaussian (black lines), yielding thresholds of 11.7° for monkey A and 21.2° for monkey C. Fig. 5 compares the simultaneously recorded neuronal and psychophysical thresholds for all 182 neurons. All data points fall above the unity-slope diagonal line, indicating that no single MSTd neuron was more sensitive than the monkey. The most sensitive neurons had thresholds just slightly higher than the monkey’s. As a result, the neuronal to psychophysical threshold (N/P) ratios were all larger than 1 (Fig. 5, histogram), with mean values of 12.2 for monkey A and 8.9 for monkey C. These large N/P ratios were partly due to the fact that heading stimuli were not tailored to the tuning curves of individual neurons (Discussion). Neurons with the highest thresholds had tuning curves that were flat over the range of headings tested in the discrimination task (Suppl. Fig. 6). We found a strong negative correlation between neuronal threshold and the local slope of the tuning curve computed from the 3 data-points (−22.5°, 0°, 22.5°, see Fig. 3a) around straight-ahead (R=−0.39, p≪0.001). Thus, as shown previously in area MT32, the most sensitive neurons were those operating around the steep slope of their tuning curve.
Figure 5.

Comparison of psychophysical and neuronal thresholds for all individual experiments (monkey A: filled circles; monkey C: open triangles). The diagonal histogram shows the distribution of neuronal to psychophysical (N/P) threshold ratios (monkey A: filled bars; monkey C: hatched bars). Arrows illustrate mean N/P ratios for monkey A (filled arrowhead) and monkey C (open arrowhead).
Relationship between neural firing rate and behavioral choice
In addition to quantifying neuronal and behavioral sensitivity for discriminating stimulus direction, our data can also be used to investigate trial-to-trial correlation between MSTd responses and behavioral choices. For near-threshold stimuli (headings near 0°), monkeys make both ‘leftward’ and ‘rightward’ judgments in response to the identical sensory stimulus. Similarly, MSTd neurons produce varied firing rates in response to the same stimulus29 ( Fig. 4b). If MSTd activity drives heading perception (or at least reflects it), then trial-to-trial fluctuations in behavioral reports and neuronal responses should be correlated13.
To quantify the relationship between neuronal response and choice, we again used signal detection theory. However, instead of grouping neural firing rates according to heading direction as in Fig. 4b, responses were grouped according to whether the animal reported either ‘leftward’ or ‘rightward’ motion. This distinction is easiest to appreciate for the ambiguous straight-forward stimulus (0° heading), where performance was near chance (50% correct). Fig. 6a shows responses to this stimulus for the same neuron as in Figs. 3 & 4. Although the sensory stimulus was identical in each trial, the response of the neuron was generally stronger when the animal reported ‘rightward’ motion (filled bars) than when he reported ‘leftward’ motion (stippled bars). Thus, activity was stronger when the monkey made decisions in favor of the neuron’s preferred heading (which was rightward; Fig. 3a).
Figure 6.

Trial-to-trial covariation between neural activity and behavioral choices (i.e., choice probability, CP). (a) Distribution of mean firing rates of a single MSTd neuron in response to an ambiguous 0° heading stimulus, grouped according to whether the monkey reported ‘leftward’ or ‘rightward’ motion. This example neuron is the same as the cell in Fig. 3a & Fig. 4a,b. The choice-related difference between the two response distributions yielded a highly significant choice probability, CP = 0.88 (p≪0.001). (b) Summary of CPs for 178 MSTd neurons for which the ambiguous 0° heading stimulus yielded a minimum of 3 leftward and rightward choices (for 4 neurons, this was not the case because of a behavioral bias, see Methods). Filled bars represent individual CP measurements that are significantly different from 0.5 (p < 0.05, permutation test). The arrowhead illustrates the population mean. (c) Summary of grand CPs (n=182) calculated by combining data across all heading directions, following normalization. No cells were excluded in this case since the monkey made at least 3 leftward and rightward choices. (d) Choice probability is significantly anti-correlated with neuronal threshold (the solid line indicates the best linear fit and the dashed curves indicate the 95% confidence interval for the slope). Neurons with lower thresholds tend to have larger CPs. Filled symbols represent individual CP measurements that are significantly different from 0.5 (p < 0.05, permutation test). Circles: monkey A; Triangles: monkey C.
To quantify this effect, we computed an ROC metric that describes how well an ideal observer can predict the monkey’s choice based on firing rate. This metric is called a ‘choice probability’ (CP)28. For the 0° heading stimulus (Fig. 6a), the CP equals 0.88, a value that is significantly greater than chance (0.5) by permutation test (p≪0.001). A CP > 0.5 indicates that the neuron fires more strongly when the monkey makes a choice toward the cell’s heading preference. A CP < 0.5 denotes the counterintuitive situation in which the neuron fires more strongly for choices opposite to its sensory preference. Note that the example neuron in Fig. 6a showed one of the largest choice probabilities in our sample.
Fig 6b summarizes CPs for MSTd neurons tested with the ambiguous (0° heading) stimulus condition (filled bars denote individually significant effects). Overall, the distribution is clearly shifted to the right of 0.5, with a mean (0.56) that is significantly larger than 0.5 (p≪0.001, t-test). For each neuron, we also calculated CPs for the other headings tested. The mean CP across neurons was significantly larger than 0.5 at each heading tested (p<0.01), with no significant differences across headings (ANOVA, p=0.8). Thus, as shown previously28, 33, the effect of choice on firing rate was independent of the stimulus. To gain more statistical power, we calculated a ‘grand CP’ by pooling data across all headings for which the monkey made a minimum of 3 choices in each direction (Methods). Fig 6c shows the distribution of grand CPs for all MSTd neurons. About 27% of neurons (49/182) showed grand CPs significantly different from 0.5 (filled bars), and 47/49 of the significant CPs were greater than 0.5. The mean value is 0.55, which is significantly larger than chance (p≪0.001, t test). Thus, MSTd neurons generally increased their firing rates when the monkey made a choice in the direction of their sensory preference.
If significant CPs reflect a functional linkage between MSTd neurons and heading perception, then more sensitive neurons should show larger CPs. Indeed, we found that CPs were negatively correlated with neuronal thresholds (Fig. 6d; R = −0.49, p≪0.001, Spearman rank correlation). Notably, the 10 most sensitive MSTd neurons have an average CP of 0.64 (± 0.02 SE) whereas the 10 least sensitive neurons have an average CP of 0.51 (± 0.01 SE). Insensitive neurons have small CPs because their tuning curves are flat over the range of headings tested in the discrimination task. In contrast, neurons with steeply sloped tuning curves have CPs consistently larger than 0.5 (Suppl. Fig. 6 d, e). Notably, CPs were independent of the relative strength of visual and vestibular responses (Suppl. Fig. 4). These findings support the notion that perception relies most heavily on the most informative neurons28, 29, 32.
Dependence of neuronal thresholds and choice probabilities on temporal response profile
The average temporal response of MSTd neurons roughly follows the Gaussian velocity profile of the inertial motion stimulus25. Thus, ROC analyses were based on mean firing rates computed from the middle 1s of the stimulus period (Fig. 1c). To investigate whether our results depend on the exact interval used for computing firing rates, we recomputed neurometric functions and CPs for each of 11 different 1s intervals, spaced 100 ms apart, within the 2s duration of the stimulus. Fig. 7 shows average neuronal thresholds and CPs across all 182 neurons for each of the 11 analysis windows. The vertical rectangle illustrates the default analysis window used above (0.5s ~ 1.5s after stimulus onset). As expected for velocity-like responses, neuronal thresholds were lowest when the analysis window was centered near the peak stimulus velocity. Thresholds increased significantly when the analysis window was too early or too late (filled symbols with asterisks, p<0.05, paired t-test). Similarly, CPs were significantly smaller during the early and late analysis windows (open circles with asterisks) than during the middle 1s interval (open circle within rectangle, p<0.05, paired t-test). CPs were strongly and negatively correlated with neuronal thresholds across analysis windows (R= −0.92, p≪0.001, Spearman rank correlation), indicating that time windows that maximize neuronal sensitivity also tend to maximize CPs. We also examined longer analysis windows (1.5 or 2s) centered on the peak stimulus velocity, and we found that neuronal thresholds were slightly higher for these windows (p<0.001), presumably because they include more noise. In short, mean firing rates calculated from the middle 1s interval appear to best reflect neuronal performance. Similar conclusions were also reached when using a velocity or acceleration correlation metric 34 (Suppl. Fig. 7).
Figure 7.
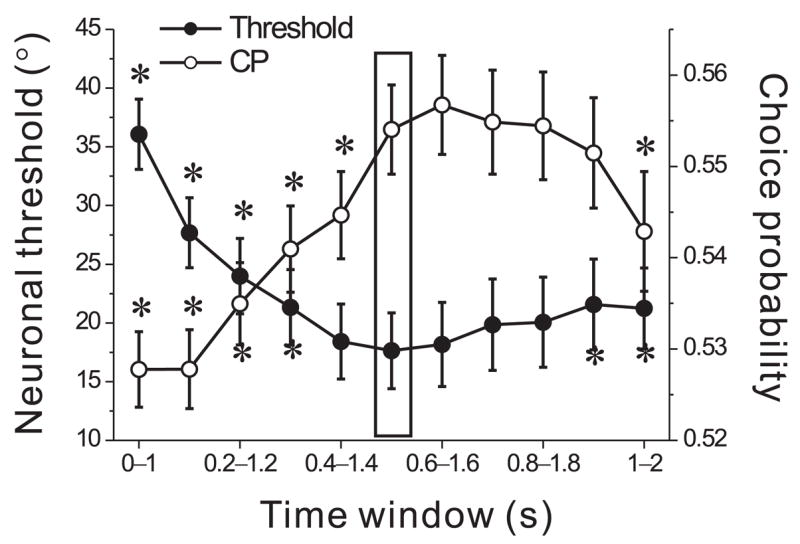
Dependence of average neuronal thresholds (filled circles) and CPs (open circles) on the temporal analysis window used to compute mean firing rates. The vertical rectangle indicates values computed from responses during the middle 1s of the 2s stimulus epoch. Each other point represents a 1s analysis window that is shifted by a multiple of 100ms. Asterisks mark the thresholds and CPs that were significantly different from those computed for the middle 1s analysis window.
Neuronal sensitivity during discrimination in darkness
In the standard version of our heading discrimination task, animals maintained fixation on a head-centered visual target during inertial motion. Thus, MSTd responses could potentially be influenced by either retinal slip of the fixation target or by smooth eye movement signals necessary to cancel the VOR during fixation. To evaluate these influences, we recorded from a subset of MSTd neurons during a variant of the task (‘dark free viewing’, Suppl. Methods) in which the animal neither established nor maintained fixation.
Figure 8 compares distributions of neuronal thresholds and CPs measured during dark free viewing and standard fixation. The geometric mean of the neuronal thresholds measured during dark free viewing (20.8°, N=26) was not significantly different from that measured during standard fixation (20.3°, N=21, unpaired t-test, p = 0.9). Across 21 neurons tested with both variants of the task (scatter plot, Fig. 8a), the two measurements were strongly correlated (r = 0.7, p ≪0.001) and the paired difference was not significant (paired t-test, p = 0.2). The fact that neuronal thresholds were not substantially elevated during dark free viewing suggests that the eye movement sensitivity of MSTd neurons does not play a major role in heading sensitivity. Moreover, the absence of retinal slip and VOR-cancellation signals did not reduce the sensitivity of MSTd neurons for heading discrimination. Similarly, the two sets of CP measurements were well correlated (Fig. 8b, r = 0.6, p = 0.01), and there was no significant difference between mean CPs measured in the two conditions (paired t-test, p = 0.8). In both task variants, the average CP was significantly larger than 0.5 (t-test, p < 0.003). We infer that the correlation of MSTd responses with perceptual decisions was driven by vestibular signals, with little contribution from retinal slip of the fixation target or smooth eye movement signals involved in VOR cancellation.
Figure 8.

Comparison of neuronal thresholds (a) and CPs (b) for neurons tested with the dark free viewing variant (n = 26) and standard fixation version (n = 21) of the heading discrimination task. The two conditions were run in separate blocks of trials starting always with the dark free viewing condition first. Thus, the scatter plots include data from the 21 neurons that were isolated long enough to be tested under both task conditions. Both thresholds (a) and CPs (b) were very similar between the two task conditions. Filled bars in (b) represent neurons with CPs significantly different from 0.5 (permutation test, p < 0.05).
DISCUSSION
We provide the first quantification of vestibular neural signals in the context of a spatial perceptual task performed around psychophysical threshold. Notably, the reported linkage between neural responses and perceptual decisions was seen in MSTd, an area conventionally considered to be visual cortex. Our results suggest that MSTd should be considered a multi-sensory area that is involved in self-motion perception based on both visual and vestibular cues.
We trained monkeys to discriminate heading based solely on inertial motion cues. Behavioral and neuronal data were similar in total darkness (Suppl. Fig. 2, Fig. 8), suggesting that neither retinal slip of the fixation target nor smooth eye movement signals related to VOR cancellation affected our measurements. Importantly, our lesion experiments show that labyrinthine vestibular signals are necessary for high sensitivity in this task. Other non-visual cues, such as somatosensory signals, do not appear sufficiently reliable to allow precise heading discrimination. Our best monkey’s behavior (threshold 1.3°) is comparable to human performance in a similar task11. This threshold is also close to that achieved by humans and monkeys when heading is discriminated based on optic flow24, 35, suggesting that vestibular signals can contribute to fine heading judgments under natural conditions (and could dominate when visual signals are degraded, as in dim light or fog).
Although the average MSTd neuron was much less sensitive than the monkey, the best neurons approached behavioral performance. Moreover, the most sensitive neurons exhibited robust correlations with perceptual decisions, whereas insensitive neurons did not. Our findings establish, at the single neuron level, the first functional linkage between vestibular neural signals and perception, and suggest that vestibular signals in area MSTd contribute to heading judgments.
Neuronal Sensitivity
The average MSTd neuron in our sample was 10-fold less sensitive than behavior. How does this compare with other studies that have simultaneously measured neuronal and psychophysical sensitivity? For coarse discrimination of visual motion and depth, average N/P ratios in areas MT and MSTd are close to unity29, 31, 36, indicating that the average neuron was as sensitive as the monkey. These studies differ from ours in two key respects. First, they involved discrimination between two widely separated directions or disparities that were corrupted by noise. Second, the stimuli were tailored to the stimulus preferences of each neuron, thus maximizing sensitivity. Two previous studies of binocular disparity sensitivity have used fine discrimination tasks similar to ours, thus removing the first distinction37, 38. In these studies, the average N/P ratio was ~2–4, suggesting that neurons are generally less sensitive than behavior in fine discrimination tasks39. However, the reference disparity in these studies was tailored to lie at the steep slope of the tuning curve (where sensitivity is near-maximal40), whereas the reference heading in our task was fixed at 0°. Thus, the lower N/P ratios in these disparity discrimination studies may be attributable largely to stimulus tailoring.
The previous study most similar to ours is that of Purushothaman and Bradley32, who studied MT neurons during a fine direction discrimination task with a fixed reference direction. They report an average N/P ratio of 26, but their neurometric functions were constructed by comparing responses for each direction to that of the reference, whereas ours were constructed by comparing positive and negative headings of the same magnitude. This difference accounts for a factor of two, and makes the two results comparable (N/P ratios of 10 vs. 13). Thus, the sensitivity of MSTd neurons in fine heading discrimination based on vestibular cues seems comparable to the sensitivity of MT neurons in fine direction discrimination based on visual motion cues.
Previous studies of vestibular responses to translation have characterized directional tuning in the horizontal plane for both afferents41 and subcortical neurons42–44. Tuning functions are cosine-like, and most studies have focused on measuring the gain and phase of responses to different directions. We are not aware of any other study that has directly measured directional discrimination thresholds for vestibularly-driven neurons. Thus, it is not clear whether MSTd neurons have high or low sensitivity relative to the vestibular periphery.
Choice probability
The average grand CP in our study was 0.55 (Fig. 5c), comparable to that reported for other sensory cortices (e.g., IT45; MT31, 32; S112). In area MSTd, Celebrini and Newsome29 measured CPs during discrimination of visual motion direction in the presence of noise. They report an average grand CP of 0.59, which is substantially larger than our value. Note, however, that Celebrini and Newsome tailored their stimuli to the tuning preferences of each neuron, whereas we did not. Given that CP was anti-correlated with neuronal threshold (Fig. 6d), our average CP was clearly reduced by neurons for which the 0° heading was not along the steep slope of the tuning curve. Large CPs were much more common among our most sensitive neurons (as shown in area MT32), consistent with the ‘lower envelope principle’13. In this scenario, signals from more sensitive neurons may be weighted more heavily by decision-making circuits, thus leading to higher CPs.
Heuer and Britten46 measured CPs in MSTd while monkeys discriminated among global patterns of optic flow (radial and circular motion) in the presence of noise. Their average CP (0.51) was not significantly larger than chance, suggesting that MSTd’s contribution to visual motion perception depends on the details of the stimuli and task. The literature does not contain choice probability data for a fine heading discrimination task based on optic flow. Preliminary results from our laboratory, as well as from Bradley and colleagues, indicate that MSTd neurons can show significant choice probabilities during fine heading discrimination based on optic flow47, 48. In addition, our preliminary data show that these visual choice probabilities are larger for neurons with congruent heading preferences for visual and vestibular inputs48.
Significant CPs are thought to reflect a functional linkage between sensory neurons and perceptual decisions. This could arise either because noise in sensory neurons drives behavior, or because ‘top-down’ signals related to choice interact with sensory neurons13. The available data do not clearly distinguish these possibilities. However, before accepting either notion, it is important to rule out less interesting possibilities. By analyzing measurements from an accelerometer, we show that significant CPs cannot be explained by trial-to-trial variations in the inertial motion stimulus itself (Suppl. Fig. 8, Suppl. Methods). We also show that significant CPs are not explained by small differences in eye position or velocity between leftward and rightward choices (Suppl. Fig. 9, Suppl. Methods). Our CPs also cannot be a simple consequence of trial-to-trial variations in the animal’s level of arousal because CP effects are seen equally for all heading directions, both preferred and non-preferred (as elaborated elsewhere33). Our results are consistent with a functional linkage between MSTd responses and perceptual decisions about heading direction from vestibular cues. Future experiments will attempt to establish this link more firmly using causal manipulations of neural activity.
Role of area MSTd in heading perception
Area MSTd has conventionally been considered a part of visual cortex, and it is clear that MSTd contributes to visual motion perception23, 24, 29. However, our findings suggest that MSTd also contributes to perception that is based solely on non-visual cues. Why might this occur in MSTd rather than other brain areas (e.g., PIVC) that have been labeled as ‘vestibular cortex’, or even in subcortical vestibular areas? We suggest that MSTd is involved in our task because it also carries information about optic flow patterns that result from self-motion, and because natural circumstances involve simultaneous presentation of both visual and inertial cues to heading. If MSTd normally integrates visual and vestibular cues for self-motion perception, it may also contribute to perception when heading is defined solely by non-visual cues. Previous studies have shown that most MSTd neurons exhibit heading tuning for both visual and vestibular inputs25–27. In addition, our preliminary findings suggest that MSTd neurons with congruent visual and vestibular heading preferences exhibit greater neuronal sensitivity when both cues are presented simultaneously48. Thus, MSTd may be a key region of sensory convergence for heading perception.
It is worth noting that our monkeys were also trained to discriminate heading defined by congruent combinations of optic flow and inertial motion (Methods). Thus, MSTd neurons might show CPs in the vestibular heading task specifically because monkeys were trained to utilize both inertial motion and optic flow cues. However, because both cues accompany self-motion under natural conditions, this training procedure may be more reflective of normal experience than training animals to judge heading from only visual or vestibular cues in isolation.
In closing, our results demonstrate that monkeys rely on labyrinthine vestibular signals to discriminate small variations in heading, and that neurons in area MSTd may have sufficient sensitivity to account for this behavior. Our findings establish, at the single-unit level, the first functional linkage between vestibular neural signals and perceptual decisions based on inertial motion. Surprisingly, this linkage is found in an area (MSTd) that is conventionally considered to be visual cortex, but we suggest that this finding is sensible given the need to integrate visual and vestibular cues to heading. This work establishes a solid foundation for exploring the roles of the vestibular system in spatial perception, and for examining how vestibular signals are combined with other sensory cues to allow us to navigate through our environment.
METHODS
Subjects and surgery
Experiments were performed on 4 male rhesus monkeys (Macaca mulatta) weighing 4–6 kg. The animals were chronically implanted with a circular molded, lightweight plastic ring for head restraint, a recording grid, and scleral coils for eye movement recording (as described previously 25). After sufficient recovery, animals were trained using standard operant conditioning to fixate visual targets for fluid reward, and to report their direction of heading as described below. In two of the animals, we recorded from single units directly after training, while the remaining two monkeys were subjected to bilateral labyrinthectomy followed by additional behavioral testing and single-unit recording49. All animal surgeries and experimental procedures were approved by the Institutional Animal Care and Use Committee at Washington University and were in accordance with National Institutes of Health guidelines.
Motion platform and heading stimuli
Translation of the monkey in the horizontal plane was accomplished using a six degree-of-freedom motion platform (MOOG 6DOF2000E; Moog, East Aurora, NY). The trajectory of inertial motion was controlled in real time at 60 Hz over an Ethernet interface. A 3-chip DLP projector (Christie Digital Mirage 2000) was mounted on top of the platform and was used to rear-project images onto a 60 × 60 cm tangent screen attached to the front of the field coil frame at a viewing distance of 30 cm (thus subtending 90 × 90° of visual angle). The sides of the coil frame were covered with a black enclosure. Visual stimuli were generated by an OpenGL accelerator board (nVidia Quadro FX 3000G). The display had a pixel resolution of 1280×1024, 32-bit color depth, and was updated at the same rate as the movement trajectory (60 Hz). Behavioral tasks and data acquisition were controlled by a commercially available software package (Reflective Computing, St. Louis, MO).
Heading Discrimination Task
Monkeys were trained, using standard operant conditioning techniques, to report their direction of translation during a 2-alternative-forced-choice heading discrimination task (Fig. 1). In each trial, the monkey was moved along one of several directions in the horizontal plane (leftward vs. rightward relative to straight ahead; Fig. 1a), while maintaining fixation on a central target (Fig. 1b). Note that the fixation point remained fixed relative to the head during motion, such that there was no changing visual stimulation during the trial. Trials were aborted if the monkey’s conjugate eye position deviated from a 2 × 2° electronic window around the fixation point.
The motion trajectory was 2s in duration and followed a Gaussian velocity profile (Fig. 1c, black curve) with a corresponding biphasic linear acceleration profile (Fig. 1c, gray curve). The total displacement along the motion trajectory was 30 cm, with a peak acceleration of ±0.1 G (±0.98 m/s2) and a peak velocity of ±45 cm/s (Fig. 1c). These accelerations far exceed vestibular detection thresholds50. Animals were trained to make a saccade to one of two targets (5° left and right of the fixation point) that appeared after termination of the motion stimulus, based on their perceived motion direction. The saccade had to be made to one of the two targets within 1 sec after their appearance, and the saccade endpoint had to remain within 3° of the target for at least 150 ms to be considered a valid choice. Correct responses were rewarded with a drop of water or juice. For the ambiguous heading condition (0°, straight ahead), rewards were delivered randomly on half of the trials. As a control, we often made use of a ‘visual’ version of the heading discrimination task in which motion direction was specified by optic flow alone while the animal remained stationary (Suppl. Methods; see also 25).
Training Procedure and Behavioral Experiments
Monkeys were initially trained to fixate a head-fixed target (0.2 × 0.2°) for 2s during platform motion. Whenever eye position left the fixation window prematurely, the trial was aborted, reward was withheld, and a brief timeout period ensued. Once animals were proficient at the fixation task, they were next trained on the heading discrimination task (Fig. 1a, b). During the initial stages of training, heading angles were large (±32°) and only a single (correct) choice target was presented on most of the trials. Over the next few weeks, the proportion of trials with two choice targets was gradually increased toward 100%. After the monkey began to perform above chance, smaller heading angles (e.g., ±16°, ±8°, etc) were gradually introduced.
To obtain a reliable estimate of each animal’s psychophysical threshold that was not biased by the range of stimulus values tested37, we initially trained each animal using a staircase procedure. To discourage choice biases, our staircase procedure incorporated stimulus probabilities that could be altered based on the recent history of the animal’s choices36. Initially, when the monkey made an incorrect choice, there was a large probability (typically about 80%) that the next trial had the same heading direction (e.g., rightward) as the previous trial. Thus, a neglected choice option would often be presented repeatedly until the monkey made a choice in that direction. Only after the monkeys were trained to a stable psychophysical threshold with minimal choice biases did we transition each animal to the “method of constant stimuli”, in which a fixed set of headings was presented in blocks of randomly interleaved trials. Subsequently, all neural recording experiments were performed with the method of constant stimuli, using a range of heading angles that was selected to bracket the animal’ psychophysical threshold.
To mimic the natural experience of self-motion, after training monkeys to discriminate heading in the absence of optic flow, we then introduced a random-dot field that provided optic flow that was congruent with the heading direction specified by platform motion25. During the heading discrimination experiments, there were 3 interleaved conditions: a vestibular condition in which there was inertial motion but no optic flow, a visual condition in which there was optic flow but no inertial motion, and combined condition25. Only neuronal discrimination data from the vestibular condition were analyzed for this study.
Electrophysiological recordings
We recorded extracellularly from single neurons in three hemispheres of two monkeys. A tungsten microelectrode (Frederick Haer Company, Bowdoinham, ME; tip diameter 3 {m, impedance 1–2 MO at 1 kHz) was advanced into the cortex through a transdural guide tube, using a micromanipulator (Frederick Haer Company) mounted on top of the Delrin ring. Single neurons were isolated using a conventional amplifier, a bandpass eight-pole filter (400–5000 Hz), and a dual voltage–time window discriminator (Bak Electronics, Mount Airy, MD). The times of occurrence of action potentials and all behavioral events were recorded with 1 ms resolution by the data acquisition computer. Eye movement traces were low-pass filtered and sampled at 250 Hz. Raw neural signals were also digitized at 25 kHz and stored to disk for off-line spike sorting and additional analyses.
Area MSTd was localized using a combination of magnetic resonance imaging (MRI) scans, stereotaxic coordinates (~15mm lateral and ~3–6mm posterior to AP-0), white/gray matter transitions, and physiological response properties, as described in detail in a previous study25. In some penetrations, electrodes were further advanced into the retinotopically-organized middle temporal area (MT). Most recordings concentrated on the posterior/medial portions of MSTd, corresponding to more eccentric, lower hemifield receptive fields in the underlying area MT25.
Experimental protocol
Once the action potential of a single MSTd neuron was isolated, we first measured its directional tuning curve to 10 different motion directions in the horizontal plane (0°, ±22.5°, ±45°, ±90°, ±135° and 180° relative to straight-ahead) under two stimulus conditions: (1) A ‘vestibular’ condition, in which the monkey was moved in the absence of optic flow. The display screen was blank, except for a head-fixed fixation target. (2) A ‘visual’ condition, where the motion platform was stationary while optic flow simulating movement through a cloud of stars was presented on the screen. Note that all stimulus directions are referenced to body motion (real or simulated), such that a neuron with similar preferred directions in the visual and vestibular conditions would be considered ‘congruent’. During both the vestibular and visual conditions, animals were required to fixate a central target (0.2º in diameter) for 200 ms before stimulus onset, and to maintain fixation throughout the trial. Each motion direction was typically repeated 5 times and mean firing rates were used to construct a heading tuning curve on-line (e.g., Fig. 3a). An analysis of variance (ANOVA) was then performed on the firing rates measured in each trial to establish whether the recorded neuron exhibited significant heading tuning. Only MSTd neurons with significant tuning in the vestibular condition (p<0.05, one-way ANOVA) were explored further using the heading discrimination task.
During recordings in the heading discrimination task, 9 logarithmically spaced headings (monkey A: ±9°, ±3.5°, ±1.3°, ±0.5° and 0°; monkey C: ±16°, ±6.4°, ±2.5°, ±1° and 0°) were presented in a block of randomly-interleaved trials. Unlike previous studies that have tailored task parameters to the preferences of each cell 31, 37, we tested all neurons from each monkey with the same set of heading directions. This ensures an unbiased comparison between neuronal and psychophysical sensitivity. The range and spacing of headings were chosen carefully for each animal to obtain near-maximal psychophysical sensitivity while allowing neural sensitivity to be reliably estimated for most neurons. On average, data were collected using 31 ± 9 (SD) repetitions of the stimulus, with more than 90% of the cells having more than 20 repetitions. If isolation was lost before completion of at least 10 repetitions, that neuron was excluded from quantitative analysis.
Data analysis
Behavioral performance was quantified by plotting the proportion of ‘rightward’ choices as a function of heading direction (angular distance of the motion direction from straight ahead). Psychometric functions were fit with a cumulative Gaussian function (Suppl. Methods). Psychophysical threshold was defined as the standard deviation of the Gaussian fit, s, which corresponds to 84% correct performance.
For the analyses of neural responses, we used mean firing rates calculated during the middle 1 s interval of each stimulus presentation (different analysis windows were also used). To characterize neuronal sensitivity, we used ROC analysis to compute the ability of an ideal observer to discriminate between two oppositely-directed headings (e.g., −9° vs. +9°, see Fig 4b) based solely on the firing rate of the recorded neuron and a presumed ‘anti-neuron’ with opposite tuning31. ROC values were plotted as a function of heading direction, resulting in neurometric functions that were also fit with a cumulative Gaussian function. Neuronal thresholds were defined as the standard deviation of these functions. Because neuronal and psychophysical thresholds were recorded simultaneously during each experimental session, the two could be directly and quantitatively compared. Thresholds changed only modestly when recomputed within a narrower heading range32 (Suppl. Methods).
To quantify the relationship between MSTd responses and the monkey’s perceptual decisions, we also computed “choice probabilities” using ROC analysis28. For each heading direction, neuronal responses were sorted into two groups based on the choice that the animal made at the end of each trial (i.e., ‘preferred’ choices versus ‘null’ choices). ROC values were calculated from these distributions, yielding a choice probability (CP) for that heading direction. A CP was computed for each heading with at least 3 choices in favor of each direction. In addition, we also computed a single “grand” CP for each neuron by combining responses across all heading directions that met this criterion. This was done by first normalizing (Z-scoring) the data for each heading and then combining them into a single pair of distributions for preferred and null choices28. ROC analysis on this pair of distributions yielded the grand CP. The statistical significance of CPs (i.e., whether they were significantly different from the chance level of 0.5) was determined using permutation tests (1000 permutations).
Supplementary Material
Acknowledgments
This work was supported by NIH EY017866 and DC04260 (to DEA) and by NIH EY016178 and the EJLB Foundation (to GCD). We would like to thank S. Newlands for performing the bilateral labyrinthectomies, K. Takahashi for collecting the neural data after labyrinthectomy, as well as A. Turner and E. White for excellent monkey care and training. We also thank S. Lisberger for helpful comments on the manuscript.
References
- 1.Fernandez C, Goldberg JM. Physiology of peripheral neurons innervating semicircular canals of the squirrel monkey. II. Response to sinusoidal stimulation and dynamics of peripheral vestibular system. J Neurophysiol. 1971;34:661–675. doi: 10.1152/jn.1971.34.4.661. [DOI] [PubMed] [Google Scholar]
- 2.Fernandez C, Goldberg JM. Physiology of peripheral neurons innervating otolith organs of the squirrel monkey. II. Directional selectivity and force-response relations. J Neurophysiol. 1976;39:985–995. doi: 10.1152/jn.1976.39.5.985. [DOI] [PubMed] [Google Scholar]
- 3.Angelaki DE, Hess BJ. Self-motion-induced eye movements: effects on visual acuity and navigation. Nat Rev Neurosci. 2005;6:966–976. doi: 10.1038/nrn1804. [DOI] [PubMed] [Google Scholar]
- 4.Raphan T, Cohen B. The vestibulo-ocular reflex in three dimensions. Exp Brain Res. 2002;145:1–27. doi: 10.1007/s00221-002-1067-z. [DOI] [PubMed] [Google Scholar]
- 5.Nashner LM. Adapting reflexes controlling the human posture. Exp Brain Res. 1976;26:59–72. doi: 10.1007/BF00235249. [DOI] [PubMed] [Google Scholar]
- 6.Goldberg JM. Afferent diversity and the organization of central vestibular pathways. Exp Brain Res. 2000;130:277–297. doi: 10.1007/s002210050033. [DOI] [PMC free article] [PubMed] [Google Scholar]
- 7.Angelaki DE. Eyes on target: what neurons must do for the vestibuloocular reflex during linear motion. J Neurophysiol. 2004;92:20–35. doi: 10.1152/jn.00047.2004. [DOI] [PubMed] [Google Scholar]
- 8.Harris LR, Jenkin M, Zikovitz DC. Visual and non-visual cues in the perception of linear self-motion. Exp Brain Res. 2000;135:12–21. doi: 10.1007/s002210000504. [DOI] [PubMed] [Google Scholar]
- 9.Ohmi M. Egocentric perception through interaction among many sensory systems. Brain Res Cogn Brain Res. 1996;5:87–96. doi: 10.1016/s0926-6410(96)00044-4. [DOI] [PubMed] [Google Scholar]
- 10.Telford L, Howard IP, Ohmi M. Heading judgments during active and passive self-motion. Exp Brain Res. 1995;104:502–510. doi: 10.1007/BF00231984. [DOI] [PubMed] [Google Scholar]
- 11.Smith ST, Bush GA, Stone LS. Amplitude Response of Human Vestibular Heading Estimation. Soc Neurosci. 2002:Abstr. 56.1. [Google Scholar]
- 12.Luna R, Hernandez A, Brody CD, Romo R. Neural codes for perceptual discrimination in primary somatosensory cortex. Nat Neurosci. 2005;8:1210–1219. doi: 10.1038/nn1513. [DOI] [PubMed] [Google Scholar]
- 13.Parker AJ, Newsome WT. Sense and the single neuron: probing the physiology of perception. Annu Rev Neurosci. 1998;21:227–277. doi: 10.1146/annurev.neuro.21.1.227. [DOI] [PubMed] [Google Scholar]
- 14.Grusser OJ, Pause M, Schreiter U. Localization and responses of neurones in the parieto-insular vestibular cortex of awake monkeys (Macaca fascicularis) J Physiol. 1990;430:537–557. doi: 10.1113/jphysiol.1990.sp018306. [DOI] [PMC free article] [PubMed] [Google Scholar]
- 15.Fukushima K. Corticovestibular interactions: anatomy, electrophysiology, and functional considerations. Exp Brain Res. 1997;117:1–16. doi: 10.1007/pl00005786. [DOI] [PubMed] [Google Scholar]
- 16.Tanaka K, Saito H. Analysis of motion of the visual field by direction, expansion/contraction, and rotation cells clustered in the dorsal part of the medial superior temporal area of the macaque monkey. J Neurophysiol. 1989;62:626–641. doi: 10.1152/jn.1989.62.3.626. [DOI] [PubMed] [Google Scholar]
- 17.Duffy CJ, Wurtz RH. Sensitivity of MST neurons to optic flow stimuli. I. A continuum of response selectivity to large-field stimuli. J Neurophysiol. 1991;65:1329–1345. doi: 10.1152/jn.1991.65.6.1329. [DOI] [PubMed] [Google Scholar]
- 18.Komatsu H, Wurtz RH. Relation of cortical areas MT and MST to pursuit eye movements. I. Localization and visual properties of neurons. J Neurophysiol. 1988;60:580–603. doi: 10.1152/jn.1988.60.2.580. [DOI] [PubMed] [Google Scholar]
- 19.Ben Hamed S, Page W, Duffy C, Pouget A. MSTd neuronal basis functions for the population encoding of heading direction. J Neurophysiol. 2003;90:549–558. doi: 10.1152/jn.00639.2002. [DOI] [PubMed] [Google Scholar]
- 20.Page WK, Duffy CJ. Heading representation in MST: sensory interactions and population encoding. J Neurophysiol. 2003;89:1994–2013. doi: 10.1152/jn.00493.2002. [DOI] [PubMed] [Google Scholar]
- 21.Perrone JA, Stone LS. A model of self-motion estimation within primate extrastriate visual cortex. Vision Res. 1994;34:2917–2938. doi: 10.1016/0042-6989(94)90060-4. [DOI] [PubMed] [Google Scholar]
- 22.Lappe M, Bremmer F, Pekel M, Thiele A, Hoffmann KP. Optic flow processing in monkey STS: a theoretical and experimental approach. J Neurosci. 1996;16:6265–6285. doi: 10.1523/JNEUROSCI.16-19-06265.1996. [DOI] [PMC free article] [PubMed] [Google Scholar]
- 23.Britten KH, van Wezel RJ. Electrical microstimulation of cortical area MST biases heading perception in monkeys. Nat Neurosci. 1998;1:59–63. doi: 10.1038/259. [DOI] [PubMed] [Google Scholar]
- 24.Britten KH, Van Wezel RJ. Area MST and heading perception in macaque monkeys. Cereb Cortex. 2002;12:692–701. doi: 10.1093/cercor/12.7.692. [DOI] [PubMed] [Google Scholar]
- 25.Gu Y, Watkins PV, Angelaki DE, DeAngelis GC. Visual and nonvisual contributions to three-dimensional heading selectivity in the medial superior temporal area. J Neurosci. 2006;26:73–85. doi: 10.1523/JNEUROSCI.2356-05.2006. [DOI] [PMC free article] [PubMed] [Google Scholar]
- 26.Duffy CJ. MST neurons respond to optic flow and translational movement. J Neurophysiol. 1998;80:1816–1827. doi: 10.1152/jn.1998.80.4.1816. [DOI] [PubMed] [Google Scholar]
- 27.Bremmer F, Kubischik M, Pekel M, Lappe M, Hoffmann KP. Linear vestibular self-motion signals in monkey medial superior temporal area. Ann N Y Acad Sci. 1999;871:272–281. doi: 10.1111/j.1749-6632.1999.tb09191.x. [DOI] [PubMed] [Google Scholar]
- 28.Britten KH, Newsome WT, Shadlen MN, Celebrini S, Movshon JA. A relationship between behavioral choice and the visual responses of neurons in macaque MT. Vis Neurosci. 1996;13:87–100. doi: 10.1017/s095252380000715x. [DOI] [PubMed] [Google Scholar]
- 29.Celebrini S, Newsome WT. Neuronal and psychophysical sensitivity to motion signals in extrastriate area MST of the macaque monkey. J Neurosci. 1994;14:4109–4124. doi: 10.1523/JNEUROSCI.14-07-04109.1994. [DOI] [PMC free article] [PubMed] [Google Scholar]
- 30.Takahashi K, Gu Y, Newlands SD, DeAngelis GC, Angelaki DE. Visual-vestibular signal convergence in area MSTd during rotation and translation. Soc Neurosci. 2006:Abstr 437.13. [Google Scholar]
- 31.Britten KH, Shadlen MN, Newsome WT, Movshon JA. The analysis of visual motion: a comparison of neuronal and psychophysical performance. J Neurosci. 1992;12:4745–4765. doi: 10.1523/JNEUROSCI.12-12-04745.1992. [DOI] [PMC free article] [PubMed] [Google Scholar]
- 32.Purushothaman G, Bradley DC. Neural population code for fine perceptual decisions in area MT. Nat Neurosci. 2005;8:99–106. doi: 10.1038/nn1373. [DOI] [PubMed] [Google Scholar]
- 33.Uka T, DeAngelis GC. Contribution of area MT to stereoscopic depth perception: choice-related response modulations reflect task strategy. Neuron. 2004;42:297–310. doi: 10.1016/s0896-6273(04)00186-2. [DOI] [PubMed] [Google Scholar]
- 34.Karunaratne AD, et al. Response dynamics of MSTd neurons during inertial motion. Soc Neurosci. 2006:Abstr. 437.14/G8. [Google Scholar]
- 35.Lappe M, Bremmer F, van den Berg AV. Perception of self-motion from visual flow. Trends Cogn Sci. 1999;3:329–336. doi: 10.1016/s1364-6613(99)01364-9. [DOI] [PubMed] [Google Scholar]
- 36.Uka T, DeAngelis GC. Contribution of middle temporal area to coarse depth discrimination: comparison of neuronal and psychophysical sensitivity. J Neurosci. 2003;23:3515–3530. doi: 10.1523/JNEUROSCI.23-08-03515.2003. [DOI] [PMC free article] [PubMed] [Google Scholar]
- 37.Prince SJ, Pointon AD, Cumming BG, Parker AJ. The precision of single neuron responses in cortical area V1 during stereoscopic depth judgments. J Neurosci. 2000;20:3387–3400. doi: 10.1523/JNEUROSCI.20-09-03387.2000. [DOI] [PMC free article] [PubMed] [Google Scholar]
- 38.Uka T, DeAngelis GC. Linking neural representation to function in stereoscopic depth perception: roles of the middle temporal area in coarse versus fine disparity discrimination. J Neurosci. 2006;26:6791–6802. doi: 10.1523/JNEUROSCI.5435-05.2006. [DOI] [PMC free article] [PubMed] [Google Scholar]
- 39.Osborne LC, Bialek W, Lisberger SG. Time course of information about motion direction in visual area MT of macaque monkeys. J Neurosci. 2004;24:3210–3222. doi: 10.1523/JNEUROSCI.5305-03.2004. [DOI] [PMC free article] [PubMed] [Google Scholar]
- 40.Seung HS, Sompolinsky H. Simple models for reading neuronal population codes. Proc Natl Acad Sci U S A. 1993;90:10749–10753. doi: 10.1073/pnas.90.22.10749. [DOI] [PMC free article] [PubMed] [Google Scholar]
- 41.Fernandez C, Goldberg JM. Physiology of peripheral neurons innervating otolith organs of the squirrel monkey. I. Response to static tilts and to long-duration centrifugal force. J Neurophysiol. 1976;39:970–984. doi: 10.1152/jn.1976.39.5.970. [DOI] [PubMed] [Google Scholar]
- 42.Chen-Huang C, Peterson BW. Three dimensional spatial-temporal convergence of otolith related signals in vestibular only neurons in squirrel monkeys. Exp Brain Res. 2006;168:410–426. doi: 10.1007/s00221-005-0098-7. [DOI] [PubMed] [Google Scholar]
- 43.Shaikh AG, Ghasia FF, Dickman JD, Angelaki DE. Properties of cerebellar fastigial neurons during translation, rotation, and eye movements. J Neurophysiol. 2005;93:853–863. doi: 10.1152/jn.00879.2004. [DOI] [PubMed] [Google Scholar]
- 44.Angelaki DE, Dickman JD. Spatiotemporal processing of linear acceleration: primary afferent and central vestibular neuron responses. J Neurophysiol. 2000;84:2113–2132. doi: 10.1152/jn.2000.84.4.2113. [DOI] [PubMed] [Google Scholar]
- 45.Uka T, Tanabe S, Watanabe M, Fujita I. Neural correlates of fine depth discrimination in monkey inferior temporal cortex. J Neurosci. 2005;25:10796–10802. doi: 10.1523/JNEUROSCI.1637-05.2005. [DOI] [PMC free article] [PubMed] [Google Scholar]
- 46.Heuer HW, Britten KH. Optic flow signals in extrastriate area MST: comparison of perceptual and neuronal sensitivity. J Neurophysiol. 2004;91:1314–1326. doi: 10.1152/jn.00637.2003. [DOI] [PubMed] [Google Scholar]
- 47.Xu HPW, Bradley DC. Neural basis of heading discrimination in macaque area MSTd. Soc Neurosci. 2006:Abstr 306.7. [Google Scholar]
- 48.Gu Y, Angelaki DE, DeAngelis GC. Role of area MSTd in cue integration for heading discrimination: I. Comparison of neuronal and psychophysical sensitivity to visual and vestibular cues. J Vision. 2006;6:409a. http://journalofvision.org/406/406/409/ doi: 410.1167/1166.1166.1409.
- 49.Newlands SD, Hesse SV, Haque A, Angelaki DE. Head unrestrained horizontal gaze shifts after unilateral labyrinthectomy in the rhesus monkey. Exp Brain Res. 2001;140:25–33. doi: 10.1007/s002210100810. [DOI] [PubMed] [Google Scholar]
- 50.Guedry FJ. In: Handbook of Sensory physiology-vestibular system-psychophysics, Applied Aspects and General Interpretations. Guedry FE Jr, editor. part 2. Berlin: Springer-Verlag; 1974. pp. 1–154. [Google Scholar]
Associated Data
This section collects any data citations, data availability statements, or supplementary materials included in this article.