

Abstract
Using the human WERI-Rb1 cell line as a model system, we performed a genome-wide search for retinal target genes of thyroid hormone (TH) via expression microarray analysis followed by quantitative real-time RT-PCR verification. We identified 12 novel retinal targets of TH, including 10 up-regulated genes (OPN1MW, OPN1LW, TIMP3, RP1L1, GNGT2, CRX, ARR3, GCAP1, IMPDH1, and PDE6C) and 2 down-regulated genes (GNGT1 and GNB3). In addition, we found a number of novel TH targets that are not currently known to be retinal genes. This is the first report of human retinal targets regulated by thyroid hormone.
Keywords: thyroid hormone, target gene, microarray, retina, photoreceptor
INTRODUCTION
Thyroid hormone (TH) action is known to direct the development and function of many tissues, especially the brain, liver and heart (reviewed in (Yen 2001; Viguerie and Langin 2003)). Recent studies in mice have revealed that TH and its β2 receptor (TRβ2) also play a pivotal role in retinal development. A dorsal-ventral gradient of TH is established in developing mouse retina around postnatal day 10, correlating with the spatial and temporal distribution of the middle-wave-sensitive (M) cone opsin expression (Roberts et al. 2006). In addition, TRβ2 expression is restricted to cone photoreceptors in mouse retina (Roberts et al. 2005) and more importantly, deletion of the gene encoding for TRβ2 in mice results in complete loss of M cones (Ng et al. 2001). These results indicate that TH action is essential for M cone development and differentiation, possibly via regulation of M cone opsin expression, as well as other cone-specific genes.
Different from rodents, which are dichromatic with only M and S (short-wave-sensitive) cones, humans are trichromatic with L (long-wave-sensitive), M, and S (short-wave-sensitive) cones in the retina. The human L and M cone opsin genes (OPN1LW and OPN1MW, respectively) are located on the X chromosome and are arranged in a head-to-tail tandem array (reviewed in (Deeb 2004)). These two opsins are highly homologous with only 15 out of 364 amino acids being different. In fact, the L-opsin gene is derived from the M-opsin gene via a duplication event that occurred during evolution and includes both the coding and promoter regions. Furthermore, a regulatory sequence upstream of the L-opsin gene, called the locus control region (LCR), can control the expression of both L- and M-opsin genes (Wang et al. 1992). Interestingly, while these two genes have almost identical promoter sequence, their expression in human retina is mutually exclusive. Despite all that is known about these genes, the mechanism of regulation of L- and M-opsin gene expression remains largely unknown.
Several lines of evidence suggest that the role of TH and its receptor in mouse retina is similar in the human system. In 1977, a case report from Germany showed that a deletion in the human TRβ gene in a patient was associated with S cone monochromacy, indicating that both the L and M cones were missing (Newell, 1977 #170). In addition, transgenic mice bearing a reporter construct driven by the upstream regulatory sequence of the human L/M locus showed a similar expression pattern to that seen with the endogenous mouse M-opsin (Wang et al. 1992; Fei and Hughes 2001). These data strongly support the hypothesis that expression of both human L and M cone opsins is regulated by TH and its receptors during retinal development.
To test whether thyroid hormone regulates the transcription of human L- and M-opsin genes, we took advantage of a human retinoblastoma cell line WERI-Rb1 (hereafter referred as WERI). WERI is an early stage cone lineage cell line, expressing low levels of L- and M-opsin (Shaaban and Deeb 1998). Previously, we had found that these cells express L- and M- opsin in a mutually exclusive pattern, similar to the human retina and the choice of expressing L- or M-opsin can be reset during cell division (Deeb 2006). In this paper, we showed that WERI cells are also ideal for investigation of TH action on human retinal genes. Using WERI as a model system we determined by expression microarray and quantitative real-time RT-PCR (qRT-PCR) analyses that the L- and M-opsin genes are transcriptional targets of thyroid hormone. In addition, a number of other novel TH-targets were also identified.
METHODS
Cell Culture
The human retinoblastoma cell line WERI-Rb1 (WERI) was obtained from the American Type Culture Collection and maintained as a suspension culture in RPMI 1640 supplemented with L-glutamine and 10% fetal bovine serum (Hyclone). For experiments with thyroid hormone treatment, WERI cells were shifted 2 or 3 days before the treatment to medium with 2% B27, a defined serum-free substitute (Invitrogen) instead of fetal bovine serum. The triiodothyronine (T3) stock solution was prepared in 1N NaOH at a concentration of 100 uM. All-trans retinoic acid (ATRA) and 9-cis retinoic acid stock solutions were prepared in DMSO at a 10 mM concentration. All chemicals were obtained from Sigma.
RNA Extraction, RT- PCR and qRT-PCR
Total RNA was extracted from WERI cells using either the Versagene RNA extraction kit (Gentra Systems) or Trizol reagent (Invitrogen) and reverse transcribed (RT) using iScript cDNA synthesis kit (Biorad) in a 10 or 20 ul reaction. cDNA samples from the RT reactions were used as templates for PCR amplification using LA-taq polymerase (TAKARA). The sequence of the isoform-specific primers for human TRα1, TRα2, TRβ1and TRβ2 are given in Malo et al (Malo et al. 2004). Primer sequences for PCR gel analysis and SYBR Green-based quantitative PCR (qPCR) are listed in Table 1. Taqman-based qPCR assays were purchased from Applied Biosystems (ABI) and are listed as follows: APOE (Hs00171168_m1), ARR3 (Hs00182888_m1), CRX (Hs00230899_m1), CRYM (Hs00157121_m1), CST11 (Hs00370023_m1), DELGEF (Hs00183730_m1), DPP4 (Hs00175210_m1), GAPDH (Hs99999905_m1), GNB3 (Hs00157740_m1), GNGT1 (Hs00184207_m1), GNGT2 (Hs00258864_m1), GCAP1 (Hs00181172_m1), HEG1 (Hs00419997_m1), HR (Hs00218222_m1), IMPDH1 (Hs00265302_m1), LIPG (Hs00195812_m1), LMOD1 (Hs00201704_m1), OPN1LW/OPN1MW (Hs00241039_m1), PDE6C (Hs00196421_m1), PDE6H (Hs00196432_m1), PYY (Hs00373890_g1), RP1L1 (Hs00698865_m1), RRAD (Hs00188163_m1), SAG (Hs00167021_m1), SALL1 (Hs00231307_m1), TIMP3 (Hs00165949_m1).
Table 1.
Primers used for RT-PCR and SYBR-based qRT-PCR analyses
| Methods | Gene Symbol | Primer | Sequence (5’ to 3’) | Cycling Condition |
|---|---|---|---|---|
| Gel analysis | GAPDH | GAPDH1F | CGCTGAGTACGTCGTGGAGTC | 95°C 15 s and 64°C 50s(25 cycles) |
| GAPDH1R | CACAGTCTTCTGGGTGGCAGT | |||
| RXRA | hRXRα-F | CAT CTT TGA CAG GGT GCT GAC | 95°C 15 s, 62°C 30s, 72°C 40s (35 cycles) | |
| hRXRα-R | TGC TCT GGG TAC TTG TGC TTG | |||
| RXRB | hRXRβ-F | GAG TAG GAG CCA TCT TTG ATC G | ||
| hRXRβ-R | TAG CAG CAG CTT GGC AAA CCG | |||
| RXRG | hRXRγ-F | GGT CGG CTC CAT CTT TGA CAG | ||
| hRXRγ-R | TTG GCA AAC CTG CCT GGC TG | |||
| L/M opsin | CB196 | TACCCCGGGGTGCAGTCTTAC | 98°C 10 s and 66°C 30 s (30 cycles) | |
| CB78 | TTGGCAGCAGCAAAGCATGCG | |||
| SYBR-qPCR | M-opsin (OPN1MW) | CB7G | ACCCCACTCAGCATCATCGT | 95°C 15 s and 62°C 40 s (40 cycles) |
| CB79G | CCAGCAGAAGCAGAATGCCAGGAC | |||
| L-opsin (OPN1LW) | CB7R | ATCCCACTCGCTATCATCAT | ||
| CB79R | CCAGCAGACGCAGTACGCAAAGATC | |||
| GMPR | GMPR-F1 | CGTGTTCAGCTAACCCTGGGGAC | 95°C 15 s and 65°C 40s (40 cycles) | |
| GMPR-R1 | ACCATTCAGGAGCAGCCAGAAGC | |||
| ITM2C | ITM2C-F1 | AAGCAAGGAGCTAGGACCCCCAG | ||
| ITM2C-R1 | GACTGAGCAGTGACCTTGCCTGC | |||
| KIAA1755 | KIAA1755-F1 | TCATTGTGGAAAGACCTGTCGGC | ||
| KIAA1755-R1 | ACCCGAGGGGAGAGCTGTGTATG | |||
| MARCO | MARCO-F1 | GGGACAATTTGCGATGACGAGTG | ||
| MARCO-R1 | CCAGCTCCCACTTTGTACAGGGC | |||
| PAMLM2-AKAP2 | PALM2-AKAP2-F1 | TGCATTCTGCCGTGTTTATAGGTG | ||
| PALM2-AKAP2-R1 | TGCCACTGACAGACCCTGTTTCC | |||
| RARI14 | RAI14-F1 | ACGCTTGCAACTTCCCTTATGGC | ||
| RAI14-R1 | ACTGAGGCCAAGCAGCCTTGTG | |||
| SPON2 | SPON2-F1 | CTGCTCTCAGCCTCCTCCTCCTG | ||
| SPON2-R1 | CCCCTGGACGATGAAGGACAATC | |||
| TFF1 | TFF1-F1 | TCGACGTCCCTCCAGAAGAGGAG | ||
| TFF1-R1 | GCAGAAGCGTGTCTGAGGTGTCC | |||
| THEDC1 | THEDC1-F1 | GTACATTCAAAGGCCTGGCATCG | ||
| THEDC1-R1 | CTTCAGCAAAATGCTTGGGGGTG | |||
| TP53I3 | TP53I3-F1 | AGGCAAGATCGTCCTGGAACTGC | ||
| TP53I3-R1 | TAAACGGCTCTGGAGGAAGCACC | |||
| TRA@ | TRA@-F1 | CTCGAACCGAACAGCAGTGCTTC | ||
| TRA@-R1 | TCTCTCAGCTGGTACACGGCAGG | |||
| TU3A | TU3A-F1 | TGGTGTGAGGACCATGCTGTGAG | ||
| TU3A-R1 | GTTGCAGAAGTGGGGTGGGAATC |
All qPCR analyses were performed using the Applied Biosystems 7500 apparatus and analyzed by the Relative Quantification ddCt method. SYBR Green-based qPCR reactions were performed using Power SYBR Green Master Mix (ABI). Taqman probe-based qPCR reactions were performed using Taqman Universal Master Mix (ABI). The cycling parameters for SYBR-qPCR analysis are listed in Table 1 with an additional dissociation step to monitor the specificities of amplified products. For Taqman-qPCR, we use the default cycling conditions (40 cycles of 95°C 15 seconds and 60°C 1 minute).
Microarray Analysis
WERI cells were treated in triplicates for 48 hours with either 100 nM T3 or solvent (0.001N NaOH) and harvested for RNA extraction. The array experiment was performed by the Center of Expression Arrays at the University of Washington (http://expression.washington.edu/). Briefly, each sample with 5 ug RNA was reverse transcribed, biotin-labeled by in vitro transcription, and then hybridized to human whole genome U133 plus 2.0 oligonucleotide chips (Affymetrix) following the Affymetrix recommended procedures. The chips were stained with streptavidin-phycoerythrin and scanned using the GeneChip Scanner (Affymetrix). The data files were then analyzed by ArrayAssist software (Stratagene) and lists of differentially expressed genes (fold-change ≥ 2, p-value ≤ 0.05 or fold-change ≥ 4, p-value ≤ 0.01) were generated using the PLIER probe level analysis algorithm (Affymatrix) and two-sample Student’s t-test. Selected target genes identified by microarray were verified by Taqman-based qRT-PCR assays as described above.
RESULTS
WERI cell line as a model system to examine T3 action on human retinal genes
To date, no studies of human retinal genes regulated by T3 have been reported, most likely due to the limitation on available human retinal tissues. An alternative approach is to use cell lines for such a study. Human WERI retinoblastoma cells have been shown to express the thyroid hormone receptors (TR) and many retinal-specific genes (Li et al. 2003). Since TRs include different isoforms and form heterodimers with members of the retinoid X receptor (RXR) family to mediate T3 action, we first examined which isoforms of TR and RXR are present in WERI cells. RT-PCR analysis was performed using isoform-specific primers (Malo et al. 2004). As shown in Figure 1, WERI cells express all four TR isoforms: TRα1, TRα2, TRβ1 and TRβ2, with TRβ2 being at the highest concentration. Interestingly, we found that the TRβ1 PCR product was smaller (about 350bp) than previously reported (484bp) (Malo et al. 2004). Sequence analysis of this smaller TRβ1 product indicated that it matches the TRβ1 sequence, but is missing exons 2 and 3 for a total loss of 136 nucleotides. In addition, WERI cells express all three RXR isoforms. RXRγ is expressed at the highest level among the RXR isoforms (Figure 1). These results suggest that TRβ2/RXRγ heterodimers are likely the predominant form of thyroid hormone receptor complexes in WERI cells.
Figure 1. WERI cells express high levels of TRβ2 and RXRγ.

RNA extracted from WERI cells was used to perform RT-PCR analysis using isoform-specific primers as described in Table 1. The predicted product size for TRα1 = 346 bp, TRα2 = 467 bp, TRβ1= 484 bp, TRβ2 = 307 bp, RXRα = 201 bp, RXRβ = 239 bp, RXRγ = 228 bp. * = TRβ1 PCR product size is smaller than predicted (484 bp). See text for explanation.
Expression of the L/M opsin mRNA has been shown to be up-regulated by retinoic acid in WERI cells (Li et al. 2003). We tested whether its expression is also regulated by T3. RNA extracted from WERI cells treated with either T3 or retinoic acid (ATRA or 9-cis RA) were used to perform RT-PCR analysis to compare the expression of L/M opsin mRNA with that of COUPTF1, a known RA-responsive gene (Li et al. 2003). We need to point out here that due to the high homology between the L- and M-opsin genes, many studies do not distinguish between these two genes. In this paper, we consider the L- and M- opsin genes as one unit when the assay amplifies the mRNA of both genes (shown as L/M, or OPN1LW/OPN1MW), but as two units when the assay specifically amplifies the mRNA of either L or M opsin gene. As shown in Figure 2, the L/M opsin mRNA was dramatically induced by T3 (10 nM) in WERI cells, but only weakly activated by ATRA or 9-cis RA (Figure 2, top panel). In contrast, the expression level of COUPTF1 was highly induced by ATRA or 9-cis RA, but not by T3 (Figure 2, middle panel). On the other hand, the house keeping gene, GAPDH, was expressed at similar levels among all the samples (Figure 2, bottom panel). These results indicate that WERI cells are T3-responsive and suitable for identification of retinal targets of thyroid hormone.
Figure 2. T3 induces the transcription of the L/M opsin gene in WERI cells.
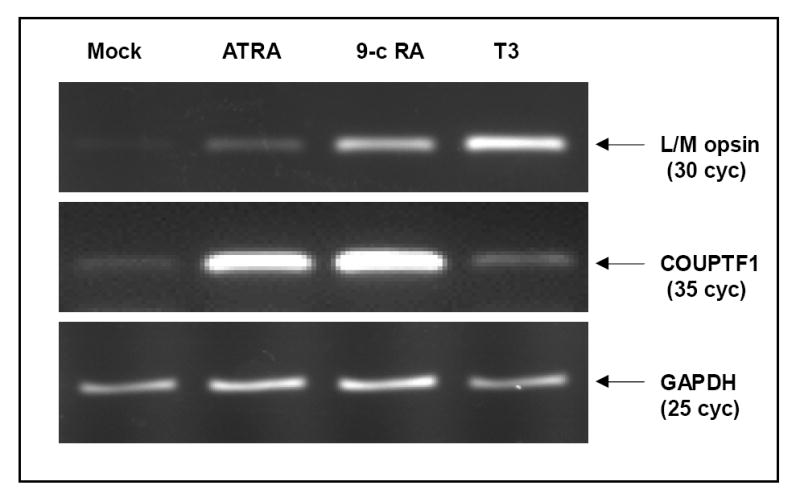
WERI cells were either treated with vehicle (mock), 10 uM all-trans retinoic acid (ATRA), 10 uM 9-cis retinoic acid (9c-RA), or 10 nM T3 (T3) for 48 hours. RNA extracted from these samples was used to perform RT-PCR analyses using primer pairs that amplify the L/M opsin gene (top panel), COUPTF1 (middle panel), or the housekeeping gene GAPDH (bottom panel).
Identification of TH-targets in WERI cells by expression microarray analysis
To systematically identify target genes of TH in WERI cells, we performed a genome-wide search using expression microarray analysis. To ensure robust signals, we chose to treat WERI cells with 100 nM T3. Although this dose is much higher than physiological concentration (around 1 nM), no toxic effects on WERI cells were observed. The Affymetrix U133+2.0 chip used for the microarray analysis contains approximately 54K probe sets representing about 38,000 genes, including all known retinal-specific genes. Three biological replicates were used for statistical analysis. After 48 hours of T3 treatment, WERI cells were harvested for RNA extraction. The quality of the RNA samples was tested by an Agilent Bioanalyzer. Induction of L/M opsin in T3 treated samples was examined by RT-PCR analysis to assure that the T3 treatment worked well (data not shown). Six samples of RNA (3 mock treated, 3 treated with 100 nM T3) were then labeled and hybridized to U133+2.0 chips. The raw data generated were analyzed by the ArrayAssist software (Stratagene) using the PLIER algorithm for probe level analysis and a two-sample Student’s t-test for the determination of statistically significant changes in mRNA concentrations. As shown in Figure 3A and 3C, T3 treatment induces a global gene expression profile change in WERI cells with minimal variation between the three biological replicates. From a total of 54,675 probe sets (some genes contain multiple probe sets on the chip) tested, we found that 534 probe sets showed up-regulation of 2 fold or more (p-value ≤0.05) and 479 probe sets showed down-regulation of 2 fold or more (p-value ≤0.05). A total of 97 probe sets, representing 69 genes, were induced 4 fold or more with a p-value of ≤ 0.01 (Figure 3B, Table 2), and 61 probe sets, representing 50 genes, were down-regulated 4 fold or more with a p-value of ≤ 0.01 (Figure 3B, Table 3). The complete list of differentially expressed genes with ≥2 fold, p-value ≤0.05 can be found in the Supplementary Material.
Figure 3. Microarray Expression profile of WERI cells treated with T3.

(A). Scatter plot of hybridization signals of RNA from WERI cells treated with 100 nM T3 (TH, Y-axis) versus signals from a mock treated sample (Mock). Up-regulated transcripts are indicated by red + sign; down-regulated transcripts are indicated by green + sign; yellow + sign indicate transcripts with similar expression levels in the TH and Mock samples. (B). Scatter plot of p values (Y-axis) versus fold change (X-axis, log2 scale). The red + sign on the bottom left are transcripts down regulated by 4 fold or more with p value of ≤0.01 ; red + signs on the bottom right represent transcripts that are up-regulated by 4 fold or more with p values of ≤0.01. (C). Heatmap of probe sets on ±4 fold, p≤0.01 list generated by cluster analysis. Note the three biological replicates show similar levels of expression.
Table 2.
T3-induced genes in WERI cells (fold-change ≥ 4, p-value ≤0.01)
| Rank | Gene Symbol | UniGene ID | Gene Name | Fold |
|---|---|---|---|---|
| 1 | OPN1MW | Hs.247787 | cone opsin, medium-wave-sensitive | 44.68 |
| OPN1LW | Hs.592247 | cone opsin, long-wave-sensitive | ||
| 2 | LMOD1*** | Hs.519075 | leiomodin 1 (smooth muscle) | 24.46 |
| 3 | PALM2-AKAP2 | Hs.591908 | PALM2-AKAP2 protein | 12.75 |
| 4 | KIAA1755 | Hs.472690 | KIAA1755 protein | 12.33 |
| 5 | Unknown | Hs.26039 | Homo sapiens, clone IMAGE:3869276, | 12.00 |
| 6 | DPP4** | Hs.368912 | dipeptidylpeptidase 4 (CD26, adenosine deaminase complexing protein 2) | 10.68 |
| 7 | CST11 | Hs.128100 | cystatin 11 | 10.60 |
| 8 | TRA@** | Hs.74647 | T cell receptor alpha locus | 9.85 |
| 9 | TP53I3 | Hs.50649 | tumor protein p53 inducible protein 3 | 9.64 |
| 10 | TU3A | Hs.506357 | TU3A protein | 9.15 |
| 11 | RAI14 | Hs.431400 | retinoic acid induced 14 | 8.93 |
| 12 | MARCO | Hs.67726 | macrophage receptor with collagenous structure | 8.83 |
| 13 | THEDC1 | Hs.24309 | thioesterase domain containing 1 | 8.68 |
| 14 | ITM2C | Hs.111577 | integral membrane protein 2C | 8.19 |
| 15 | PYY | Hs.169249 | peptide YY | 8.06 |
| 16 | SPON2 | Hs.302963 | spondin 2, extracellular matrix protein | 7.94 |
| 17 | TFF1 | Hs.162807 | trefoil factor 1 (breast cancer, estrogen-inducible sequence expressed in) | 7.77 |
| 18 | GMPR | Hs.484741 | guanosine monophosphate reductase | 7.69 |
| 19 | RRAD** | Hs.1027 | Ras-related associated with diabetes | 7.57 |
| 20 | TMEM35 | Hs.45140 | transmembrane protein 35 | 7.50 |
| 21 | HR | Hs.272367 | hairless homolog (mouse) | 7.49 |
| 22 | FNDC5 | Hs.524234 | fibronectin type III domain containing 5 | 7.24 |
| 23 | MAP2 | Hs.368281 | Microtubule-associated protein 2 | 6.90 |
| 24 | PSCD1 | Hs.191215 | pleckstrin homology, Sec7 and coiled-coil domains 1(cytohesin 1) | 6.84 |
| 25 | FHOD3 | Hs.436636 | formin homology 2 domain containing 3 | 6.77 |
| 26 | RUTBC2 | Hs.474397 | RUN and TBC1 domain containing 2 | 6.75 |
| 27 | JUP | Hs.514174 | junction plakoglobin | 6.67 |
| 28 | HEG*** | Hs.477420 | HEG homolog 1 (zebrafish) | 6.57 |
| 29 | TXNIP*** | Hs.533977 | thioredoxin interacting protein | 6.45 |
| 30 | Unknown | Hs.436603 | Transcribed locus | 6.39 |
| 31 | APOE*** | Hs.110675 | Apolipoprotein E | 6.06 |
| 32 | CD52** | Hs.276770 | CD52 antigen (CAMPATH-1 antigen) | 6.06 |
| 33 | SALL1** | Hs.135787 | sal-like 1 (Drosophila) | 6.05 |
| 34 | MONDOA** | Hs.437153 | Mlx interactor | 5.99 |
| 35 | TNC | Hs.143250 | tenascin C (hexabrachion) | 5.76 |
| 36 | Unknown | Hs.533721 | hypothetical protein KIAA0284 | 5.73 |
| 37 | ABCC4 | Hs.508423 | ATP-binding cassette, sub-family C (CFTR/MRP), member 4 | 5.64 |
| 38 | RAB37 | Hs.351413 | RAB37, member RAS oncogene family | 5.61 |
| 39 | Unknown | Hs.7413 | Transcribed locus | 5.60 |
| 40 | JARID2*** | Hs.269059 | Jumonji, AT rich interactive domain 2 | 5.57 |
| 41 | CRX | Hs.617342 | cone-rod homeobox | 5.52 |
| 42 | TIMP3**** | Hs.297324 | tissue inhibitor of metalloproteinase 3 | 5.51 |
| 43 | DPYSL3** | Hs.519659 | dihydropyrimidinase-like 3 | 5.50 |
| 44 | GLUL*** | Hs.518525 | glutamate-ammonia ligase (glutamine synthase) | 5.50 |
| 45 | GAS6*** | Hs.369201 | growth arrest-specific 6 | 5.38 |
| 46 | KIAA1622 | Hs.259599 | KIAA1622 | 5.19 |
| 47 | ATP1B1 | Hs.291196 | ATPase, Na+/K+ transporting, beta 1 polypeptide | 5.17 |
| 48 | P4HA2 | Hs.519568 | procollagen-proline, 2-oxoglutarate 4-dioxygenase | 5.15 |
| 49 | Cep164 | Hs.504009 | KIAA1052 protein | 5.05 |
| 50 | GNGT2 | Hs.181781 | G protein, gamma transducing activity polypeptide 2 | 5.00 |
| 51 | EPHX2 | Hs.212088 | epoxide hydrolase 2, cytoplasmic | 4.98 |
| 52 | LDLRAD3 | Hs.205865 | Low density lipoprotein receptor | 4.86 |
| 53 | SOX7 | Hs.213194 | SRY (sex determining region Y)-box 7 | 4.65 |
| 54 | FGFR1 | Hs.264887 | fibroblast growth factor receptor 1 | 4.58 |
| 55 | SLC9A3R1 | Hs.396783 | solute carrier family 9 (sodium/hydrogen exchanger), isoform 3 regulator 1 | 4.56 |
| 56 | ANKRD33 | Hs.433492 | ankyrin repeat domain 33 | 4.50 |
| 57 | C19orf30 | Hs.326728 | chromosome 19 open reading frame 30 | 4.49 |
| 58 | Unknown | Hs.446662 | Transcribed locus, strongly similar to NP_057175.1 | 4.46 |
| 59 | RP1L1 | Hs.33538 | retinitis pigmentosa 1-like 1 | 4.43 |
| 60 | PSG9** | Hs.502092 | pregnancy specific beta-1-glycoprotein 9 | 4.40 |
| 61 | LOXL1 | Hs.65436 | lysyl oxidase-like 1 | 4.40 |
| 62 | ELA3A** | Hs.181289 | elastase 3A, pancreatic (protease E) | 4.31 |
| 63 | SCN1B | Hs.436646 | sodium channel, voltage-gated, type I, beta | 4.25 |
| 64 | PITPNC1 | Hs.591185 | phosphatidylinositol transfer protein, cytoplasmic 1 | 4.22 |
| 65 | SLC2A3** | Hs.419240 | solute carrier family 2, member 3 | 4.21 |
| SLC2A14 | solute carrier family 2, member 14 | |||
| 66 | LIPG | Hs.465102 | lipase, endothelial | 4.16 |
| 67 | CCL26 | Hs.131342 | chemokine (C-C motif) ligand 26 | 4.11 |
| 68 | OLFM1 | Hs.522484 | olfactomedin 1 | 4.01 |
| 69 | HIPK2 | Hs.397465 | Homeodomain interacting protein kinase 2 | 4.00 |
Note: Gene symbols with bold font are retinal genes. Gene symbols with asterisks indicate that the fold induction is the average of multiple probe sets from the array
= 2 probe sets
= 3 probe sets
= 4 probe sets
Table 3.
T3-repressed genes in WERI cells (fold-change ≤- 4, p-value ≤0.01)
| Rank | Gene Symbol | UniGene ID | Gene Title | Fold |
|---|---|---|---|---|
| 1 | GNGT1 | Hs.642688 | G protein, gamma transducing activity polypeptide 1 | -19.90 |
| 2 | Unknown | Hs.56400 | Similar to Cdc42 guanine nucleotide exchange factor zizimin 1 | -13.47 |
| 3 | LOC387763 | Hs.530443 | hypothetical LOC387763 | -12.82 |
| 4 | SGPP2** | Hs.210043 | Sphingosine-1-phosphate phosphotase 2 | -11.00 |
| 5 | SLIT3 | Hs.145601 | slit homolog 3 (Drosophila) | -9.83 |
| 6 | LHX4 | Hs.496545 | LIM homeobox 4 | -9.40 |
| 7 | NAP5 | Hs.516471 | Nck-associated protein 5 | -8.94 |
| 8 | LOC440934 | Hs.238964 | Hypothetical gene supported by BC008048 | -8.63 |
| 9 | PCSK2 | Hs.315186 | proprotein convertase subtilisin/kexin type 2 | -8.25 |
| 10 | NDRG4 | Hs.322430 | NDRG family member 4 | -7.89 |
| 11 | LOC440928 | Hs.528187 | Hypothetical gene supported by AK096649 | -7.23 |
| 12 | SLC27A6 | Hs.49765 | solute carrier family 27 (fatty acid transporter), member 6 | -6.96 |
| 13 | EBF3 | Hs.205433 | early B-cell factor 3 | -6.66 |
| 14 | ABCC8 | Hs.54470 | ATP-binding cassette, sub-family C (CFTR/MRP), member 8 | -6.58 |
| 15 | Unknown | Hs.554010 | Transcribed locus | -6.11 |
| 16 | FLJ34870 | Hs.270083 | FLJ34870 protein | -5.87 |
| 17 | FOXP2*** | Hs.282787 | forkhead box P2 | -5.80 |
| 18 | ADRA2A | Hs.249159 | adrenergic, alpha-2A-, receptor | -5.79 |
| 19 | DDIT4L | Hs.480378 | DNA-damage-inducible transcript 4-like | -5.72 |
| 20 | MFAP4 | Hs.296049 | microfibrillar-associated protein 4 | -5.54 |
| 21 | CNTN1** | Hs.143434 | Contactin 1 | -5.53 |
| 22 | HHIP | Hs.507991 | hedgehog interacting protein | -5.39 |
| 23 | PRDM1*** | Hs.436023 | PR domain containing 1, with ZNF domain | -5.35 |
| 24 | PDZK1 | Hs.444751 | PDZ domain containing 1 | -5.32 |
| 25 | Unknown | Hs.147881 | Homo sapiens, clone IMAGE:4826545, mRNA | -5.30 |
| 26 | ADCY2** | Hs.481545 | adenylate cyclase 2 (brain) | -5.27 |
| 27 | PTPRG | Hs.148340 | protein tyrosine phosphatase, receptor type, G | -5.19 |
| 28 | KIAA1913 | Hs.172870 | KIAA1913 | -5.03 |
| 29 | LOC643771 | Hs.549665 | Hypothetical protein LOC643771 | -5.03 |
| 30 | Unknown | Hs.356481 | CDNA clone IMAGE:4077090, partial cds | -4.85 |
| 31 | Unknown | Hs.146050 | Transcribed locus | -4.81 |
| 32 | SV2C*** | Hs.482549 | Synaptic vesicle glycoprotein 2C | -4.80 |
| 33 | ISOC1 | Hs.483296 | isochorismatase domain containing 1 | -4.79 |
| 34 | APCDD1 | Hs.293274 | adenomatosis polyposis coli down-regulated 1 | -4.78 |
| 35 | GSG1 | Hs.558558 | germ cell associated 1 | -4.70 |
| 36 | CTNND2** | Hs.314543 | catenin (cadherin-associated protein), delta 2 | -4.63 |
| 37 | UNC93A | Hs.145911 | unc-93 homolog A (C. elegans) | -4.58 |
| 38 | RPL10A | Hs.148340 | Ribosomal protein L10a | -4.49 |
| 39 | ERN1 | Hs.133982 | endoplasmic reticulum to nucleus signalling 1 | -4.41 |
| 40 | Unknown | Hs.552087 | CDNA clone IMAGE:5922621, partial cds | -4.37 |
| 41 | SPAG1 | Hs.492373 | sperm associated antigen 1 | -4.36 |
| 42 | HT017 | Hs.558524 | HT017 protein | -4.34 |
| 43 | DOC1 | Hs.104672 | downregulated in ovarian cancer 1 | -4.29 |
| 44 | NSE2 | Hs.124951 | breast cancer membrane protein 101 | -4.27 |
| 45 | C10orf13 | Hs.466120 | chromosome 10 open reading frame 13 | -4.26 |
| 46 | AMPD3 | Hs.501890 | adenosine monophosphate deaminase (isoform E) | -4.23 |
| 47 | BAI3 | Hs.13261 | brain-specific angiogenesis inhibitor 3 | -4.18 |
| 48 | PRG-3 | Hs.382683 | plasticity related gene 3 | -4.17 |
| 49 | CAP2 | Hs.132902 | CAP, adenylate cyclase-associated protein, 2 (yeast) | -4.04 |
| 50 | LGI2 | Hs.12488 | leucine-rich repeat LGI family, member 2 | -4.02 |
Note: Gene symbols with bold font are retinal genes. Gene symbols with asterisks indicate that the fold induction is the average of multiple probe sets from the array
= 2 probe sets
= 3 probe sets
= 4 probe sets
Not surprisingly, we found that the induction level of the L/M opsin gene (OPN1LW/ OPN1MW) was the highest (44.68 fold) on the list of up-regulated genes (Table 2). In addition to the L/M opsin gene, the following four retinal genes were induced more than 4 fold (p≤0.01): CRX (cone rod homeobox), a homeodomain-containing transcription factor that is essential for the development of cone and rod photoreceptors; TIMP3 (tissue inhibitor of metalloproteinases), the gene that is mutated in Sorsby’s fundus dystrophy, a retinal degenerative disease; GNGT2 (the γ subunit of cone-specific transducin), and RP1L1 (RP1-like protein 1), a gene with sequence similarity to RP1 (retinitis pigmentosa 1). The term retinal gene here is defined as a gene found on the lists of retinal disease genes in the RetNet database (www.sph.uth.tmc.edu/Retnet) and retina enriched genes derived from EST, SAGE and microarray data (Qian et al. 2005).
Thyroid hormone receptors can also function as transcriptional repressors in a ligand-dependent or independent manner (reviewed in (Yen 2001)). There are a number of retinal candidates that could potentially be regulated by thyroid hormone negatively: the S-opsin, which was found to be inhibited by thyroid hormone in mouse models and in vitro reporter analysis (Yanagi et al. 2002; Roberts et al. 2006); NRL and NR2E3, two rod-specific transcription factors which positively regulate rod cell differentiation and rod-specific gene expression but have negative impact on the cone pathway (Chen et al. 2005; Cheng et al. 2006; Oh et al. 2007). However, although the U133+2.0 chip contains probes for these genes, no significant change in mRNA levels in response to T3 were observed by microarray analysis. Instead, GNGT1 (the γ subunit of rod-specific transducin) was the only retinal gene found to be down-regulated by more than 4 fold (-19.90 fold) We suspect that some negative targets of thyroid hormone could be missed using the WERI model system since the cells were most likely derived from a precursor cell that was committed to the L/M cone lineage.
Unexpectedly, we found that most differentially expressed genes identified (Table 2, 3) have not previously been reported to be expressed in the retina and to be TH-responsive. Only one gene on our 4 fold induced list, the hairless gene (HR), has been previously reported to be responsive to TH (Thompson 1996).
Verification of microarray data by qRT-PCR
The success of detecting induction of the L/M opsin gene by microarray analysis indicates that the array hybridization experiments were well executed. However, to get a better sense of the performance of the microarray data, we decided to verify additional genes on our list. Since we only found 6 retinal genes (OPN1LW and OPN1MW are counted as one unit here) on the 4 fold (p-value ≤0.01) list, we decide to expand our search to retinal genes found on the 2-fold list (p-value ≤0.05). We identified a total of 13 retinal genes from the 2-fold (p-value ≤0.05) list, including 6 previously identified from the 4 fold list (Table 4). Quantitative real-time RT-PCR confirmed the microarray results in 12 out of 13 retinal genes tested (Table 4 and Figure 4). Change in expression of SAG, the rod arrestin gene, was the only false positive retinal gene found. This gene was identified as a weakly induced gene by microarray analysis (2.24 fold), but showed no significant change by qRT-PCR analysis. The fold inductions measured by qRT-PCR were generally higher than those obtained from microarray analysis. This is a common phenomenon for microarray experiments due to the saturation of array hybridization signals.
Table 4.
Validation of microarray data by qRT-PCR analysis
| Gene Function | Gene
Symbol |
Unigene
Hs. No. |
Microarray | Real Time | Validation | |||
|---|---|---|---|---|---|---|---|---|
| Fold | p-value | Fold | p-value | |||||
| Retinal Genes | Cone phototransduction | OPN1MW/
OPN1LW |
247787
592247 |
44.68 | ≤0.01 | 546.64 | ≤0.01 | TRUE |
| GNGT2 | 181781 | 5.00 | ≤0.01 | 4.37 | ≤0.01 | TRUE | ||
| ARR3 | 308 | 2.93 | ≤0.01 | 3.10 | ≤0.01 | TRUE | ||
| GCAP1** | 92858 | 2.70 | ≤0.01 | 3.00 | ≤0.01 | TRUE | ||
| PDE6H | 54471 | 2.21 | ≤0.01 | 2.22 | ≤0.01 | TRUE | ||
| PDE6C | 93173 | 2.06 | ≤0.05 | 2.64 | ≤0.01 | TRUE | ||
| GNB3 | 534315 | -2.41 | ≤0.05 | -2.85 | ≤0.01 | TRUE | ||
| Rod phototransduction | SAG | 32721 | 2.24 | ≤0.05 | 1.00 | ≤0.99 | FALSE | |
| GNGT1 | 642688 | -19.90 | ≤0.01 | -21.74 | ≤0.05 | TRUE | ||
| Transcription | CRX | 617342 | 5.52 | ≤0.01 | 4.22 | ≤0.01 | TRUE | |
| Others | TIMP3**** | 297324 | 5.51 | ≤0.01 | 10.74 | ≤0.01 | TRUE | |
| RP1L1 | 33538 | 4.43 | ≤0.01 | 9.17 | ≤0.01 | TRUE | ||
| IMPDH1 | 534808 | 2.85 | ≤0.01 | 2.90 | ≤0.01 | TRUE | ||
| Non-retinal genes | Auditory function | SALL1 | 135787 | 6.05 | ≤0.01 | 8.08 | ≤0.01 | TRUE |
| DELGEF | 32470 | 2.61 | ≤0.01 | 3.01 | ≤0.01 | TRUE | ||
| CRYM | 924 | 2.59 | ≤0.05 | 3.02 | ≤0.01 | TRUE | ||
| Cardiac function | HEG*** | 477420 | 6.57 | ≤0.01 | 6.91 | ≤0.01 | TRUE | |
| APOE*** | 110675 | 6.06 | ≤0.01 | 7.46 | ≤0.01 | TRUE | ||
| Gene regulation | HR | 272367 | 7.49 | ≤0.01 | 90.05 | ≤0.01 | TRUE | |
| Immune response | TRA@ | 74647 | 10.81 | ≤0.01 | Not detectable | FALSE | ||
| MARCO | 67726 | 8.83 | ≤0.01 | 103.47 | ≤0.01 | TRUE | ||
| Metabolism | LMOD1*** | 519075 | 24.46 | ≤0.01 | 235.44 | ≤0.01 | TRUE | |
| DPP4** | 368912 | 10.68 | ≤0.01 | 80.05 | ≤0.01 | TRUE | ||
| CST11 | 128100 | 10.60 | ≤0.01 | 40.28 | ≤0.01 | TRUE | ||
| PYY | 169249 | 8.06 | ≤0.01 | 54.93 | ≤0.01 | TRUE | ||
| GMPR | 484741 | 7.69 | ≤0.01 | 33.12 | ≤0.01 | TRUE | ||
| RRAD** | 1027 | 7.57 | ≤0.01 | 11.37 | ≤0.01 | TRUE | ||
| LIPG | 465102 | 4.16 | ≤0.01 | 7.10 | ≤0.01 | TRUE | ||
| Others | PALM2/
AKAP2 |
259461 | 12.75 | ≤0.01 | 125.19 | ≤0.01 | TRUE | |
| KIAA1755 | 472690 | 12.33 | ≤0.01 | 238.97 | ≤0.01 | TRUE | ||
| THEDC1 | 24309 | 10.23 | ≤0.05 | 58.24 | ≤0.01 | TRUE | ||
| TP53I3 | 50649 | 9.64 | ≤0.01 | 14.72 | ≤0.01 | TRUE | ||
| TU3A | 8022 | 9.15 | ≤0.01 | 28.85 | ≤0.01 | TRUE | ||
| RARI14 | 431400 | 8.93 | ≤0.01 | 15.33 | ≤0.01 | TRUE | ||
| ITM2C | 111577 | 8.19 | ≤0.01 | 16.37 | ≤0.05 | TRUE | ||
| SPON2 | 302963 | 7.94 | ≤0.01 | 12.99 | ≤0.01 | TRUE | ||
| TFF1 | 162807 | 7.77 | ≤0.01 | 24.71 | ≤0.01 | TRUE | ||
Note: Gene symbols with bold font are retinal genes. Gene symbols with asterisks indicate that the fold induction is the average of multiple probe sets from the array
= 2 probe sets
= 3 probe sets
= 4 probe sets
Figure 4. Verification of microarray data by qRT-PCR analysis.

RNA samples used for microarray analysis mock (Mock) and 100 nM T3 (TH), were subjected to qRT-PCR to measure the expression levels of the 37 target genes identified by microarray analysis. The data for all 37 genes can be found in Table 4. This figure shows the amplification curves of 8 genes: GAPDH (used for normalization), LMOD1 (an up-regulated non-retinal gene), 5 up-regulated retinal genes (OPN1LW/MW, CRX, RP1L1, TIMP3 and GNGT2), and 1 down-regulated retinal gene (GNGT1). Each sample contains three biological replicates and was assayed in duplicate.
We also examined by qRT-PCR analysis a subset of the non-retinal genes identified by expression microarray analysis. Similar to what was found with the retinal genes, 23 out of 24 non-retinal genes were confirmed by qRT-PCR (Table 4). The T cell receptor α (TRA@) was found to be the only false positive. Although TRA@ was found to be highly induced (10.81 fold) by microarray analysis, it was not detectable in the presence or absence of T3 by qRT-PCR analysis.
In summary, we verified by qRT-PCR a total of 35 out of 37 T3-responsive genes identified by microarray analysis, which is 94.6%. These results indicate that our expression microarray experiment was well performed and the data are reliable.
The identified retinal targets are regulated by TH at physiological concentration
Since the microarray experiment was performed using 100 nM T3, which is much higher than the physiological concentration (about 1 nM), we wanted to confirm that the target genes identified would also be regulated at physiological concentrations. To address this question, we performed a dose-response experiment on all the retinal target genes identified. WERI cells were treated for 48 hours with different doses of T3 (1nM, 10 nM and 100 nM), as indicated in Figure 5, and the expression of each gene was measured by qRT-PCR. As expected, the induction of L/M opsin mRNA was substantial. Even at 1 nM T3 concentration, L/M opsin mRNA level increased more than 200 fold compared to the untreated samples. To determine the effect of T3 on L-opsin versus M-opsin expression, we developed a qRT-PCR assay using L-specific or M-specific primers. The expression of both genes was shown to be induced by T3, although at 1 nM T3 the induction of M-opsin mRNA level (350 fold) was more dramatic than that of the L-opsin mRNA level (40 fold). TIMP3, another gene dramatically induced by T3, was up-regulated more than 15 fold by 1 nM T3 (Figure 5B). The induction of the other 8 retinal targets was below 10 fold (Figure 5C), but nevertheless showed a good dose response. Most importantly, except for PDE6H, all these genes showed a significant induction (p-value ≤0.05) at 1 nM T3 compared with the untreated group (No T3). On the other hand, the two down-regulated genes showed no dose-dependency of the T3 repression (Figure 5D). Treatment with 1 nM T3 resulted in similar levels of reduction as that seen with 100 nM T3 treatment. This indicates that T3-dependent repression is very sensitive and saturated at doses higher than 1 nM. We conclude from this dose-response experiment that PDE6H is not statistically significantly affected by T3 treatment at physiological concentration but the other 12 retinal TH-targets (OPN1LW and OPN1MW are counted as two genes here) identified by microarray are physiologically relevant.
Figure 5. Dose-response analyses on identified retinal TH-targets.

RNA samples from WERI cells treated for 48 hours with either vehicle control (No T3) or different concentrations of T3 (1nM, 10 nM, 100 nM) were used to perform qRT-PCR to measure the expression level of each gene as indicated. Fold inductions was calculated using the ddCt method which show the relative amount of each sample compared to the control (No T3). The data shown are normalized mean values ± SD of three biological replicates done in duplicate. Statistical analyses were performed using the Student’s t-test and compared the 1 nM group to the control group (No T3). The * sign indicates p≤0.05, ** sign indicates p≤0.01.
Next, we decided to measure the kinetics of the T3-response of above retinal genes. In general, the induction of a target gene that is directly activated by thyroid hormone receptor should be faster than a gene that is indirectly activated via an intermediate transcription factor. Therefore, the kinetics may give us some clues about the mechanism of induction. A time course experiment was performed using 5 nM T3 at various time points (0, 6H, 24H, and 48H) as indicated in Figure 6. A 5 nM T3 dose was chosen because it can generate robust signals and is close to the physiological concentration. Based on the kinetics, we categorized the up-regulated genes into 3 groups, fast (F, ≥ 3 fold induction at 6H time point), medium (M, ≥ 3 fold induction at 24H time point) and slow (S, < 3 fold at both 6H and 24H time points). As shown in Figure 6A, the activation of the L- and M-opsin genes by T3 was not only potent, but also very fast. After just 6 hours, the induction reached its maximal level and remained at similar levels at both 24 and 48 hour treatments. TIMP3, CRX, GNGT2 and IMPDH1 also fell into the F group that was induced more than three fold only after 6 hour T3 treatment. ARR3, GCAP1, PDE6C and RP1L1 fell into the M group which reached 3 fold inductions at 24 hour time point. Only one gene (PDE6H) fell into the S group. Significant induction of PDE6H was not observed until the 48H time point. Combining this result with the insignificant induction by 1 nM T3, we concluded that the effect of T3 on PDE6H is most likely an in vitro artifact due to the high T3 dose and probably not important in vivo. Therefore, we removed PDE6H from our final list of retinal targets of thyroid hormone.
Figure 6. Time course analyses on identified retinal TH-targets.

RNA samples from WERI cells treated with 5 nM T3 at different time points were used to perform qRT-PCR to measure the expression levels of each gene as indicated. GAPDH was also measured for normalization. Fold induction was calculated using the ddCt method which shows the relative amount of samples from each time point compared to the 0 time point. The data shown are normalized mean values ± SD of three biological replicates done in duplicate. F=fast, M=medium, S=slow.
While most induced target genes reached their maximal expression level by the 6H or 24H time points, maximal repression of GNGT1 and GNB3 by T3 was not observed until the 48H time point (Figure 6D). This is probably due to the time it takes to degrade the mRNA of these genes in the cells. Nevertheless, we believe that the inhibition took effect immediately after T3 treatment, which is supported by the quick decrease of expression at 6H. Such an inhibition could be mediated by two different mechanisms, binding of TR to a negative responsive element in these genes and recruitment of transcriptional co-repressor(s) or titrating away transcriptional co-factor(s) that are required for activation of these genes. Further work will be required to elucidate the actual mechanism of the T3-dependent inhibition of GNGT1 and GNB3.
DISCUSSION
Transcriptional regulation of OPN1LW and OPN1MW opsin genes by thyroid hormone
Using expression microarray and quantitative RT-PCR analysis, we showed in this paper that the expression of both human L and M opsin genes (OPN1LW and OPN1MW) was rapidly and highly induced by T3 in WERI cells. This result is consistent with the in vivo data showing thyroid hormone and its receptor TRβ2 are required for M-cone development in mice (Ng et al. 2001; Roberts et al. 2006), and strongly suggests that the L and M opsin genes are direct transcriptional targets of T3. However, the cis-regulatory element responsible for the T3 response of the L/M locus has not been identified yet. Yanagi et al reported that the locus control region (LCR) contributes to the T3 response of the L/M opsin gene (Yanagi et al. 2002). They found that T3 (at 1 uM) induced luciferase activity about 2-3 fold in 293 cells co-transfected with a reporter construct containing the LCR region of the human L/M locus (fused with a thymidine kinase promoter) and a TRβ2 expression vector. This weak induction is inconsistent with the substantial induction (≥ 500 fold by 100nM T3 treatment) of the endogenous L/M opsin genes observed after T3 treatment. Furthermore, the LCR does not contain a consensus thyroid hormone responsive element (TRE). We analyzed a 10 kb segment upstream of the L/M locus using Alibaba software (http://www.gene-regulation.com/pub/programs/alibaba2) and found a number of potential TREs. Two sites match the consensus DR4 structure of a TRE (direct repeat of two half-site AGGTCA separated by 4 nucleotides), while others contain only a single half-site, which may also function in transcriptional activation by tethering a second TRβ2 or RXRγ molecule. In the future, we will perform chromatin immunoprecipitation (ChIP) and reporter analysis to identify the regulatory sequences that are responsible for induction of the L and M opsin genes by T3.
Other retinal genes regulated by thyroid hormone
We identified a total of 12 retinal genes whose expression is regulated by thyroid hormone. Among them, 8 genes are involved in phototransduction signaling. Seven are in the cone pathway (OPN1MW, OPN1LW, ARR3, GCAP1, GNGT2, PDE6C, and GNB3) and one is in the rod pathway (GNGT1). Interestingly, genes involved in the cone pathway are mostly induced except for GNB3, which is weakly down-regulated. On the other hand, the only gene involved in the rod pathway, GNGT1, the rod-specific gamma subunit of transducin, is the most highly repressed gene. What is worth pointing out is that GNGT2, the counterpart of GNGT1 in the cone, is significantly up-regulated by thyroid hormone. These results suggest that thyroid hormone may direct cone photoreceptor development and differentiation through both positive regulation of cone-specific genes and negative regulation of rod-specific genes.
CRX, the cone-rod homeobox gene, is the only transcription factor identified among the retinal targets. CRX is known to be essential for the development and function of both cone and rod photoreceptors (Freund et al. 1997; Furukawa et al. 1997; Furukawa et al. 1999). Mutations of the CRX gene are linked to a number of retinal disorders, such as cone-rod dystrophy (Swain et al. 1997) and Leber congenital amaurosis (Swaroop et al. 1999). A number of cone and rod specific genes have been found to be regulated by CRX, including several of the TH targets we identified (L/M opsin gene, ARR3, GCAP1 and IMPDH1) (Chen et al. 1997; Peng et al. 2005; Qian et al. 2005). Chromatin IP and reporter analysis have shown that CRX can bind to the promoter and locus control region (LCR) of the L/M gene locus and activate its transcription (Peng et al. 2005). However, based on the potency and kinetics of induction of L/M opsin versus CRX, we do not think CRX is an intermediate factor required for T3 action on L/M opsin gene. Instead, it is likely that both CRX and TRβ2 directly bind and activate the L/M opsin gene. On the other hand, CRX may mediate the activation of ARR3 and GCAP1 by T3 based on the relatively slower kinetics of these genes. The fact that TR and CRX share a number of common targets and that CRX is also a T3-target provides new insight into the mechanism of cone photoreceptor differentiation.
TIMP3 is an inhibitor of matrix metalloproteinases (MMP) and is mutated in Sorsby’s fundus dystrophy (SFD) (Weber et al. 1994), an autosomal dominant retinal degenerative disease. Interestingly, mutant TIMP3 retains its MMP inhibitor activity and the expression of the TIMP3 gene is increased, rather than decreased in the eyes from patients with SFD (Fariss et al. 1998; Langton et al. 1998). Increased expression of TIMP3 has also been found in other retinal diseases, such as simplex retinitis pigmentosa (Jones et al. 1994; Jomary et al. 1995). Our finding that the expression of TIMP3 can be significantly up-regulated by T3 suggests that TIMP3 could be involved in thyroid-associated ophthalmopathy. It will be interesting to examine the levels of TIMP3 in patients with hyperthyroidism, such as Grave’s diseases, to see if such a connection can be substantiated.
We need to point out that the mechanism of T3 action on these retinal genes could occur at both transcriptional and/or post-transcriptional levels as well as directly or indirectly. At this point, we are not able to distinguish between these possibilities. In silico analysis of the 3kb promoter regions of CRX and TIMP3 revealed a few potential TREs for each gene. However, future experiments are required to determine whether these potential TREs indeed contribute to the T3-response of these target genes in vivo.
Non-retinal genes regulated by thyroid hormone
Thyroid hormone has profound roles in growth, differentiation and metabolic homeostasis. However, after an extensive search for TH target genes (reviewed in (Viguerie and Langin 2003; Kahaly and Dillmann 2005)), the number of TH targets identified is still much lower than expected. Surprisingly, using the WERI retinoblastoma cell line as a model system, we identified a large number of novel targets of TH. We also verified, using qRT-PCR, the TH-regulation of 23 genes that are not currently known to be retinal genes (defined as non-retinal genes here). Apparently, even though the retina may not be the primary tissue for expression of these genes, their activation by thyroid hormone is still permissive in WERI cells. Many of the differentially expressed genes we identified have been previously implicated in thyroid hormone action. For example, LMOD1, the 2nd most highly induced gene, was found to be overexpressed in patients with Grave’s disease, a hyperthyroid disorder (Kromminga et al. 1998); DPP4, a dipeptidyl peptidase involved in metabolic inactivation of incretin hormones, has been found to be highly expressed in thyroid tumors by several gene expression studies (Huang et al. 2001; Jarzab et al. 2005; Taniguchi et al. 2005); PYY1(peptide YY), APOE (apolipoprotein E) and LIPG (endothelial lipase) are all involved in lipid metabolism, providing new mechanisms by which TH could modulate lipid metabolism. We also found three induced genes, SALL1(sal-like 1 protein, +6.06 fold), CRYM (mu crystalline, +2.59 fold), and DELGEF (deafness locus associated putative guanine nucleotide exchange factor, +2.61 fold) that are linked to deafness (Uhlmann et al. 1999; Abe et al. 2003; Botzenhart et al. 2005). It is possible that loss of expression of these genes could be responsible for the deafness phenotype observed in TRβ knock out mice.
In summary, we have identified a number of novel TH target genes using expression microarray analysis followed by qRT-PCR verification. Our findings may contribute significantly to the understanding of the mechanism of thyroid hormone action during photoreceptor development, as well as its involvement in human diseases associated with alterations of thyroid status.
Supplementary Material
Acknowledgments
Special thanks go to Dr. Laura Rufibach for critical reading on the manuscript, Dr. Kyle Serikawa, Dr. Weijia Zhang and Dr. Ron Chen for their insightful suggestions on microarray experiment design and analysis. The Microarray assay was performed at the Center for Array Technologies (CAT) at the University of Washington. This work was supported by National Institutes of Health Grant EY08395 to SD and the CAT resources were partially funded under the following grants from the National Institutes of Health, National Center for Research Resources 1S10RR019423-01 and 1S10RR021108-01 and an initial grant from the M.J. Murdoch Charitable Trust.
Footnotes
Publisher's Disclaimer: This is a PDF file of an unedited manuscript that has been accepted for publication. As a service to our customers we are providing this early version of the manuscript. The manuscript will undergo copyediting, typesetting, and review of the resulting proof before it is published in its final citable form. Please note that during the production process errors may be discovered which could affect the content, and all legal disclaimers that apply to the journal pertain.
References
- Abe S, Katagiri T, Saito-Hisaminato A, Usami S, Inoue Y, Tsunoda T, Nakamura Y. Identification of CRYM as a candidate responsible for nonsyndromic deafness, through cDNA microarray analysis of human cochlear and vestibular tissues. Am J Hum Genet. 2003;72(1):73–82. doi: 10.1086/345398. [DOI] [PMC free article] [PubMed] [Google Scholar]
- Botzenhart EM, Green A, Ilyina H, Konig R, Lowry RB, Lo IF, Shohat M, Burke L, McGaughran J, Chafai R, Pierquin G, Michaelis RC, Whiteford ML, Simola KO, Rosler B, Kohlhase J. SALL1 mutation analysis in Townes-Brocks syndrome: twelve novel mutations and expansion of the phenotype. Hum Mutat. 2005;26(3):282. doi: 10.1002/humu.9362. [DOI] [PubMed] [Google Scholar]
- Chen J, Rattner A, Nathans J. The rod photoreceptor-specific nuclear receptor Nr2e3 represses transcription of multiple cone-specific genes. J Neurosci. 2005;25(1):118–129. doi: 10.1523/JNEUROSCI.3571-04.2005. [DOI] [PMC free article] [PubMed] [Google Scholar]
- Chen S, Wang QL, Nie Z, Sun H, Lennon G, Copeland NG, Gilbert DJ, Jenkins NA, Zack DJ. Crx, a novel Otx-like paired-homeodomain protein, binds to and transactivates photoreceptor cell-specific genes. Neuron. 1997;19(5):1017–1030. doi: 10.1016/s0896-6273(00)80394-3. [DOI] [PubMed] [Google Scholar]
- Cheng H, Aleman TS, Cideciyan AV, Khanna R, Jacobson SG, Swaroop A. In vivo function of the orphan nuclear receptor NR2E3 in establishing photoreceptor identity during mammalian retinal development. Hum Mol Genet. 2006;15(17):2588–2602. doi: 10.1093/hmg/ddl185. [DOI] [PMC free article] [PubMed] [Google Scholar]
- Deeb SS. Molecular genetics of colour vision deficiencies. Clin Exp Optom. 2004;87(4-5):224–229. doi: 10.1111/j.1444-0938.2004.tb05052.x. [DOI] [PubMed] [Google Scholar]
- Deeb SS, Liu Y, Hayashi T. Mutually exclusive expression of the L and M pigment genes in the human retinoblastoma cell line WERI: resetting by cell division. Vis Neurosci. 2006 doi: 10.1017/S0952523806233030. in printing. [DOI] [PubMed] [Google Scholar]
- Fariss RN, Apte SS, Luthert PJ, Bird AC, Milam AH. Accumulation of tissue inhibitor of metalloproteinases-3 in human eyes with Sorsby’s fundus dystrophy or retinitis pigmentosa. Br J Ophthalmol. 1998;82(11):1329–1334. doi: 10.1136/bjo.82.11.1329. [DOI] [PMC free article] [PubMed] [Google Scholar]
- Fei Y, Hughes TE. Transgenic expression of the jellyfish green fluorescent protein in the cone photoreceptors of the mouse. Vis Neurosci. 2001;18(4):615–623. doi: 10.1017/s0952523801184117. [DOI] [PubMed] [Google Scholar]
- Freund CL, Gregory-Evans CY, Furukawa T, Papaioannou M, Looser J, Ploder L, Bellingham J, Ng D, Herbrick JA, Duncan A, Scherer SW, Tsui LC, Loutradis-Anagnostou A, Jacobson SG, Cepko CL, Bhattacharya SS, McInnes RR. Cone-rod dystrophy due to mutations in a novel photoreceptor-specific homeobox gene (CRX) essential for maintenance of the photoreceptor. Cell. 1997;91(4):543–553. doi: 10.1016/s0092-8674(00)80440-7. [DOI] [PubMed] [Google Scholar]
- Furukawa T, Morrow EM, Cepko CL. Crx, a novel otx-like homeobox gene, shows photoreceptor-specific expression and regulates photoreceptor differentiation. Cell. 1997;91(4):531–541. doi: 10.1016/s0092-8674(00)80439-0. [DOI] [PubMed] [Google Scholar]
- Furukawa T, Morrow EM, Li T, Davis FC, Cepko CL. Retinopathy and attenuated circadian entrainment in Crx-deficient mice. Nat Genet. 1999;23(4):466–470. doi: 10.1038/70591. [DOI] [PubMed] [Google Scholar]
- Huang Y, Prasad M, Lemon WJ, Hampel H, Wright FA, Kornacker K, LiVolsi V, Frankel W, Kloos RT, Eng C, Pellegata NS, de la Chapelle A. Gene expression in papillary thyroid carcinoma reveals highly consistent profiles. Proc Natl Acad Sci U S A. 2001;98(26):15044–15049. doi: 10.1073/pnas.251547398. [DOI] [PMC free article] [PubMed] [Google Scholar]
- Jarzab B, Wiench M, Fujarewicz K, Simek K, Jarzab M, Oczko-Wojciechowska M, Wloch J, Czarniecka A, Chmielik E, Lange D, Pawlaczek A, Szpak S, Gubala E, Swierniak A. Gene expression profile of papillary thyroid cancer: sources of variability and diagnostic implications. Cancer Res. 2005;65(4):1587–1597. doi: 10.1158/0008-5472.CAN-04-3078. [DOI] [PubMed] [Google Scholar]
- Jomary C, Neal MJ, Jones SE. Increased expression of retinal TIMP3 mRNA in simplex retinitis pigmentosa is localized to photoreceptor-retaining regions. J Neurochem. 1995;64(5):2370–2373. doi: 10.1046/j.1471-4159.1995.64052370.x. [DOI] [PubMed] [Google Scholar]
- Jones SE, Jomary C, Neal MJ. Expression of TIMP3 mRNA is elevated in retinas affected by simplex retinitis pigmentosa. FEBS Lett. 1994;352(2):171–174. doi: 10.1016/0014-5793(94)00951-1. [DOI] [PubMed] [Google Scholar]
- Kahaly GJ, Dillmann WH. Thyroid hormone action in the heart. Endocr Rev. 2005;26(5):704–728. doi: 10.1210/er.2003-0033. [DOI] [PubMed] [Google Scholar]
- Kromminga A, Hagel C, Arndt R, Schuppert F. Serological reactivity of recombinant 1D autoantigen and its expression in human thyroid and eye muscle tissue: a possible autoantigenic link in Graves’ patients. J Clin Endocrinol Metab. 1998;83(8):2817–2823. doi: 10.1210/jcem.83.8.5018. [DOI] [PubMed] [Google Scholar]
- Langton KP, Barker MD, McKie N. Localization of the functional domains of human tissue inhibitor of metalloproteinases-3 and the effects of a Sorsby’s fundus dystrophy mutation. J Biol Chem. 1998;273(27):16778–16781. doi: 10.1074/jbc.273.27.16778. [DOI] [PubMed] [Google Scholar]
- Li A, Zhu X, Brown B, Craft CM. Gene expression networks underlying retinoic acid-induced differentiation of human retinoblastoma cells. Invest Ophthalmol Vis Sci. 2003;44(3):996–1007. doi: 10.1167/iovs.02-0434. [DOI] [PubMed] [Google Scholar]
- Malo MS, Zhang W, Alkhoury F, Pushpakaran P, Abedrapo MA, Mozumder M, Fleming E, Siddique A, Henderson JW, Hodin RA. Thyroid hormone positively regulates the enterocyte differentiation marker intestinal alkaline phosphatase gene via an atypical response element. Mol Endocrinol. 2004;18(8):1941–1962. doi: 10.1210/me.2003-0351. [DOI] [PubMed] [Google Scholar]
- Ng L, Hurley JB, Dierks B, Srinivas M, Salto C, Vennstrom B, Reh TA, Forrest D. A thyroid hormone receptor that is required for the development of green cone photoreceptors. Nat Genet. 2001;27(1):94–98. doi: 10.1038/83829. [DOI] [PubMed] [Google Scholar]
- Oh EC, Khan N, Novelli E, Khanna H, Strettoi E, Swaroop A. Transformation of cone precursors to functional rod photoreceptors by bZIP transcription factor NRL. Proc Natl Acad Sci U S A. 2007;104(5):1679–1684. doi: 10.1073/pnas.0605934104. [DOI] [PMC free article] [PubMed] [Google Scholar]
- Peng GH, Ahmad O, Ahmad F, Liu J, Chen S. The photoreceptor-specific nuclear receptor Nr2e3 interacts with Crx and exerts opposing effects on the transcription of rod versus cone genes. Hum Mol Genet. 2005;14(6):747–764. doi: 10.1093/hmg/ddi070. [DOI] [PubMed] [Google Scholar]
- Qian J, Esumi N, Chen Y, Wang Q, Chowers I, Zack DJ. Identification of regulatory targets of tissue-specific transcription factors: application to retina-specific gene regulation. Nucleic Acids Res. 2005;33(11):3479–3491. doi: 10.1093/nar/gki658. [DOI] [PMC free article] [PubMed] [Google Scholar]
- Roberts MR, Hendrickson A, McGuire CR, Reh TA. Retinoid X receptor (gamma) is necessary to establish the S-opsin gradient in cone photoreceptors of the developing mouse retina. Invest Ophthalmol Vis Sci. 2005;46(8):2897–2904. doi: 10.1167/iovs.05-0093. [DOI] [PubMed] [Google Scholar]
- Roberts MR, Srinivas M, Forrest D, Morreale de Escobar G, Reh TA. Making the gradient: thyroid hormone regulates cone opsin expression in the developing mouse retina. Proc Natl Acad Sci U S A. 2006;103(16):6218–6223. doi: 10.1073/pnas.0509981103. [DOI] [PMC free article] [PubMed] [Google Scholar]
- Shaaban SA, Deeb SS. Functional analysis of the promoters of the human red and green visual pigment genes. Invest Ophthalmol Vis Sci. 1998;39(6):885–896. [PubMed] [Google Scholar]
- Swain PK, Chen S, Wang QL, Affatigato LM, Coats CL, Brady KD, Fishman GA, Jacobson SG, Swaroop A, Stone E, Sieving PA, Zack DJ. Mutations in the cone-rod homeobox gene are associated with the cone-rod dystrophy photoreceptor degeneration. Neuron. 1997;19(6):1329–1336. doi: 10.1016/s0896-6273(00)80423-7. [DOI] [PubMed] [Google Scholar]
- Swaroop A, Wang QL, Wu W, Cook J, Coats C, Xu S, Chen S, Zack DJ, Sieving PA. Leber congenital amaurosis caused by a homozygous mutation (R90W) in the homeodomain of the retinal transcription factor CRX: direct evidence for the involvement of CRX in the development of photoreceptor function. Hum Mol Genet. 1999;8(2):299–305. doi: 10.1093/hmg/8.2.299. [DOI] [PubMed] [Google Scholar]
- Taniguchi K, Takano T, Miyauchi A, Koizumi K, Ito Y, Takamura Y, Ishitobi M, Miyoshi Y, Taguchi T, Tamaki Y, Kato K, Noguchi S. Differentiation of follicular thyroid adenoma from carcinoma by means of gene expression profiling with adapter-tagged competitive polymerase chain reaction. Oncology. 2005;69(5):428–435. doi: 10.1159/000089998. [DOI] [PubMed] [Google Scholar]
- Thompson CC. Thyroid hormone-responsive genes in developing cerebellum include a novel synaptotagmin and a hairless homolog. J Neurosci. 1996;16(24):7832–7840. doi: 10.1523/JNEUROSCI.16-24-07832.1996. [DOI] [PMC free article] [PubMed] [Google Scholar]
- Uhlmann J, Wiemann S, Ponstingl H. DelGEF, an RCC 1-related protein encoded by a gene on chromosome 11p14 critical for two forms of hereditary deafness. FEBS Lett. 1999;460(1):153–160. doi: 10.1016/s0014-5793(99)01333-2. [DOI] [PubMed] [Google Scholar]
- Viguerie N, Langin D. Effect of thyroid hormone on gene expression. Curr Opin Clin Nutr Metab Care. 2003;6(4):377–381. doi: 10.1097/01.mco.0000078998.96795.e7. [DOI] [PubMed] [Google Scholar]
- Wang Y, Macke JP, Merbs SL, Zack DJ, Klaunberg B, Bennett J, Gearhart J, Nathans J. A locus control region adjacent to the human red and green visual pigment genes. Neuron. 1992;9(3):429–440. doi: 10.1016/0896-6273(92)90181-c. [DOI] [PubMed] [Google Scholar]
- Weber BH, Vogt G, Pruett RC, Stohr H, Felbor U. Mutations in the tissue inhibitor of metalloproteinases-3 (TIMP3) in patients with Sorsby’s fundus dystrophy. Nat Genet. 1994;8(4):352–356. doi: 10.1038/ng1294-352. [DOI] [PubMed] [Google Scholar]
- Yanagi Y, Takezawa S, Kato S. Distinct functions of photoreceptor cell-specific nuclear receptor, thyroid hormone receptor beta2 and CRX in one photoreceptor development. Invest Ophthalmol Vis Sci. 2002;43(11):3489–3494. [PubMed] [Google Scholar]
- Yen PM. Physiological and molecular basis of thyroid hormone action. Physiol Rev. 2001;81(3):1097–1142. doi: 10.1152/physrev.2001.81.3.1097. [DOI] [PubMed] [Google Scholar]
Associated Data
This section collects any data citations, data availability statements, or supplementary materials included in this article.