

Abstract
The Consortium of Radiologic Imaging Studies of Polycystic Kidney Disease (CRISP) recently showed that renal enlargement in autosomal-dominant polycystic kidney disease mimicked exponential growth. We determined the effects of cyst initiation rate, total number, and growth rate on the time-dependent change of total cyst volume (TCV). Mathematical models with equations integrating cyst surface area, volume, and an invariant growth rate constant were used to compute the time-dependent change in volume of solitary and multiple cysts. Multiple expanding cysts increased TCV in an exponential-like pattern even when individual cysts formed at different rates or exhibited different but constant growth rates. TCV depended on the rate of cyst initiation and on the total number of cysts; however, the compounding effect of exponential-like growth was the most powerful determinant of long-term cyst expansion. Extrapolation of TCV data plots for individual subjects back to an age of 18 predicted TCV values within an established range. We conclude that cysts started early in life were the main contributor to eventual TCV while their growth rate primarily determined renal size; although the rate of formation and the ultimate number of cysts also contributed. The good fit between the exponential models and the extrapolated CRISP data indicates that the TCV growth rate is a defining trait for individual patients and may be used as a prognostic marker.
Keywords: renal cysts, cell growth, polycystic kidney, prolifiration cyst volume, tubules
The progressive expansion of renal cysts is the hallmark of autosomal-dominant polycystic kidney disease (ADPKD).1,2 At the end stage, ADPKD kidneys are distorted masses of fluid and blood-filled sacs embedded within dense fibrotic bands. Cyst initiation begins early in life in a relatively small fraction of renal tubules when the levels of functional polycystin-1 or polycystin-2, the proteins encoded by PKD1 and PKD2, decrease below a critical threshold.3–7 Fluid-filled cysts, often several centimeters across, extend from renal tubules normally 20–40 μm in diameter. The cyst-forming process appears to continue over the life of the individual.8
Cystogenesis involves focal and sustained proliferation of tubule epithelial cells, creating a mural pocket that progressively expands. Initially, glomerular filtrate enters the focal hyperplastic tubular segments to create microscopic cysts. When they reach ∼2 mm in diameter (∼0.0042 cm3), most cysts separate from the parent tubule to become isolated sacs.9 The sacs continue to expand as mural cell proliferation is compounded by transepithelial chloride secretion and osmotic water flow sufficient to fill the potential cavity created by the segmental neoplasm.10
The number of cysts that develop and their locations differ among patients as does the rate of cell proliferation. Cysts form in the cortex and the medulla, and in the early stages they may be scattered from pole to pole or sequestered in regions of the kidneys suggesting a haphazard process of initiation. In view of the biologic similarities between renal cyst enlargement and the growth of benign solid tumor masses, it was suggested that ADPKD might follow a relatively predictable course.11,12 An observational study of 232 patients with non-azotemic ADPKD (Consortium of Radiologic Imaging Studies of Polycystic Kidney Disease, CRISP) involving five academic medical centers was designed to ascertain the extent to which disease progression, reflected in the aggregate volumes of kidneys and cysts, was orderly or chaotic.13 The study dramatically established that combined kidney volume (left + right) increased in 93% of the patients over a 3-year period and that the increase in total kidney volume (TKV) was equal to the increase in total cyst volume (TCV), confirming that the increase in size can be ascribed primarily to the increase of fluid-filled cysts.
There was a wide range of age-adjusted kidney volumes among patients in the CRISP study and the intrarenal distribution of individual renal cysts was haphazard, probably reflecting the random expression of the ‘second hits’ or somatic events that initiated cyst formation.14–16 Surprisingly, the subsequent enlargement of the cysts in the CRISP study appeared to be predictable within individual subjects. Semi-logarithmic plots of TCV and TKV versus time were linear suggesting that renal growth was exponential, similar to the growth of individual cysts formed by renal epithelial cells in culture17–19 (Figure S1). The purpose of this study was to reconcile the apparently chaotic process of cyst initiation and intrarenal cyst distribution with the orderly renal enlargement. We utilized multicyst mathematical models to investigate the independent and interactive effects of (1) the chronological initiation of cysts, (2) the number of cysts, and (3) the growth rates of individual cysts on the time-dependent patterns of increased TCV.
RESULTS
In ADPKD, the consensus holds that cysts derive from one or a few mural epithelial cells within a renal tubule segment that become genetically transformed to proliferate indefinitely.14,15 These partially dedifferentiated cells cause an expansion of the tubule wall lined by a single layer of epithelium that retains certain structural, and electrolyte and fluid transport features of the parent nephron. The expanding segment eventually separates from the parent tubule, leaving an isolated sac that fills with fluid secreted by the epithelium.20
To model renal cyst growth, we assumed that a tubule pocket becomes a sphere (cyst) when it detaches from the parent tubule. Mural cell proliferation is the principal factor leading to the enlargement of renal cysts.11 Fluid secretion has been demonstrated in normal renal tubules and in renal cyst epithelium;21,22 however, fluid secretion does not contribute to the initiation of cysts as the dilated tubular segment is contiguous with the nephron (Figure 1). It is only after the cyst detaches from the parent tubule that fluid secretion contributes substantially to the accumulation of liquid within the cyst cavity to fill the expanse created by mural hyperplasia.
Figure 1.

Schematic diagram illustrating the evolution of a spherical cyst from a renal tubule.
Hydrostatic pressures within cysts remain close to values observed across the walls of normal renal tubules, indicating that a balanced state develops between the proliferation and the fluid secretion components of cyst enlargement.23,24 The weight of current evidence supports the view that cellular proliferation is the principal controlling element determining how fast renal cysts will expand, with fluid secretion having a lesser role.25 Consequently, the most economical model of cyst enlargement supposes that the rate of cell proliferation minus the loss of cells through apoptosis determines the size of the cyst and that fluid secretion increases proportionate to the net increase in mural epithelial area.
Cyst growth models
Solitary cyst
To simplify analysis, we assume that a cyst is formed when it separates from the original tubule (0.0042 cm3) (Figure 1). We assume further that the cyst remains spherical by the addition of uniform cellular elements that follow uniform growth kinetics. The mural epithelium remains confluent and the lumen expands to the fullest extent, dependent only on the number of cells increasing at a constant rate. This net growth rate will depend on the relative rates of proliferation and apoptosis, which for simplicity are not considered separately.
Assuming that isolated cysts enlarge as spheres,
where
and V(t) is the cyst volume (cm3) at time t (years), V0 is cyst volume at baseline, A is epithelial apical surface area (cm2), and k’ is the epithelial growth rate constant (proportion per year). The relation between cyst volume and time has an exponential form (Appendix 1). This approach is based on assumptions similar to those used to quantify the doubling times and growth rates of solid pulmonary tumors.26
Shown in conventional format in Figure 2a are the hypothetical relations between volume and time for solitary cysts beginning at a volume of 0.0042 cm3 and growing at constant rates set by k (5–25% per year; k=3k’/2). Logarithmic transformation of the data in Figure 2a would yield linear plots, similar to that shown for in vitro cysts (Figure S1). Figure 2a also illustrates the remarkably important effect of mural growth rate on cyst volume. It is instructive to note that the volume of a cyst growing at 5 or 10% per year would be < 1 cm3 after 50 years. However, as mean growth rates increase above 10%, there are astonishing increases in cyst size owing to the compounding effect of exponential growth. Figure 2a illustrates that mean individual cyst growth rates exceeding 20–25% per year would be required to account for cysts that exceed 1 cm3 volume in patients with ADPKD less than 25 years of age.
Figure 2. Dependence of solitary cyst and multiple cyst enlargement on proliferation (growth) rate with k varying 5–25% per year.
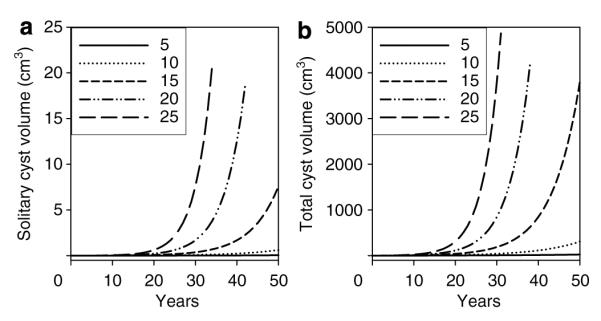
(a) Solitary cyst. (b) 500 cysts initiated at a common time and growing at a constant rate. In this and subsequent figures, the initial cysts have a diameter of 2 mm (0.0042 cm3).
Multiple cysts initiated at a single uniform time
Suppose that all of the cysts were to initiate at a common time in utero or post partum and, reaching 0.0042 cm3 volume or there-abouts, separate from the tubule of origin. Assuming that subsequent enlargement was dependent only on mural cell proliferation, the TCV would be the sum of individual cyst volumes (Vi),
Figure 2b illustrates the uniform expansion of 500 individual cysts initiated on a common date (baseline) and growing over several years at the same rate. Non-cystic parenchyma and the collecting system are not considered in the model. Figure 2b illustrates that multiple cysts growing at the same rate ranging from 5 to 25% per year retain the exponential form shown in Figure 2a for solitary cysts.
Continuous formation of cysts with a constant growth rate
Computed tomography scan measurements in ADPKD confirm that the volumes of small and large individual cysts increase with advancing age.27 Finding tiny cysts among large cysts at any stage of the disease suggests that cyst formation continues as patients age, a view supported by a recent extension of the CRISP study.8 Heterogeneous, not uniform, distribution of cyst sizes is the typical pattern observed in computed tomography and magnetic resonance scans of most adult ADPKD patients.28,29
Consider that for several cysts starting at different times with individual volume growth rates of k, the composite rate of increase in V is piecewise exponential,
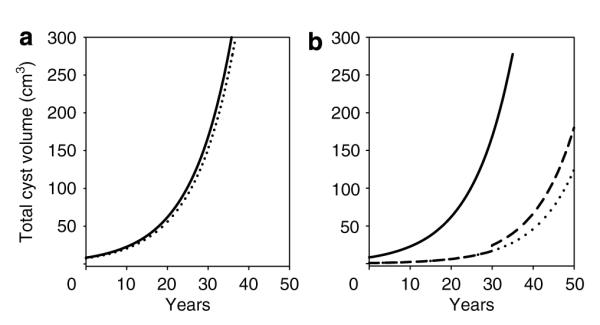
where the factor Cn(t) depends on start times and initial volumes of cysts and is defined in Appendix 2. The effect on TCV of the annual addition of 40, 80, or 160 cysts, each enlarging at a rate of 10% per year, is illustrated in Figure 3a. As in previous examples, the curves have an exponential form and further, assuming similar and constant rates of individual cyst growth, indicate that kidneys with the most rapid rates of cyst formation are fated to swell at the fastest rates.
Figure 3. Dependence of combined cyst enlargement on time of initiation and variable growth rates of individual cysts.

(a) Appearance of kidney enlarged by cysts initiated on different dates and growing at the same rate. TCV time course patterns when 40, 80, or 160 cysts are initiated each year and grow at 10% per year. (b) Effect of different cyst growth rates (k = 2.5, 5, 7.5% per year) on configuration of TCV growth curves. All cysts initiated on uniform date, t = 0; 5000 cysts divided equally among three growth rates. Composite curves include all three growth rates. (c) Cysts added at a constant rate for 50 years up to a total of 5000 cysts, growing at three different growth rates (k = 2.5, 5, 7.5% per year). Ordinate values for C are the same as for B. Composite curves include all three growth rates.
Cyst number
The number of cysts in a polycystic kidney is an important determinant of how large the organ may eventually become. As shown in Figure 3a, at age 50, there are more cysts in the kidneys generating them at the rate of 160 per year (8000 total) and the kidneys are larger, than in the kidney generating cysts at 40 per year (2000 total). And irrespective of whether or not cyst number increased continuously, the relation between TCV and age retained an exponential form.
Continuous formation of cysts with varying growth rates
It is unlikely that all cysts within a polycystic kidney grow at the same rate. Each cyst represents the clonal growth of cells with distinct genetic and phenotypic characteristics. Suppose that cysts generated on a uniform date exhibit different individual rates of constant growth, then;
where ki is the growth rate constant for the ith group of cysts. In Figure 3b, 5000 cysts were equally divided into three groups (1666 each), initiated on a uniform date, t=0, with constant individual cyst growth rates of 2.5, 5.0, and 7.5% per year. TCV was greater than 0 since the volume of each of the 5000 individual cysts was 0.0042 cm3 initially. Each growth rate generated a unique curve with an exponential form, and the composite of all growth rates mimicked an exponential as well. This illustration reiterates that cyst growth rate is a powerful determinant of TCV as the composite curve incorporating all three rates of growth was dominated by the cysts growing at the fastest rate, 7.5% per year.
In the next iteration, three equal groups of cysts (1666 each) were generated at a constant tempo from age 0 to 50 years, each growing at constant rates of 2.5, 5.0, or 7.5% per year. As seen in Figure 3c, the relation between TCV and age for each cyst growth rate was curvilinear, and the composite of all three growth rates mimicked an exponential as well. After 50 years, TCV in Figure 3b was higher in each case than in Figure 3c because there were more cysts.
Punctuated cyst formation
In the previous models, cyst initiation was viewed as either an all or none embryonic event or as a process in which cysts were continuously added throughout life. In the light of the underlying assumptions, in both of these cases exponential-like enlargement of TCV was expected. However, cysts might initiate in bursts, rather than being evenly paced throughout life. Thus, we analyzed TCV in a case in which an acquired event forced a large wave of cyst formation at 30 years of age. Figure 4a illustrates a kidney in which 2000 cysts were initiated at t=0 (solid line) and another kidney in which 1800 cysts were initiated at t=0 and 200 were added at 30 years of age (dotted line). The punctuated addition of 200 cysts had minimal impact because of the overwhelming effect on volume of cysts that had been enlarging for 30 years.
Figure 4. Punctuated cyst formation.
(a) Solid line, 2000 cysts initiated at t = 0. Dotted line, 1800 cysts initiated at t = 0 and 200 at age 30. (b) Solid line, 2000 cysts initiated at t = 0; Dashed line, 200 cysts initiated at t = 0 and 1800 more added at 30 years of age. Dotted line extends 200 cyst plot. All cysts grew at 10% per year.
Conversely, Figure 4b shows the effect of initiating 200 cysts at t=0 and the addition of 1800 cysts at 30 years of age (dashed line) compared to the effect of 2000 cysts initiated at t=0 (solid line). The punctuated addition of a large number of cysts created a small discontinuity in the TCV growth curve; however, in a practical case, the change in slope would probably be obscured since the superimposition of a relatively small volume increase would be difficult to detect in the noise of the clinical measurement and the growth curve would appear exponential. Thus, punctuated cyst formation would not have a significant effect on the appearance of the TCV growth curve.
Effect of cyst loss
One must also consider the life span of individual cysts and the contribution that cyst collapse may make to the relation between TCV, TKV, and age. Cysts are known to rupture and decompress in patients with ADPKD and this might contribute to momentary changes in the rate at which TCV and TKV increase. Experience with the CRISP cohort indicates there is a very small rate of cyst loss in ADPKD. Consequently, we do not think that cyst loss contributes appreciably to the configuration of the TCV and TKV growth curves and we have not included a cyst-loss function in the model.
A test of exponential cyst and kidney growth in the CRISP cohort
In the initial CRISP study, three or four cyst and kidney volume measurements were made over a 3-year interval in most subjects. Examination of the relation between volume and time for the entire cohort gave the impression that the course of size progression was exponential (Figures 5a and 6a).13 To test this hypothesis, we analyzed the TCV and TKV growth curves of 224 ADPKD patients in the CRISP study to determine the extent to which renal growth in each CRISP patient mimicked an exponential form. We logarithmically transformed the TCV and TKV versus time data and determined the extent to which the volume intercept at age 18, an age that renal developmental growth normally stops, agreed with a data set from 18-year olds with ADPKD. We established the target 18-year-old ‘window’ of the intercept by determining TCV and TKV for 21 CRISP subjects who had 18-year-old birthdays while in the study. TCV and TKV were determined by log linear regression for each subject. Mean TCV was 222±187 cm3, range 2.8–692 cm3 and mean TKV was 643±257 cm3, range 276–1341 cm3. These 21 subjects were not included in the subsequent analysis.
Figure 5. Time-course plots of TCV growth curves.
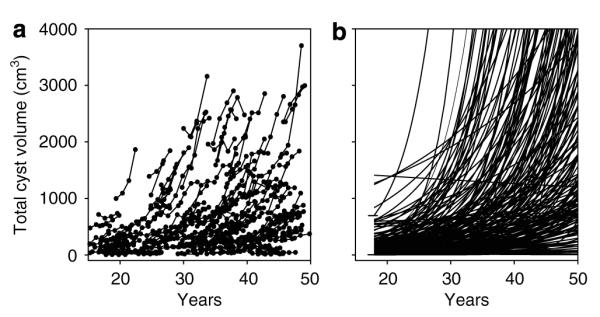
(a) Original TCV data from CRISP cohort. (b) Curves extrapolated from 3 to 4 measurements over 3 years in 203 CRISP patients. The intercept window of TCV determined in 21 subjects at 18 years of age (2.8–692 cm3) is shown by horizontal lines.
Figure 6. Time-course plots of TKV growth curves.
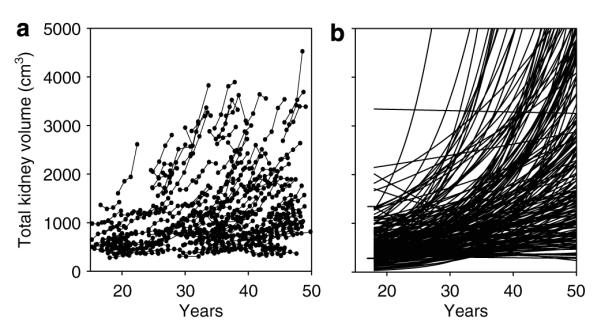
(a) Original TKV data from CRISP cohort. (b) Curves extrapolated from 3 to 4 measurements over 3 years in 203 CRISP patients. The intercept window of TCV determined in 21 subjects at 18 years of age (276–1341 cm3) is shown by horizontal lines.
We examined in conventional form curves derived from logarithmic transformed TCV time-course plots extrapolated from age 50 to 18 in 203 subjects in whom at least three annual volume measurements were made (Figure 5). The original plots of TCV versus age, determined from T2-weighted magnetic resonance images, are shown in Figure 5a and the extrapolated curves are shown in Figure 5b. The intercepts of 188 of 203 (92.6%) extrapolated curves fell within the window (2.8–692 cm3) set by the18-year-old subjects. The intercepts of 10 fell above this window and 5 fell below. The mean intercept with the TCV axis at age 18 of the 203 subjects was 221 cm3, which agrees favorably with the mean of measured TCV in 21 subjects (222 cm3). This finding is consonant with the view that in most ADPKD patients, the expansion of TCV follows an exponential-like growth pattern over the adult portion of life.
We sought further confirmation of this finding. The measurement of TKV in CRISP utilized the T1 magnetic resonance format, and therefore yielded growth data independent of the TCV determinations. Analysis of the TKV data is complicated, however, by the inclusion in the measurement of a relatively large non-cyst component ascribed to normal parenchyma, vasculature, and the intrarenal collecting system. Evidence from CRISP13 and a recent computed tomography study30 indicated that this non-cyst component may decrease slightly over time, but that the absolute change would be relatively small. Thus, we considered that TKV = TCV is NCV, where NCV (non-cyst volume) a constant, and TKV would increase pari passu with TCV. On this basis, we determined how closely the extrapolation of logarithmically transformed TKV data in CRISP approximated the TKV intercept target set by 18-year-old subjects with ADPKD. As shown in Figure 6b, 72.9% of the TKV intercepts of 203 subjects fell within the TKV window (276–1341 cm3) set by the 18-year-old CRISP patients. The intercepts of six fell above this window and 49 fell below. The mean intercept with the TKV axis at age 18 of the 203 subjects was 540 cm3 in comparison to the actual measurements in 21 subjects, 643 cm3. The slopes of 14 subjects were slightly negative, although most of these were indistinguishable from a slope of 0.
DISCUSSION
Cyst formation within a morphologically normal segment of renal tubule appears to be a multistep process. The first step commences with the inheritance of a mutated PKD1 or PKD2 gene or upon spontaneous mutation of a PKD gene within the fertilized germ cell. The second step requires a somatic mutation of the normal ADPKD allele or the imposition of another constitutively active process that causes focal transformation of individual renal tubule epithelial cells to a proliferative phenotype. The ultimate size of the kidneys is determined by the pace at which cysts are formed, the total number of cysts, and most important, the rate of net cellular growth within the individual cysts.
The results of the current analysis focused on the early stages of cyst and kidney growth before the imposition of scarring and other secondary effects. The absolute number of cysts and their rate of formation are obviously important determinants of the rate of disease progression and are potential targets for therapeutic intervention. In the CRISP cohort, the kidneys of individuals with PKD1 were 47% larger than the kidneys of patients with PKD2.8 However, the mean rates of TCV and TKV growth were not significantly different between the PKD1 and PKD2 subgroups suggesting that PKD1 kidneys harbored more cysts than PKD2 kidneys. Direct counting confirmed that 64% more cysts were found in PKD1 kidneys than in PKD2 kidneys.
Although cyst number is important, disease morbidity is directly related to cyst enlargement. The current study brings into clearer view the remarkable power of cellular proliferation and cyst growth rate on the speed of renal enlargement. Figure 2a illustrates the mean rate of growth for solitary cysts at any point in time. Assuming formation in the embryonic period, a cyst 2 cm in diameter (4.2 cm3) in a 25-year-old patient would reflect a mean growth rate of ∼25% per year; in a 45-year-old patient a 2 cm cyst would reflect a mean growth rate closer to 15% per year. By contrast, cysts growing at 10% per year or less would not reach 1 cm3 in volume in 50 years. Furthermore, it is instructive to compare the relative effects of cyst number and cyst growth rate on the change in TCV. Doubling the number of new cysts from 40 to 80 per year increased TCV from 213.6 to 427.1 cm3 at age 50, that is doubling the number of cysts doubled the TCV (Figure 3a). By contrast, a doubling of the cyst growth rate from 5 to 10% per year increased TCV from 25.5 to 310.8 cm3 at age 50, a 12.1-fold difference (Figure 2b). Thus, the power of exponential compounding elevates cyst growth rate as a critical factor in the determination of TCV and TKV.
A major goal of the current study was to develop a rationale for testing the hypothesis that the composite rate of total cyst growth in ADPKD patients reflects an exponential growth process originating in individual cysts. We demonstrated in models that as long as individual cysts grew at a relatively constant rate, kidneys comprised of innumerable cysts initiated at different times and growing at different rates would exhibit composite cyst growth curves resembling exponential form. In other words, the rate of cyst growth was dependent to a major extent on the growth rate of the mural epithelium within them. To test this hypothesis, we adopted the simplest model by assuming that cyst volume was 0.0042 cm3 at initiation, the cysts remained spherical and enlarged at a constant rate over the life of the patient. We formally tested the hypothesis utilizing data from the CRISP cohort comprised of individuals with normal glomerular filtration rate levels on admission, none of whom developed renal insufficiency in the course of the study.
We were surprised to discover that reverse extrapolation of cyst volume data predicted TCVs at age 18 that in most of the subjects fell within a range predicted by direct measurements in a separate cohort of patients (Figure 5b). This finding was aided by the fact that the correlation between TCV and time in the vast majority of adults was excellent, consistent with an orderly expansion process. The kinetic analysis of TCV was supported in the contemporaneous measurements of TKV by an independent method. Reverse extrapolation of the TKV intercepts fell within the 18-year-old target in a sizable majority (Figure 6b). The exponential-like form of the extrapolated TKV plot in Figure 6b suggests that the principal non-cyst components of TKV (normal parenchyma, collecting system) remains relatively constant and that the exponential-like form is primarily due to the changing volume of the cystic component. Taken together, these findings, and the prior observation that kidney pairs of individual patients enlarged at approximately the same rate,2,13 provides strong support for the view that cystic kidneys are comprised of autonomous cysts subject to a type of ‘programmed’ growth.
We have also learned that as long as individual cysts in a kidney grow at a relatively constant mean rate, the exponential character of the TCV growth curve is maintained even if cysts are added continuously or in boluses. Within these constraints, cysts may grow at different rates, yet in the aggregate they will generate a TCV time course that appears exponential. The exponential form of the renal growth curves is important because it strongly indicates that the change in cyst and kidney volume is dependent upon the sustained increase in cyst mural epithelial cells. Welling and Welling31,32 demonstrated that cyst expansion tied only to distention of the renal tubule with fluid would reach a saturation point when tubule diameter reached ∼200 μm. Thus, the accumulation of fluid derived from the glomerular filtrate or secreted by the mural epithelial cells would be insufficient alone to cause expansion of the tubules to several centimeters in diameter. Rather, new cells and tubule basement membrane would have to be added to create a macroscopic cyst. In a scanning electron microscope study of cyst apical surfaces, evidence was found that tiny and large cysts were comprised of mural cells approximately the same size as normal tubule epithelial cells, reinforcing the hypothesis that renal cysts were products of neoplasia.10
In the CRISP study, mean rates of TCV change reached as high as 44% per year consistent with doubling in ∼1.6 years. Although this may seem rapid in the context of renal enlargement, the doubling time is excessively long when viewed in relation to the growth of renal cells in vitro or malignant tumors in situ. Cysts generated from ADPKD mural cells and MDCK cells in hydrated collagen gels double their volume in approximately 24–36 h when stimulated with cyclic AMP agonists,18,19 approximately two orders of magnitude faster than the most rapidly expanding mean TCV in CRISP. When one considers that most of the volume of cysts is fluid rather than cells, the gap between the growth of the mural cells lining cysts and the cells comprising solid tumor masses is emphasized further. Additionally, owing to geometry, the growth rate reflected in the change of cyst surface area would be reduced by 33.3% in comparison to cyst volume. Thus, the rate of mural epithelial cell growth mirrored in the cyst volume growth curves is very slow in comparison to malignant disorders such as bronchogenic carcinoma26 and renal cell carcinoma.33
Figures 5 and 6 show that the rates of increase in TCV and TKV varied widely among individual patients, but remained relatively constant within individual subjects. Thus, each patient appears to have a ‘signature’ rate of cyst and kidney growth. How a similar and relatively constant mean rate of TCV growth is maintained in both kidneys is not known; however, several factors should be considered: (1) in individual patients, all cysts might grow at the same rate, the difference in cyst size reflecting different initiation dates. This seems unlikely since the direct measurement of sequential cyst diameters in computed tomography scans from a few subjects do not appear to support such a mechanism;27 (2) the range of basal cell growth rates among cysts within ADPKD kidneys may be determined by genetic factors other than PKD1/PKD2 mutations and reflected in the mean rate of TCV; (3) the older cysts will dominate TCV and TKV, obscuring contributions to growth of smaller cysts. This may be the case in those kidneys with low rates of cyst initiation and relatively few cysts but is an unlikely explanation in kidneys containing myriads of cysts less than 1 cm in diameter; and (4) cyst growth may be ‘clamped’ by hormones or autocoids that activate adenylyl cyclase to synthesize cyclic AMP. There is abundant new evidence to indicate that cyclic AMP importantly regulates the rate of cell proliferation and fluid accumulation in renal cysts of patients with ADPKD and ARPKD.34–37 Adenylyl cyclase is activated by vasopressin in response to changes in water balance. Normal persons, who are naturally antidiuretic, have plasma levels of vasopressin that persistently activate adenylyl cyclase. Only when large volumes of liquid are consumed, usually over short intervals of time, do plasma vasopressin levels decrease enough to render the urine more dilute than plasma. Thus, patients are under the influence of vasopressin most of the day and cyst epithelial cells are persistently stimulated to proliferate.
A body of evidence supports the hypothesis that cyst formation and expansion are largely responsible for the eventual decrease in GFR experienced by most patients with ADPKD.2,13 The fluid within the cyst cavity occupies important space and potentiates the rather slow rate of orderly proliferation by creating a tumor that is much larger than the combined mass of the proliferating cells. Whether the decreases in renal blood flow and glomerular filtration rate are mediated simply by the mechanical distortion and disruption of the intrarenal microcirculation or is due to unrecognized genetic factors is not known. What we do know is that patients with PKD1 develop renal insufficiency approximately 14–20 years earlier than those with PKD2.38 In the CRISP study, age-adjusted PKD1 subjects had larger kidneys containing more cysts than individuals with the PKD2 genotype.8 Conceivably, the reduced number of cysts might assuage the development of renal insufficiency by causing less distortion of the normal parenchyma between the cysts. Women with PKD2 appear to have a relatively low risk for developing end-stage renal disease.39 This may reflect the combined effect of a lower number of cysts associated with PKD2 mutations and slower cyst growth in females,8 and is consistent with the potential stimulatory effect of testosterone on cyclic AMP accumulation.40
In summary, this study improves our understanding of the relative roles played by cyst initiation, cyst number, and cyst growth in the creation of an expanding polycystic kidney. Our data indicate that the exponential form displayed by kidney volume change over time is the summative reflection of the aberrant cell proliferation and complementary fluid secretion going on in hundreds of cysts. The individual growth rates of solitary cysts can be approximated by determining volume from diameter. Cyst growth rates exceeding 10% per year are associated with more rapid increases in TCV and TKV. This study strengthens the view that sequential measurements of kidney volume and cyst volume and number will report the efficacy of therapeutic agents targeted to decrease the rate of mural cell proliferation.
MATERIALS AND METHODS
A portion of this study is based on the analysis of mathematical models of multiple conjoint cysts as a means of establishing the justification for a re-examination of data from the CRISP study of human subjects with ADPKD and normal glomerular filtration rate at enrollment into the study.13 Of a total of 241 patients, in 232 patients without azotemia who were 15–46 years old at baseline, annual changes in TCV and TKV were determined for 3 years. The methods used in CRISP to obtain images and to determine TCV and TKV (left and right volumes were combined) from those images have been reported in detail.1,29 In the current analysis, we included only those CRISP patients in whom three or four annual measurements had been done (224 patients).
Only descriptive statistics were used in this study.
Supplementary Material
ACKNOWLEDGMENTS
We are indebted to Mary Virginia Gaines for managerial assistance. Supported by cooperative agreements (DK56956, DK56943, DK56957, and DK56961) with the National Institutes of Diabetes and Digestive and Kidney Diseases, National Institutes of Health, and the general clinical research centers at the participating institutions (M01-RR00039, to Emory University; M01-RR00052, to the University of Alabama at Birmingham; M01-RR00585, to Mayo Clinic College of Medicine; and M01-RR023940, University of Kansas Medical Center).
Appendix 1
Assume a cyst is a sphere, then for radius r, surface area A, and volume V, we have A = 4πr2, V = (4/3)πr3, and . A cyst grows because of cell proliferation according to the relationship below:
where A is the surface area of the cyst, A0 is its surface area at time t = 0, and k’ is the rate constant (fractional growth of surface area per unit time). Solving for the function A, we obtain the following:
Using the relationships above,
Thus the volume of a spherical cyst grows exponentially with a growth rate of k = 3k’/2, where
We note that exponential growth in any one of the geometric attributes of a sphere, for example, radius, surface area, or volume, implies exponential growth in the other elements. The corresponding growth rates of the surface and the volume are related as shown above, while the rates for the radius and the surface are related as kradius = k’/2.
Appendix 2
Assume each cyst is growing at a constant rate, k, with start volume V0 (2 mm diameter), and with random start times ti (for cyst i). Each individual cyst grows according to the following equation:
where U(ti) = U(t-ti) is the unit step function, i.e., U(t) = 0 if t<0, and U(t) = 1 if t≥0.
The total volume of cysts growing at a constant rate, k, with varying start times, ti, is given by
Rewriting, we have
where
is a step function. Thus, the TCV is given by
and the growth function is a simple exponential on each interval of time between the initiation of cysts, that is, for t satisfying ti≤t<ti + 1, where i ranges from 1 to n-1. The function Cn(t) is a step function, and the effect of adding a new cyst is to shift the entire volume curve upward. The resulting total volume curve is a piecewise exponential function with a discontinuity at the initiation of each cyst.
Appendix 3
Members of the Consortium of Radiologic Imaging Studies of Polycystic Kidney Disease (CRISP) study were as follows: Steering Committee—JJ Grantham, VE Torres, AB Chapman, LM Guay-Woodford, KT Bae, BF King, LH Wetzel, PJ Kenney, JP Miller, GN Hirschman, CM Meyers, JE Bost, WM Bennett (chair); Writing Committee—JJ Grantham, VE Torres, AB Chapman, LM Guay-Woodford, KT Bae, PC Harris, CM Meyers, JP Miller, WM Bennett, S Klahr, DA Baumgarten, PJ Kenney, X Zhang, and F Zhu; Data and Collection and Analysis—JJ Grantham, VE Torres, AB Chapman, LM Guay-Woodford; Radiologic Analysis—KT Bae, BF King, LH Wetzel, PJ Kenney, DA Baumgarten; Biostatistics—JP Miller, X Zhang; JE Bost, Design and Supervision and Analysis of MRI Protocol—KT Bae, F Zhu.
Footnotes
DISCLOSURE The authors have nothing to disclose of material concern related to this body of work.
REFERENCES
- 1.Chapman AB, Guay-Woodford LM, Grantham JJ, et al. Renal structure in early autosomal-dominant polycystic kidney disease (ADPKD): the consortium for radiologic imaging studies of polycystic kidney disease (CRISP) cohort. Kidney Int. 2003;64:1035–1045. doi: 10.1046/j.1523-1755.2003.00185.x. [DOI] [PubMed] [Google Scholar]
- 2.Grantham JJ, Chapman AB, Torres VE. Volume progression in autosomal dominant polycystic kidney disease: the major factor determining clinical outcomes. Clin J Am Soc Nephrol. 2006;1:148–157. doi: 10.2215/CJN.00330705. [DOI] [PubMed] [Google Scholar]
- 3.Harris PC, Torres VE. Understanding pathogenic mechanisms in polycystic kidney disease provides clues for therapy. Curr Opin Nephrol Hypertens. 2006;15:456–463. doi: 10.1097/01.mnh.0000232888.65895.e7. [DOI] [PubMed] [Google Scholar]
- 4.MacDermot KD, Saggar-Malik AK, Economides DL, Jeffery S. Prenatal diagnosis of autosomal dominant polycystic kidney disease (PKD1) presenting in utero and prognosis for very early onset disease. J Med Genet. 1998;35:13–16. doi: 10.1136/jmg.35.1.13. [DOI] [PMC free article] [PubMed] [Google Scholar]
- 5.Jeffery S, Saggar-Malik AK, Economides DL, et al. Apparent normalisation of fetal renal size in autosomal dominant polycystic kidney disease (PKD1) Clin Genet. 1998;53:303–307. doi: 10.1111/j.1399-0004.1998.tb02701.x. [DOI] [PubMed] [Google Scholar]
- 6.Lu W, Peissel B, Babakhanlou H, et al. Perinatal lethality with kidney and pancreas defects in mice with a targetted Pkd1 mutation. Nat Genet. 1997;17:179–181. doi: 10.1038/ng1097-179. [DOI] [PubMed] [Google Scholar]
- 7.Lu W, Fan X, Basora N, et al. Late onset of renal and hepatic cysts in Pkd1-targeted heterozygotes. Nat Genet. 1999;21:160–161. doi: 10.1038/5944. [DOI] [PubMed] [Google Scholar]
- 8.Harris PC, Bae KT, Rossetti S, et al. Cyst number but not the rate of cystic growth is associated with the mutated gene in autosomal dominant polycystic kidney disease. J Am Soc Nephrol. 2006;17:3013–3019. doi: 10.1681/ASN.2006080835. [DOI] [PubMed] [Google Scholar]
- 9.Evan AP, McAteer JA. Cyst cells and cyst walls. In: Gardner KDJ, Bernstein J, editors. The Cystic Kidney. Kluwer; Boston: 1990. pp. 21–42. [Google Scholar]
- 10.Grantham JJ, Geiser JL, Evan AP. Cyst formation and growth in autosomal dominant polycystic kidney disease. Kidney Int. 1987;31:1145–1152. doi: 10.1038/ki.1987.121. [DOI] [PubMed] [Google Scholar]
- 11.Grantham JJ. Polycystic kidney disease: neoplasia in disguise. Am J Kidney Dis. 1990;15:110–116. doi: 10.1016/s0272-6386(12)80507-5. [DOI] [PubMed] [Google Scholar]
- 12.Harris PC, Watson ML. Autosomal dominant polycystic kidney disease: neoplasia in disguise? Nephrol Dial Transplant. 1997;12:1089–1090. doi: 10.1093/ndt/12.6.1089. [DOI] [PubMed] [Google Scholar]
- 13.Grantham JJ, Torres VE, Chapman AB, et al. Volume progression in polycystic kidney disease. N Engl J Med. 2006;354:2122–2130. doi: 10.1056/NEJMoa054341. [DOI] [PubMed] [Google Scholar]
- 14.Qian F, Watnick TJ, Onuchic LF, Germino GG. The molecular basis of focal cyst formation in human autosomal dominant polycystic kidney disease type I. Cell. 1996;87:979–987. doi: 10.1016/s0092-8674(00)81793-6. [DOI] [PubMed] [Google Scholar]
- 15.Brasier JL, Henske EP. Loss of the polycystic kidney disease (PKD1) region of chromosome 16p13 in renal cyst cells supports a loss-of-function model for cyst pathogenesis. J Clin Invest. 1997;99:194–199. doi: 10.1172/JCI119147. [DOI] [PMC free article] [PubMed] [Google Scholar]
- 16.EL-Merhi FM, Bae KT. Cystic renal disease. Magn Reson Imaging Clin N Am. 2004;12:449–467. doi: 10.1016/j.mric.2004.03.009. [DOI] [PubMed] [Google Scholar]
- 17.Mangoo-Karim R, Uchic M, Lechene C, Grantham JJ. Renal epithelial cyst formation and enlargement in vitro: dependence on cAMP. Proc Natl Acad Sci USA. 1989;86:6007–6011. doi: 10.1073/pnas.86.15.6007. [DOI] [PMC free article] [PubMed] [Google Scholar]
- 18.Grantham JJ, Uchic M, Cragoe EJ, Jr, et al. Chemical modification of cell proliferation and fluid secretion in renal cysts. Kidney Int. 1989;35:1379–1389. doi: 10.1038/ki.1989.137. [DOI] [PubMed] [Google Scholar]
- 19.Sullivan LP, Wallace DP, Gover T, et al. Sulfonylurea-sensitive K(+) transport is involved in Cl(-) secretion and cyst growth by cultured ADPKD cells. J Am Soc Nephrol. 2002;13:2619–2627. doi: 10.1097/01.asn.0000034220.09301.9c. [DOI] [PubMed] [Google Scholar]
- 20.Sullivan LP, Wallace DP, Grantham JJ. Epithelial transport in polycystic kidney disease. Physiol Rev. 1998;78:1165–1191. doi: 10.1152/physrev.1998.78.4.1165. [DOI] [PubMed] [Google Scholar]
- 21.Wallace DP, Christensen M, Reif G, et al. Electrolyte and fluid secretion by cultured human inner medullary collecting duct cells. Am J Physiol Renal Physiol. 2002;283:F1337–F1350. doi: 10.1152/ajprenal.00165.2002. [DOI] [PubMed] [Google Scholar]
- 22.Wallace DP, Grantham JJ, Sullivan LP. Chloride and fluid secretion by cultured human polycystic kidney cells. Kidney Int. 1996;50:1327–1336. doi: 10.1038/ki.1996.445. [DOI] [PubMed] [Google Scholar]
- 23.Cuppage FE, Huseman RA, Chapman A, Grantham JJ. Ultrastructure and function of cysts from human adult polycystic kidneys. Kidney Int. 1980;17:372–381. doi: 10.1038/ki.1980.43. [DOI] [PubMed] [Google Scholar]
- 24.Huseman R, Grady A, Welling D, Grantham J. Macropuncture study of polycystic disease in adult human kidneys. Kidney Int. 1980;18:375–385. doi: 10.1038/ki.1980.148. [DOI] [PubMed] [Google Scholar]
- 25.Grantham JJ. Lillian Jean Kaplan International Prize for advancement in the understanding of polycystic kidney disease. Understanding polycystic kidney disease: a systems biology approach. Kidney Int. 2003;64:1157–1162. doi: 10.1046/j.1523-1755.2003.00242.x. [DOI] [PubMed] [Google Scholar]
- 26.Mehrara E, Forssell-Aronsson E, Ahlman H, Bernhardt P. Specific growth rate versus doubling time for quantitative characterization of tumor growth rate. Cancer Res. 2007;67:3970–3975. doi: 10.1158/0008-5472.CAN-06-3822. [DOI] [PubMed] [Google Scholar]
- 27.Sise C, Kusaka M, Wetzel LH, et al. Volumetric determination of progression in autosomal dominant polycystic kidney disease by computed tomography. Kidney Int. 2000;58:2492–2501. doi: 10.1046/j.1523-1755.2000.00433.x. [DOI] [PubMed] [Google Scholar]
- 28.Levine E, Grantham JJ. The role of computed tomography in the evaluation of adult polycystic kidney disease. Am J Kidney Dis. 1981;1:99–105. doi: 10.1016/s0272-6386(81)80036-4. [DOI] [PubMed] [Google Scholar]
- 29.Bae KT, Commean PK, Lee J. Volumetric measurement of renal cysts and parenchyma using MRI: phantoms and patients with polycystic kidney disease. J Comput Assist Tomogr. 2000;24:614–619. doi: 10.1097/00004728-200007000-00019. [DOI] [PubMed] [Google Scholar]
- 30.Ruggenenti P, Remuzzi A, Ondei P, et al. Safety and efficacy of long-acting somatostatin treatment in autosomal-dominant polycystic kidney disease. Kidney Int. 2005;68:206–216. doi: 10.1111/j.1523-1755.2005.00395.x. [DOI] [PubMed] [Google Scholar]
- 31.Welling LW, Welling DJ. Theoretical models of cyst formation and growth. Scanning Microsc. 1988;2:1097–1102. [PubMed] [Google Scholar]
- 32.Welling LW, Welling DJ. Kinetics of cyst development in cystic renal disease. In: Cummings NB, Klahr S, editors. Chronic Renal Disease. Plenum Medical Book Company; New York: 1985. pp. 95–103. [Google Scholar]
- 33.Ozono S, Miyao N, Igarashi T, et al. Tumor doubling time of renal cell carcinoma measured by CT: collaboration of Japanese society of renal cancer. Jpn J Clin Oncol. 2004;34:82–85. doi: 10.1093/jjco/hyh011. [DOI] [PubMed] [Google Scholar]
- 34.Belibi FA, Reif G, Wallace DP, et al. Cyclic AMP promotes growth and secretion in human polycystic kidney epithelial cells. Kidney Int. 2004;66:964–973. doi: 10.1111/j.1523-1755.2004.00843.x. [DOI] [PubMed] [Google Scholar]
- 35.Yamaguchi T, Nagao S, Wallace DP, et al. Cyclic AMP activates B-Raf and ERK in cyst epithelial cells from autosomal-dominant polycystic kidneys. Kidney Int. 2003;63:1983–1994. doi: 10.1046/j.1523-1755.2003.00023.x. [DOI] [PubMed] [Google Scholar]
- 36.Yamaguchi T, Pelling JC, Ramaswamy NT, et al. cAMP stimulates the in vitro proliferation of renal cyst epithelial cells by activating the extracellular signal-regulated kinase pathway. Kidney Int. 2000;57:1460–1471. doi: 10.1046/j.1523-1755.2000.00991.x. [DOI] [PubMed] [Google Scholar]
- 37.Gattone VH, II, Wang X, Harris PC, Torres VE. Inhibition of renal cystic disease development and progression by a vasopressin V2 receptor antagonist. Nat Med. 2003;9:1323–1326. doi: 10.1038/nm935. [DOI] [PubMed] [Google Scholar]
- 38.Hateboer N, Dijk MA, Bogdanova N, et al. Comparison of phenotypes of polycystic kidney disease types 1 and 2. European PKD1-PKD2 study group. Lancet. 1999;353:103–107. doi: 10.1016/s0140-6736(98)03495-3. [DOI] [PubMed] [Google Scholar]
- 39.Magistroni R, He N, Wang K, et al. Genotype-renal function correlation in type 2 autosomal dominant polycystic kidney disease. J Am Soc Nephrol. 2003;14:1164–1174. doi: 10.1097/01.asn.0000061774.90975.25. [DOI] [PubMed] [Google Scholar]
- 40.Sandhu S, Silbiger SR, Lei J, Neugarten J. Effects of sex hormones on fluid and solute transport in Madin—Darby canine kidney cells. Kidney Int. 1997;51:1535–1539. doi: 10.1038/ki.1997.211. [DOI] [PubMed] [Google Scholar]
Associated Data
This section collects any data citations, data availability statements, or supplementary materials included in this article.