

Abstract
The recently discovered impact of oligomerization on G-protein coupled receptor (GPCR) function further complicates the already challenging goal of unraveling the molecular and dynamic mechanisms of these receptors. To help understand the effect of oligomerization on the dynamics of GPCRs, we have compared the motion of monomeric, dimeric, and tetrameric arrangements of the prototypic GPCR rhodopsin, using an approximate—yet powerful—normal mode analysis (NMA) technique termed elastic network model (ENM). Moreover, we have used ENM to discriminate between putative dynamic mechanisms likely to account for the recently observed conformational rearrangement of the TM4,5-TM4,5 dimerization interface of GPCRs that occurs upon activation. Our results indicate: (1) significant perturbation of the normal modes (NMs) of the rhodopsin monomer upon oligomerization, which is mainly manifested at interfacial regions; (2) increased positive correlation among the transmem-brane domains (TMs) and between the extracellular loop (EL) and TM regions of the rhodopsin protomer; (3) highest inter-residue positive correlation at the interfaces between protomers; and (4) experimentally testable hypotheses of differential motional changes within different putative oligomeric arrangements.
Keywords: elastic network model, GPCRs, rhodopsin, complexation, dimerization, correlation, activation, coarse grained, interface
INTRODUCTION
G protein-coupled receptors (GPCRs) are members of the largest known family of cell-surface receptors involved in the signal transduction of a large variety of extracellular stimuli, including biogenic amines, hormones, neuro-transmitters, odorants, and light. These membrane receptors are validated drug targets for 40–60% of approved drugs, which elicit their therapeutic effects by selectively addressing members of the GPCR family.1 Most of the therapeutics that are directed towards GPCRs have been designed following the assumption that these receptors function as single monomeric units.2 The discovery that several GPCRs form homo-oligomeric and hetero-oligomeric complexes with unexpected pharmacological properties offers a new perspective to rational drug design. In fact, ligand binding to one or more GPCRs is expected to induce the activation of neighboring receptors in the oligomeric complex, giving rise to a cascade of interlacing signaling events. This new perspective has focused attention on the need to study dynamic three-dimensional (3D) models of oligomeric GPCRs to understand the structural details of the molecular mechanisms associated with ligand-induced activation of GPCR oligomers, and concurrently develop new drugs.2-4
The first 3D molecular model of a GPCR oligomer was proposed by Liang et al.5 (PDB: 1N3M) using data from atomic force microscopy maps of rhodopsin in its native disk membrane.6 This model showed an arrangement of rhodopsin molecules in two dimensional arrays of dimers. In this arrangement, TM4, TM5, and the intracellular loop connecting TM3 and TM4 (IL2) are involved in intradimeric interactions, while TM1, TM2, and the intracellular loop connecting TM5 and TM6 (IL3) are involved in interdimeric interactions. Cross-linking studies of dopamine D2 receptor (D2DR) homo-dimers carried out by Javitch and coworkers7 supported the 1N3M intradimeric interface by showing that residue C168 (4.68 in Ballesteros and Weinstein generic numbering8) at the extracellular end of TM4 forms a copper phenanthroline-induced disulfide cross-link, consistent with the hypothesis that TM4 corresponds to a symmetrical interface in D2DR receptor dimers. Further support to the intradimeric interface of the 1N3M model was provided by FRET and cross-linking studies of opsin molecules in COS1 cells,9 showing that amino acids at the dimer interface of opsin molecules include residues on the extracellular end of TM5, as well as within the extracellular loop connecting TM4 and TM5 (EL2).
Additional cross-linking data of cysteine mutants at the D2DR homo-dimer interface in the presence of agonists and inverse agonists10 suggested the occurrence of a conformational rearrangement of the dimer interface upon receptor activation. Specifically, agonists accelerated crosslinking of a set of residues on a different TM4 face than the one preferred by the inverse agonist, while diminished crosslinking was recorded for residues on the interface preferred by the inverse agonist. Thus, the TM4 dimer interface of the inverse agonist-bound D2DR homo-dimer, which is consistent with the 1N3M intradimeric interface of rhodopsin5 [Fig. 1(A)], rearranges into an alternative TM4 interface corresponding to the agonist-bound conformation of the D2DR dimer. At least three different dynamic mechanisms can account for this conformational rearrangement.10 As viewed from the intracellular side of the membrane, these rearrangements are: (1) a simple rigid body clockwise rotation of contacting TM4s along their own helical axes [Fig. 1(B)], (2) a displacement of the protomers [i.e. clockwise rotation of each protomer involved in intra-dimeric interaction along the membrane axis; Fig. 1(C)], or (3) an exchange of partners in the array of protomers [i.e. clockwise rotation of each protomer involved in intradimeric interaction followed by their sliding within the array; Fig. 1(D)].
Figure 1.

(A) Intracellular view of the 1N3M tetrameric arrangement. Protomer A is shown in red, B in cyan, C in green, and D in blue. (B) Activated interface model obtained by clockwise rotations of contacting TM4 helices along their own helical axes; (C) Activated interface model obtained by protomer displacement (i.e. clockwise rotation of each protomer involved in intradimeric interaction along the membrane axis; and (D) Activated interface model obtained by protomer exchange (i.e. clockwise rotation of each protomer involved in intradimeric interaction followed by their sliding within the array).
To explore the specifics of the interface dynamics of GPCR dimers, we recently compared nanosecond time-scale molecular dynamics (MD) simulations of a rhodopsin monomer in a bilayer membrane model with those of a dimer in the same model environment.11 Combined essential dynamics of these simulations showed that the most pronounced changes within the transmembrane region of the rhodopsin dimer occurred at the dimerization interface. Albeit consonant with the rearrangement of the dimer interface observed for the cognate dopamine D2 receptor,10 the results of these simulations do not allow discriminating among the different dynamic mechanisms that could account for such a conformational rearrangement. In fact, calculations were limited by the system size and submicrosecond time scales accessible with current computer hardware and algorithms.
An alternative important class of methods for studying protein motion is based on frequency analysis. An early example is the now classic method of Normal Mode (harmonic) Analysis (NMA) by Go and Scheraga.12 An approximate yet powerful NMA technique is termed elastic network model (ENM). This technique has been used to elucidate in an efficient and rapid manner the natural vibrations of large molecular systems, as well as to find solutions for flexible docking, and to refine electron microscopy and X-ray diffraction structures (see 13–15 for recent reviews). We16 and others17 have recently applied ENM to study conformational changes occurring in the rhodopsin monomer upon activation.
The effect of oligomerization and the influence of different oligomeric arrangements on the dynamics of a monomeric unit have recently been investigated using NMA approaches in several biological systems,18-23 and have drawn attention to motion quenching and high correlation at the interface. In the present study, we used ENM to study the effect of oligomerization on the dynamics and interresidue correlations of rhodopsin, by comparing the lowest frequency normal modes of rhodopsin monomer (including zero frequency modes) with the lowest frequency normal modes of the 1N3M dimeric and tetrameric arrangements of rhodopsin derived from inferences from atomic force microscopy5 and cross-linking data.10 We limited our studies to the tetrameric subset of the 1N3M hexameric model because of the larger body of experimental information supporting the TM4,5-TM4,5 intradimeric interface of the 1N3M tetrameric subset. The results of these studies are described in detail in the following sections.
METHODS
Molecular systems
Carbon alpha (Cα) coordinates of inactive rhodopsin monomer, dimer, and tetramer were extracted from the hexameric model of rhodopsin molecules corresponding to the PDB ID code 1N3M.5 In this arrangement [Fig. 1(A)], intradimeric interactions (either between A and B or C and D) involve TM4, TM5, and IL2, whereas interdimeric interactions (either between A and C or B and D) involve the intracellular loop connecting TM5 and TM6 (IL3). Molecular models of activated interfaces were built based on inferences from crosslinking data of cysteine mutants at the D2DR homo-dimer interface in the presence of agonists or antagonists.10 Specifically, residues at positions exhibiting accelerated cross-linking in the presence of agonists and/or decreased cross-linking in the presence of inverse agonists (i.e., 4.50, 4.54, and 4.58) were forced to form symmetric contacts by manual docking using the InsightII suite of programs (Accelrys). As viewed from the intracellular side of the membrane, these new symmetric contacts were either formed by clockwise rotation of contacting TM4s along their own helical axes [Fig. 1(B)], or by protomer displacement [i.e. clockwise rotation of each protomer involved in intradimeric interaction along the membrane axis; Fig. 1(C)], or by protomer exchange [i.e. clockwise rotation of each protomer involved in intradimeric interaction followed by their sliding within the array; Fig. 1(D)]. Details of the differences and similarities among these three activated models of the TM4,5-TM4,5 dimerization interface as well as their differences from the 1N3M model are reported in Table I. Specifically, common interprotomeric symmetric contacts (i.e., Cα atoms within 15 Å) among the three models of the activated dimerization interface are notated with an asterisk. Interprotomeric symmetric contacts that differ from those of 1N3M are shown in bold.
Table I.
Interprotomeric Symmetric Contacts Within 15-Å Distance
| Complexes | 1N3M | TM4 Rotation | Protomer displacement | Protomer exchange |
|---|---|---|---|---|
| A-B | M143-M143 (IL2) | M143-M143 (IL2) | E150-E150 (IL2) | P7-P7 (Nterm) |
| F146-F146 (IL2) | N145-N145 (IL2) | N151-N151 (4.40) | I154-I154 (4.43)* | |
| R147-R147 (IL2) | F146-F146 (IL2) | H152-H152 (4.41) | A158-A158 (4.47) | |
| H152-H152 (4.41) | R147-R147 (IL2) | A153-A153 (4.42) | W161-W161 (4.50)* | |
| F159-F159 (4.48) | F148-F148 (IL2) | I154-I154 (4.43)* | L165-L165 (4.54)* | |
| V162-V162 (4.51) | I154-I154 (4.43)* | M155-M155 (4.44) | A169-A169 (4.58)* | |
| M163-M163 (4.52) | V157-V157 (4.46) | V157-V157 (4.46) | L172-L172 (4.61)* | |
| A166-A166 (4.55) | W161-W161 (4.50)* | A158-A158 (4.47) | V173-V173 (4.62) | |
| P170-P170 (4.59) | L165-L165 (4.54)* | W161-W161 (4.50)* | R177-R177 (EL2) | |
| T198-T198 (EL2) | A169-A169 (4.58)* | V162-V162 (4.51) | ||
| S202-S202 (5.37) | L172-L172 (4.61)* | L165-L165 (4.54)* | ||
| F203-F203 (5.38) | W175-W175 (EL2) | A169-A169 (4.58)* | ||
| E196-E196 (EL2) | P170-P170 (4.59) | |||
| E197-E197 (El2) | P171-P171 (4.60) | |||
| T198-T198 (EL2) | L172-L172 (4.61)* | |||
| N199-N199 (EL2) | V173-V173 (4.62) | |||
| S202-S202 (5.37) | ||||
| F203-F203 (5.38) | ||||
| Y206-Y206 (5.41) | ||||
| V210-V210 (5.45) | ||||
| B-C | C140-C140 (IL2) | I217-I217 (5.52) | I133-I133 (3.48) | |
| F221-F221 (5.56) | F221-F221 (5.56) | V137-V137 (3.52) | ||
| Q225-Q225 (5.60) | Q225-Q225 (5.60) | M143-M143 (IL2) | ||
| S144-S144 (IL2) | ||||
| N145-N145 (IL2) | ||||
| F146-F146 (IL2) | ||||
| R147-R147 (IL2) | ||||
| F148-F148 (IL2) | ||||
| H152-H152 (4.41) | ||||
| M163-M163 (4.52) | ||||
| P194-P194 (EL2) | ||||
| E196-E196 (EL2) | ||||
| N199-N199 (EL2) | ||||
| N200-N200 (5.40) | ||||
| E201-E201 (5.41) | ||||
| S202-S202 (5.37) | ||||
| F203-F203 (5.38) | ||||
| V204-V204 (5.39) | ||||
| I205-I205 (5.40) | ||||
| Y206-Y206 (5.41) | ||||
| M207-M207 (5.42) | ||||
| V209-V209 (5.44) | ||||
| H210-H210 (5.45) | ||||
| F211-F211 (5.46) | ||||
| I214-I214 (5.49) | ||||
| C-D | N145-N145 (IL2) | M143-M143 (IL2) | E150-E150 (IL2) | I154-I154 (4.43)* |
| F148-F148 (IL2) | N145-N145 (IL2) | N151-N151 (4.40) | A158-A158 (4.47) | |
| M155-M155 (4.44) | F146-F146 (IL2) | H152-H152 (4.41) | W161-W161 (4.50)* | |
| W175-W175 (EL2) | R147-R147 (IL2) | A153-A153 (4.42) | L165-L165 (4.54)* | |
| E196-E196 (EL2) | F148-F148 (IL2) | I154-I154 (4.43)* | A169-A169 (4.58)* | |
| E197-E197 (El2) | I154-I154 (4.43)* | M155-M155 (4.44) | L172-L172 (4.61)* | |
| N199-N199 (EL2) | V157-V157 (4.46) | V157-V157 (4.46) | V173-V173 (4.62) | |
| Y206-Y206 (5.41) | W161-W161 (4.50)* | A158-A158 (4.47) | R177-R177 (EL2) | |
| V210-V210 (5.45) | L165-L165 (4.54)* | W161-W161 (4.50)* | ||
| I217-I217 (5.52) | A169-A169 (4.58)* | V162-V162 (4.51) | ||
| L172-L172 (4.61)* | L165-L165 (4.54)* | |||
| W175-W175 (EL2) | A169-A169 (4.58)* | |||
| E196-E196 (EL2) | P170-P170 (4.59) | |||
| E197-E197 (El2) | P171-P171 (4.60) | |||
| T198-T198 (EL2) | L172-L172 (4.61)* | |||
| N199-N199 (EL2) | V173-V173 (4.62) | |||
| S202-S202 (5.37) | ||||
| F203-F203 (5.38) | ||||
| Y206-Y206 (5.41) | ||||
| V210-V210 (5.45) |
Normal mode analysis
Normal mode analysis of rhodopsin monomer, dimer, and tetramer, as well as calculation of the contribution of individual modes of the rhodopsin tetramer to the conformational rearrangements of the 1N3M intradimeric interface was performed using NOMAD-Ref website (http://lorentz.immstr.pasteur.fr/nomad-ref.php).24 NOMAD-Ref uses Tirion’s ENM,25 where the standard potential energy function is replaced by Eq. (1):
| (1) |
In this equation, rij denotes the vector connecting Cα-atoms i and j, the zero superscript indicates the initial configuration of the Cα-atoms, RC is the spatial cutoff for interconnections between Cα atoms set to 15Å, and C is the phenomenological force constant arbitrarily set to 100 kcal/(mol Å2). The normalized eigenvectors Ui of the Hessian matrix due to Eq. (1) are the normal modes, and the eigenvalues Ωi are the squares of the associated frequencies. As the transition from one conformational state of a protein to another is likely to be described by a combination of a small number of normal modes,26-28 only the first 100 lowest frequency normal modes with increasing eigenvalues were calculated for the rhodopsin monomer, dimer, and tetramer.
The degree of similarity or overlap (Cmo) between normal mode m of the rhodopsin monomer (N residues = 343; the last five residues of the C-terminus were eliminated because they are highly fluctuating) and normal mode o of the oligomer was calculated as the scalar product of normal modes m and o using Eq. (2), below.
| (2) |
Fractional contributions of the translational and rotational motions (zero frequency modes) of the rhodopsin monomer to the nonzero low frequency modes of the protein complexes were calculated as described in Ref. 21 The degree of similarity or overlap between normal mode k and the direction of a specific unit-norm conformational change vector Δr was calculated as:
| (3) |
A cumulative overlap for n normal modes was calculated as the sum over squared overlaps, starting with the lowest-frequency nontrivial normal mode:
| (4) |
The expected residue fluctuations, which are related to B factors, were computed in MatLab (version 7, Natick, Massachusetts: The MathWorks, 2006) with the assumption that the contribution of each normal mode Uk is inversely proportional to its eigenvalue Ωk21 using the following equation:
| (5) |
where i is the residue number, j represents the cartesian coordinates, N is the number of residues, and Uki is the displacement of ith degree of freedom (coordinate of an atom) in the kth normal mode.
Correlation between residues i and j was calculated as the average correlation summed over X lowest frequency normal modes29:
| (6) |
An increasing number of normal modes were used to test correlation convergence in our system. The convergence was estimated by plotting the Euclidean norm of the correlation matrix calculated with an increasing number of normal modes using the default norm (matrix) function in MatLab. Although a very small number of low-frequency normal modes may be sufficient to describe concomitant conformational changes of structural motifs between functional states,26,27,30,31 a larger number of modes is required to study equal-time correlated motions in the NMA framework.29
RESULTS AND DISCUSSION
To provide new insights into our understanding of the molecular and dynamic mechanisms regulating GPCR association and interaction, we performed ENM analysis of the monomeric [A in Fig. 1(A)], dimeric [protomers A and B or protomers C and D in Fig. 1(A)], and tetrameric [protomers A-B-C-D in Fig. 1(A)] arrangements of rhodopsin molecules proposed by Palczewski and coworkers based on inferences from atomic force microscopy,5 as well as of our three proposed activated models of the TM4,5-TM4,5 interface (see Methods). The Cα root mean square deviations (RMSD) between the inactive model of the TM4,5-TM4,5 dimerization interface (i.e., 1N3M) and the activated interface models obtained by TM4 rotation [Fig. 1(B)], protomer displacement [Fig. 1(C)], or protomer exchange [Fig. 1(D)] are 1.5, 10.7, and 9.1 Å, respectively. Cα RMSDs between the activated models are 9–11 Å.
Individual normal modes of rhodopsin monomer are perturbed upon oligomerization
To estimate the relevance of the lowest frequency modes of the rhodopsin monomer to the dynamics of its dimeric and tetrameric complexes, we calculated the overlap between the lowest nonzero frequency normal modes of each complex with the lowest-frequency modes of the monomer (including its zero-frequency rotation-translation normal modes). The maximal overlap [Eq. (2) in Methods] between individual normal modes of the rhodopsin monomer and normal modes of the dimer and tetramer was 0.63 and 0.69, respectively (data not shown). Thus, each individual normal mode of the monomer appears to be significantly affected by oligomerization. The rigid body motions (translation/rotation) of the rhodopsin monomer, which are described by the monomer zero frequency modes, only contribute to the first few low frequency modes of the rhodopsin complexes. Figure 2 shows the fractions of translational [Fig. 2(A)] and rotational [Fig. 2(B)] motions21 of the rhodopsin monomer in the first 100 low frequency nonzero modes of the 1N3M tetrameric arrangement (green line) and the three putative activated arrangements of the TM4,5-TM4,5 interface (gray line for TM4 rotation, blue line for protomer exchange, and red line for protomer displacement). As shown in this figure, only the lowest 20–25 normal modes of the tetramer (or the lowest 10 modes of the dimer; data not shown) present contributions from the rigid body motions of the monomer. Table II summarizes the fraction of translational, rotational, and the sum of the two averaged over the first 100 lowest frequency modes calculated for the 1N3M dimeric and tetrameric models, as well as the three putative activated models of the dimeric TM4,5-TM4,5 interface. These averaged fractions21 are weighted by the eigenvalue reciprocals of the modes of each rhodopsin complex, and represent the overall monomeric rigid body motion within these complexes. As shown in the table, the 1N3M dimer and tetramer have an average of 10–12% monomeric rigid body motions, whereas the proposed activated models deriving from TM rotation, protomer displacement or protomer exchange have 7–10% monomeric rigid body motions. This overall low rigid body contribution further supports the conclusion that the monomeric modes of rhodopsin are significantly perturbed upon oligomerization.
Figure 2.

Fractions of (A) translational and (B) rotational motions21 of the rhodopsin monomer in the low frequency nonzero modes of the 1N3M tetrameric arrangement (gren line) and the three putative activated arrangements of the TM4,5-TM4,5 interface (gray line for TM4 rotation, blue line for protomer exchange, and red line for protomer displacement).
Table II.
Contribution of Monomeric Rigid Body Motions in the Different Rhodopsin Complexes Averaged Over the 100 Lowest Frequency Modes
| Rhodopsin complexa | Translational | Rotational | Sum |
|---|---|---|---|
| 1N3M Dimer | 0.022 | 0.080 | 0.102 |
| 1N3M Tetramer | 0.051 | 0.065 | 0.116 |
| TM4 Rotation | 0.050 | 0.037 | 0.087 |
| Protomer Displacement | 0.059 | 0.039 | 0.098 |
| Protomer Exchange | 0.031 | 0.037 | 0.068 |
Values shown are weighted averages,〈P〉 = (Σk P(k)/λk/Σk1/λk), where P is the fractional contribution, k is the normal mode, and λk is the eigenvalue of the kth mode of the complex.
Oligomerization affects the internal motions of GPCRs
The overall effect of oligomerization on the structure and dynamics of the rhodopsin monomer was estimated by comparison of the combined fluctuations of the Cα atoms due to the lowest frequency modes of the rhodopsin monomer, dimer, or tetramer. Figure 3A shows that fluctuations of the IL2 of the rhodopsin monomer are significantly reduced upon oligomerization. The IL2 residues 140–150 [Cα atoms of these residues are represented as spheres in Fig. 3(B)] constitute the most flexible parts of the 1N3M-like intradimeric interface of rhodopsin. Figure 3(B) illustrates the B-factors calculated for the rhodopsin dimer by color code, with blue indicating no fluctuations, and red corresponding to high fluctuations. Fluctuations of IL3 residues 226–246, which are not involved in the 1N3M-like intradimeric interface but rather in interdimeric interfaces with other protomers of the rhodopsin array (see Fig. 1), were approximately the same for the rhodopsin monomer and dimer, but reduced in the tetramer [see Fig. 3(A)]. As shown in Figure 3(A), fluctuations of all intracellular regions (the IL loops, helix 8 and the C-terminus) are quenched in the tetramer, while fluctuations of all extracellular regions (the EL loops and the N-terminus) are slightly enhanced.
Figure 3.

(A) B-factors calculated according to Eq. (5) of Materials and Methods for the first 50 lowest normal modes of rhodopsin monomer, dimer, and tetramer. (B) Vertical view of protomers A and B colored by the fluctuations calculated for the dimer, ranging from red (high fluctuations) to blue (no fluctuations). The Cα atoms of residues 140 to 150 in IL2 region are shown in VDW representation, prepared with VMD.32
Oligomerization enhances the correlation among TM regions within protomers
Additional assessment of the influence of oligomerization on the structure and dynamics of GPCR monomers was obtained from analysis of the motional correlation of all pairs of residues. Consistent with recent findings by Van Wynsberghe and Cui,29 we find that more than 1–2 lowest frequency normal modes are required for proper convergence of the interresidue motional correlation in rhodopsin. Figure 4 illustrates the dramatic changes in interresidue correlations due to the lowest nonzero frequency normal Mode 1 of the rhodopsin monomer upon inclusion of additional low frequency normal modes. Overall, both positive [color red in Fig. 4(A–D)] and negative [color blue in Fig. 4(A–D)] correlations are considerably reduced upon inclusion of an increasing number of normal modes from 1 to 50 [cf. Fig. 4(A,B) with 4(C,D)], but remain relatively stable for numbers of normal modes larger than 50 [Fig. 4(E)]. Moreover, regions that are positively correlated in normal Mode 1 [e.g., the TM3 residues 107–125 with the helix 8 and C-terminal tail residues 300–343; green rectangle in Fig. 4(A–D)] become slightly anticorrelated when additional low frequency normal modes are included [cf. Fig. 4(A,B) with 4(C,D)]. To properly describe converged equal-time motional correlations of rhodopsin monomer, dimer, or tetramer, we used 50 lowest-frequency normal modes throughout our analyses. As shown in Figure 4(E), this number appears to be sufficient to examine equal-time correlated motions in the largest rhodopsin tetramer (green line) as well as in the smaller monomer (black line) and dimer (red line).
Figure 4.
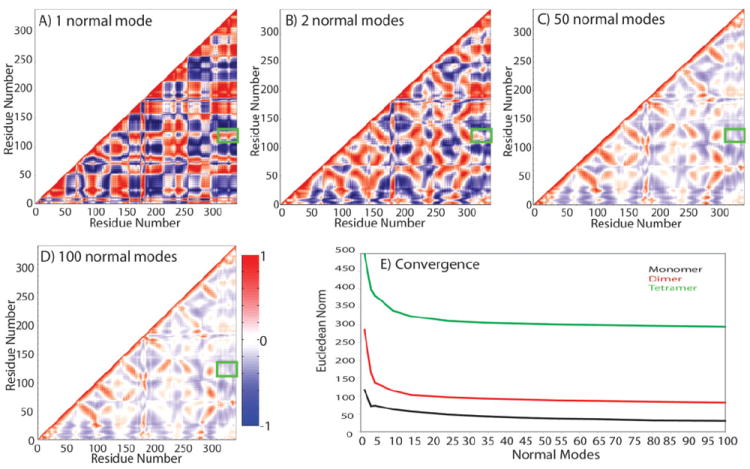
Convergence of covariance matrices of rhodopsin monomer. High correlation is shown in red, high anti-correlation in blue, and noncorrelated regions in white. Covariance is calculated according to Eq. (6) of Materials and Methods for: (A) one lowest nonzero frequency normal mode; (B) two lowest nonzero frequency normal modes; (C) 50 lowest nonzero frequency modes; and (D) 100 lowest nonzero frequency modes. Green boxes highlight one of the regions (TM3/helix8 and C-terminus) that is positively correlated in normal Mode 1, but anticorrelated when more modes are included in the calculation. (E) Eucledian norm of correlation matrices calculated using an increasing number of normal modes to estimate convergence. Covariance matrices were calculated with MatLab version 7.
Figure 5 shows covariance matrices for the rhodopsin monomer, and the corresponding protomer A in the rhodopsin dimer and tetramer. Notably, the most pronounced positive correlations within the rhodopsin monomer [Fig. 5(A)] are between sequential and structurally contacting domains, thus indicating the presence of an intramonomeric TM/TM interface. For instance, TM7 (residues 286–306), which is involved in direct interaction with TM1 (residues 35–64), TM2 (residues 71–100), TM3 (residues 107–139), and TM6 (residues 247–277), shows positive correlation with all these helices. Additionally, the extracellular loops 2 (residues 174–199) and 3 (residues 278–285) are correlated with each other and with the extracellular N-terminus, while the intracellular loop 1 (residues 65–70) is correlated with the intracellular helix 8 (residues 311–322) and the C-terminus (residues 322–343).
Figure 5.

Interresidue correlations in (A) rhodopsin monomer, (B) protomer A of rhodopsin dimer, and (C) protomer A of rhodopsin tetramer. Covariance matrices [Eq. (6) of Materials and Methods] were calculated with MatLab version 7 using 50 lowest frequency normal modes.
The interresidue correlations within a single rhodopsin protomer [Fig. 5(A)] significantly differ from the ones calculated for the same protomer in a dimeric or tetrameric arrangement [Fig. 5(B,C), respectively]. Overall, positive interresidue correlations within a single protomer are enhanced by oligomerization [larger red areas in Fig. 5(B,C) compared with 5(A)]. This result suggests a contribution of zero frequency normal modes of the monomer (corresponding to rigid body motions with a maximal interresidue correlation of 1) among the lowest frequency normal modes of the oligomer. As positive correlations increase upon higher order oligomerization, it is interesting to note that the only slightly anticorrelated regions in the tetramer are the intracellular loops and the C-terminus.
Comparison of interprotomeric correlations in the rhodopsin dimer and tetramer
A clear effect of oligomerization on the dynamics of rhodopsin is evident from comparison of motional correlations between protomers A and B in the dimer [Fig. 6(A)] to those in the tetramer [Fig. 6(B)]. For instance, TM4-TM4, TM5-TM5, and TM4-TM5 correlations at the interface between protomers A and B are much weaker in the rhodopsin dimer [Fig. 6(A)] than in the tetramer [Fig. 6(B)]. The intracellular loops and the C-terminus of protomer A are anticorrelated with protomer B in the tetramer, but not in the dimer. In the latter, the helix 8 and C-terminus of one protomer positively correlate with the extracellular N-terminus of the other. The EL2 loop in protomer A and the EL2 loop of protomer B are the most anticorrelated regions in the dimer, but become positively correlated in the tetramer. TM4 and TM5 of protomers A and B are more positively correlated within the tetramer than within the dimer. In contrast, TM4 and TM5 of protomer C exhibit anticorrelation with TM4 and TM5 of protomer A. Of note, the IL2 loop is always anticorrelated with IL3 in all pairs of protomers.
Figure 6.

Interresidue correlations between (A) protomers A and B within the rhodopsin dimer, (B) protomers A and B within the tetramer, and (C) protomers A and C within the tetramer. Covariance matrices were calculated as for Figure 5.
High interprotomeric correlations indicate regions at the interface
The highest positive correlation in the rhodopsin dimer is between symmetric patches of residues at the 1N3M5 intradimeric interface. Specifically, these symmetric patches are the IL2 residues 144–146 and the EL2-TM5 residues 199–202 (5.34–5.37 in Ballesteros and Weinstein generic numbering8) of protomers A and B (see Fig. 1 for protomer labeling). These results are in agreement with findings by Ishida and coworkers19 who suggested that positive correlation at the interfaces may be due to reduced interference of individual protein motions in these regions, and may thus be responsible for the minimization of the conformational entropy loss due to complexation. In sharp contrast with the intradimeric interface between protomers A and B, the 1N3M-like interdimeric interface of protomers A and C is mostly anticorrelated [cf. Fig. 6(B) with (C)]. The highest positive correlation—possibly representing an interaction hot spot23—between protomers A and C [Fig. 6(C)] occurs between residues 60–70 (end of TM1-beginning of IL1) of protomer A and the IL3 residues 225–240 of protomer C, with the maximally correlated pair of residue Q64 (1.59) with A233. These residues are involved in interdimeric interactions between different dimeric arrays in the 1N3M model, for which direct experimental validation has yet to come. Interestingly, R1.59C Melanocortin 1 receptor mutant was unable to be stimulated by its ligand.33 However, it is not clear whether this function impairment is related to an alteration of the oligomerization state.
Contribution of low frequency normal modes to molecular models of activated dimerization interfaces
A conformational change of a GPCR dimer interface involving TM4 and TM5 is part of the receptor activation mechanism, as suggested by inferences from cross-linking data.10 There are at least three dynamic activation scenarios that conform to these experimental data. As viewed from the intracellular side of the membrane, these scenarios are: (1) clockwise rotation of TM4 along its own helical axis [Fig. 1(B)], (2) protomer displacement [i.e. clockwise rotation of each protomer involved in intradimeric interaction along the membrane axis; Fig. 1(C)]; and (3) protomer exchange [i.e. clockwise rotation of each protomer involved in intradimeric interaction followed by their sliding within the array; Fig. 1(D)].
A few low frequency normal modes can reliably describe transformations between different functional states of many biological systems.26,27,34,35 Thus, based on the assumption that conformational transformations of the dimerization interface of a GPCR can be discriminated based on the number of low frequency modes that describe them,35 we calculated the contribution of the 100 lowest frequency normal modes of the 1N3M-like rhodopsin tetramer5 to each of the postulated activated interface models obtained as described in the Methods section.
As shown in Figure 7, none of the 100 lowest frequency modes of the tetramer exhibits a significant overlap with a dynamic mechanism requiring simple TM4 rotations to obtain an activated interface. In contrast, almost 90% of the changes towards activated interface models deriving from protomer displacement or protomer exchange are represented by the 25 lowest frequency normal modes. Yet, the individual normal modes are contributing very little, and the contributions are similar in these two transformations, making it difficult to discriminate between dynamic mechanisms of protomer displacement and protomer exchange within GPCR oligomeric arrangements based on this analysis.
Figure 7.

Contribution of lowest frequency normal modes of the rhodopsin tetramer to the conformational rearrangements of the interface of GPCR oligomerization deriving from: (A) TM4 rotation, (B) protomer displacement, and (C) protomer exchange. Overlap (black line) and Cumulative (red line) were calculated according to Eqs. (3) and (4), respectively (see Materials and Methods).
Differences between dynamic mechanisms producing protomer displacement or protomer exchange within a GPCR oligomer
To enable differentiation between activated models of the oligomerization interface of GPCRs deriving from protomer exchange or protomer displacement, we performed ENM normal mode analysis for each of them, and calculated the temperature B-factors (see Materials and Methods for details) as a representation of the average fluctuations of each individual protomer within each model. The fluctuations of protomer A are shown as an example in Figure 8. We find that in the more compact activated interface model deriving from protomer exchange the motions are suppressed, while in the less compact activated interface deriving from protomer displacement the motions are similar or enhanced compared with the initial 1N3M tetrameric arrangement.
Figure 8.

Residue fluctuations of protomer A within the tetrameric arrangements of rhodopsin.
The strongly reduced fluctuations in the model deriving from protomer exchange suggest an experimental way to distinguish between arrangements by measuring the mobility of labeled residues before and after activation. Such measurements may be performed (e.g. by site-directed spin label electron paramagnetic resonance (SDSL-EPR)36 or fluorescence quenching spectroscopy37) at positions that undergo the most pronounced mobility changes. For example, positions 16-18 (N-terminal), 100-102 (EL1), and 281-283 (EL3) are expected to have significantly decreased mobility in the activated interface model deriving from protomer exchange, but not in the one deriving from protomer displacement.
In addition to mobility measurements, monitoring particular distances (e.g. by following the rate of cross-linking10) may also help differentiate between the two activated interface models. We looked for pairs of residues whose Cα atoms satisfy the following criteria: (1) they are within 15 Å either in the activated interface models or in the inactive 1N3M tetrameric arrangement; and (2) they undergo a change of at least 5 Å in opposite directions in the two activated-interface arrangements. We found that the most pronounced distance change is between residues 62–64 (1.57–1.59 in Ballesteros and Weinstein generic numbering8) at the intracellular end of TM1 in protomer A (or protomer D) and residues 227–228 (5.62–5.63) at the intracellular end of TM5 in protomer C (or protomer B) (note the overlap with the region of high A/C correlation discussed above). This distance decreases by ~9 Å in the activated interface model deriving from protomer exchange, and increases by ~9 Å in the activated interface model deriving from protomer displacement. The next largest distance change is found between residue 323 (7.75; end of helix 8) in protomer A (or protomer D) and residue 233 (IL3) in protomer C (or protomer B).
In summary, the putative activated interface model deriving from TM4 rotations along their own helical axes can be discarded based on the lack of low frequency normal modes contributing to this conformational change. Motional analysis of the other two possible activated interface models deriving from either protomer displacement or exchange allows to suggest experimentally testable hypotheses of differential motional changes that may help discriminate between the different interface models.
CONCLUSIONS
We used ENM-based normal mode analysis to study the effect of oligomerization on the dynamics and interresidue correlations of rhodopsin. We find: (1) a significant perturbation of the normal modes of the rhodopsin monomer, which is mainly manifested in quenching of IL2 loop motions; (2) enhancement of the positive correlation among the TM residues of the rhodopsin monomer; and (3) highest interresidue positive correlation at the interfaces between protomers. In addition, we used ENM to shed light on the favorable dynamic mechanism(s) accounting for the recently observed conformational rearrangement of the GPCR dimerization interface occurring upon activation. Specifically, we calculated the contribution of lowest frequency normal modes of the rhodopsin tetramer to the conformational rearrangements between the 1N3M configuration and putative activated interface configurations either resulting from TM4 rotations, or protomer displacement or protomer exchange. Results of these calculations suggest that rigid body rotation of interacting TM4s along their own helical axes is an unlikely mechanism for the conformational rearrangement of the GPCR intradimeric interface observed upon activation. In contrast, protomer displacement and protomer exchange result to be equally feasible dynamic motions, but exhibiting differential motional changes. These changes suggest the following experimentally testable hypotheses: (a) decreased mobility of positions 16-18 (N-terminal), 100-102 (EL1) and 281-283 (EL3) in the activated interface model deriving from protomer exchange, but not in the one deriving from protomer displacement; and (b) opposite distance changes between residues 62–64 (1.57–1.59) and 227–228 (5.62–5.63) as well as between residue 323 (7.75; end of helix 8) and residue 233 (IL3) in the activated interface models deriving from protomer exchange or protomer displacement.
Acknowledgments
We thank Dr. Giuseppe Paleologo for helpful discussions. Drs. Joshua A. Speidel and Marta Murcia contributed to the realization of several figures.
Grant sponsor: NIH; Grant numbers: DA017976, DA020032.
References
- 1.Muller G. Towards 3D structures of G protein-coupled receptors: a multidisciplinary approach. Curr Med Chem. 2000;7:861–888. doi: 10.2174/0929867003374534. [DOI] [PubMed] [Google Scholar]
- 2.George SR, O’Dowd BF, Lee SP. G-protein-coupled receptor oligomerization and its potential for drug discovery. Nat Rev Drug Discov. 2002;1:808–820. doi: 10.1038/nrd913. [DOI] [PubMed] [Google Scholar]
- 3.Filizola M, Weinstein H. The structure and dynamics of GPCR oligomers: a new focus in models of cell-signaling mechanisms and drug design. Curr Opin Drug Discov Dev. 2005;8:577–584. [PubMed] [Google Scholar]
- 4.Milligan G. G-protein-coupled receptor heterodimers: pharmacology, function and relevance to drug discovery. Drug Discov Today. 2006;11:541–549. doi: 10.1016/j.drudis.2006.04.007. [DOI] [PubMed] [Google Scholar]
- 5.Liang Y, Fotiadis D, Filipek S, Saperstein DA, Palczewski K, Engel A. Organization of the G protein-coupled receptors rhodopsin and opsin in native membranes. J Biol Chem. 2003;278:21655–21662. doi: 10.1074/jbc.M302536200. [DOI] [PMC free article] [PubMed] [Google Scholar]
- 6.Fotiadis D, Liang Y, Filipek S, Saperstein DA, Engel A, Palczewski K. Atomic-force microscopy: rhodopsin dimers in native disc membranes. Nature. 2003;421:127–128. doi: 10.1038/421127a. [DOI] [PubMed] [Google Scholar]
- 7.Guo W, Shi L, Javitch JA. The fourth transmembrane segment forms the interface of the dopamine D2 receptor homodimer. J Biol Chem. 2003;278:4385–4388. doi: 10.1074/jbc.C200679200. [DOI] [PubMed] [Google Scholar]
- 8.Ballesteros JA, Weinstein H. Integrated methods for the construction of three-dimensional models and computational probing of structure-function relations in G protein coupled receptors. Methods Neurosci. 1995;25:366–428. [Google Scholar]
- 9.Kota P, Reeves PJ, Rajbhandary UL, Khorana HG. Opsin is present as dimers in COS1 cells: identification of amino acids at the dimeric interface. Proc Natl Acad Sci USA. 2006;103:3054–3059. doi: 10.1073/pnas.0510982103. [DOI] [PMC free article] [PubMed] [Google Scholar]
- 10.Guo W, Shi L, Filizola M, Weinstein H, Javitch JA. Crosstalk in G protein-coupled receptors: changes at the transmembrane homodimer interface determine activation. Proc Natl Acad Sci USA. 2005;102:17495–17500. doi: 10.1073/pnas.0508950102. [DOI] [PMC free article] [PubMed] [Google Scholar]
- 11.Filizola M, Wang SX, Weinstein H. Dynamic models of G-protein coupled receptor dimers: indications of asymmetry in the rhodopsin dimer from molecular dynamics simulations in a POPC bilayer. J Comp Aided Mol Des. 2006;20:405–416. doi: 10.1007/s10822-006-9053-3. [DOI] [PMC free article] [PubMed] [Google Scholar]
- 12.Go N, Scheraga H. Dynamics of a small globular protein in terms of low frequency vibrational modes. J Chem Phys. 1969;5:4751–4767. [Google Scholar]
- 13.Bahar I, Rader AJ. Coarse-grained normal mode analysis in structural biology. Curr Opin Struct Biol. 2005;15:586–592. doi: 10.1016/j.sbi.2005.08.007. [DOI] [PMC free article] [PubMed] [Google Scholar]
- 14.Ma J. Usefulness and limitations of normal mode analysis in modeling dynamics of biomolecular complexes. Structure. 2005;13:373–380. doi: 10.1016/j.str.2005.02.002. [DOI] [PubMed] [Google Scholar]
- 15.Tama F, Brooks CL., III Symmetry, form, and shape: guiding principles for robustness in macromolecular machines. Annu Rev Biophys Biomol Struct. 2006;35:115–133. doi: 10.1146/annurev.biophys.35.040405.102010. [DOI] [PubMed] [Google Scholar]
- 16.Niv MY, Skrabanek L, Filizola M, Weinstein H. Modeling activated states of GPCRs: the rhodopsin template. J Comp Aided Mol Des. 2006;20:437–448. doi: 10.1007/s10822-006-9061-3. [DOI] [PMC free article] [PubMed] [Google Scholar]
- 17.Isin B, Rader AJ, Dhiman HK, Klein-Seetharaman J, Bahar I. Predisposition of the dark state of rhodopsin to functional changes in structure. Proteins. 2006;65:970–983. doi: 10.1002/prot.21158. [DOI] [PubMed] [Google Scholar]
- 18.Bahar I, Jernigan RL. Vibrational dynamics of transfer RNAs: comparison of the free and synthetase-bound forms. J Mol Biol. 1998;281:871–884. doi: 10.1006/jmbi.1998.1978. [DOI] [PubMed] [Google Scholar]
- 19.Ishida H, Jochi Y, Kidera A. Dynamic structure of subtilisin-eglin c complex studied by normal mode analysis. Proteins. 1998;32:324–333. doi: 10.1002/(sici)1097-0134(19980815)32:3<324::aid-prot8>3.0.co;2-h. [DOI] [PubMed] [Google Scholar]
- 20.Zoete V, Meuwly M, Karplus M. A comparison of the dynamic behavior of monomeric and dimeric insulin shows structural rearrangements in the active monomer. J Mol Biol. 2004;342:913–929. doi: 10.1016/j.jmb.2004.07.033. [DOI] [PubMed] [Google Scholar]
- 21.Wang Y, Jernigan RL. Comparison of tRNA motions in the free and ribosomal bound structures. Biophys J. 2005;89:3399–3409. doi: 10.1529/biophysj.105.064840. [DOI] [PMC free article] [PubMed] [Google Scholar]
- 22.Zhang D, McCammon JA. The association of tetrameric acetylcho-linesterase with ColQ tail: a block normal mode analysis. PLo S Comput Biol. 2005;1:484–491. doi: 10.1371/journal.pcbi.0010062. [DOI] [PMC free article] [PubMed] [Google Scholar]
- 23.Kantarci N, Doruker P, Haliloglu T. Cooperative fluctuations point to the dimerization interface of p53 core domain. Biophys J. 2006;91:421–432. doi: 10.1529/biophysj.106.077800. [DOI] [PMC free article] [PubMed] [Google Scholar]
- 24.Lindahl E, Azuara C, Koehl P, Delarue M. NOMAD-Ref: visualization, deformation and refinement of macromolecular structures based on all-atom normal mode analysis. Nucleic Acids Res. 2006;34:38–42. doi: 10.1093/nar/gkl082. [DOI] [PMC free article] [PubMed] [Google Scholar]
- 25.Tirion MM. Large amplitude elastic motions in proteins from a single-parameter. Atomic Anal Phys Rev Lett. 1996;77:1905–1908. doi: 10.1103/PhysRevLett.77.1905. [DOI] [PubMed] [Google Scholar]
- 26.Tama F, Sanejouand YH. Conformational change of proteins arising from normal mode calculations. Protein Eng. 2001;14:1–6. doi: 10.1093/protein/14.1.1. [DOI] [PubMed] [Google Scholar]
- 27.Petrone P, Pande VS. Can conformational change be described by only a few normal modes? Biophys J. 2006;90:1583–1593. doi: 10.1529/biophysj.105.070045. [DOI] [PMC free article] [PubMed] [Google Scholar]
- 28.Zheng W, Brooks BR. Normal-modes-based prediction of protein conformational changes guided by distance constraints. Biophys J. 2005;88:3109–3117. doi: 10.1529/biophysj.104.058453. [DOI] [PMC free article] [PubMed] [Google Scholar]
- 29.Van Wyndberghe AW, Cui Q. Iterpreting correlated motions using normal mode analysis. Structure. 2006;14:1647–1653. doi: 10.1016/j.str.2006.09.003. [DOI] [PubMed] [Google Scholar]
- 30.Cui Q, Li G, Ma J, Karplus M. A normal mode analysis of structural plasticity in the biomolecular motor F(1)-ATPase. J Mol Biol. 2004;340:345–372. doi: 10.1016/j.jmb.2004.04.044. [DOI] [PubMed] [Google Scholar]
- 31.Rader AJ, Vlad DH, Bahar I. Maturation dynamics of bacteriophage HK97 capsid. Structure. 2005;13:413–421. doi: 10.1016/j.str.2004.12.015. [DOI] [PubMed] [Google Scholar]
- 32.Humphrey W, Dalke A, Schulten K. VMD: visual molecular dynamics. J Mol Graph. 1996;14:33–38. 27–38. doi: 10.1016/0263-7855(96)00018-5. [DOI] [PubMed] [Google Scholar]
- 33.Frandberg PA, Doufexis M, Kapas S, Chhajlani V. Human pigmentation phenotype: a point mutation generates nonfunctional MSH receptor. Biochem Biophys Res Commun. 1998;245:490–492. doi: 10.1006/bbrc.1998.8459. [DOI] [PubMed] [Google Scholar]
- 34.Krebs WG, Alexandrov V, Wilson CA, Echols N, Yu H, Gerstein M. Normal mode analysis of macromolecular motions in a database framework: developing mode concentration as a useful classifying statistic. Proteins. 2002;48:682–695. doi: 10.1002/prot.10168. [DOI] [PubMed] [Google Scholar]
- 35.Tama F, Feig M, Liu J, Brooks CL, III, Taylor KA. The requirement for mechanical coupling between head and S2 domains in smooth muscle myosin ATPase regulation and its implications for dimeric motor function. J Mol Biol. 2005;345:837–854. doi: 10.1016/j.jmb.2004.10.084. [DOI] [PubMed] [Google Scholar]
- 36.Hubbell WL, Cafiso DS, Altenbach C. Identifying conformational changes with site-directed spin labeling. Nat Struct Biol. 2000;7:735–739. doi: 10.1038/78956. [DOI] [PubMed] [Google Scholar]
- 37.Dunham TD, Farrens DL. Conformational changes in rhodopsin. Movement of helix f detected by site-specific chemical labeling and fluorescence spectroscopy. J Biol Chem. 1999;274:1683–1690. doi: 10.1074/jbc.274.3.1683. [DOI] [PubMed] [Google Scholar]