

Abstract
Objectives
To explore effective combinations of computational methods for the prediction of movement intention preceding the production of self-paced right and left hand movements from single trial scalp electroencephalogram (EEG).
Methods
Twelve naïve subjects performed self-paced movements consisting of three key strokes with either hand. EEG was recorded from 128 channels. The exploration was performed offline on single trial EEG data. We proposed that a successful computational procedure for classification would consist of spatial filtering, temporal filtering, feature selection, and pattern classification. A systematic investigation was performed with combinations of spatial filtering using principal component analysis (PCA), independent component analysis (ICA), common spatial patterns analysis (CSP), and surface Laplacian derivation (SLD); temporal filtering using power spectral density estimation (PSD) and discrete wavelet transform (DWT); pattern classification using linear Mahalanobis distance classifier (LMD), quadratic Mahalanobis distance classifier (QMD), Bayesian classifier (BSC), multi-layer perceptron neural network (MLP), probabilistic neural network (PNN), and support vector machine (SVM). A robust multivariate feature selection strategy using a genetic algorithm was employed.
Results
The combinations of spatial filtering using ICA and SLD, temporal filtering using PSD and DWT, and classification methods using LMD, QMD, BSC and SVM provided higher performance than those of other combinations. Utilizing one of the better combinations of ICA, PSD and SVM, the discrimination accuracy was as high as 75%. Further feature analysis showed that beta band EEG activity of the channels over right sensorimotor cortex was most appropriate for discrimination of right and left hand movement intention.
Conclusions
Effective combinations of computational methods provide possible classification of human movement intention from single trial EEG. Such a method could be the basis for a potential brain-computer interface based on human natural movement, which might reduce the requirement of long-term training.
Significance
Effective combinations of computational methods can classify human movement intention from single trial EEG with reasonable accuracy.
Keywords: Movement intention, Self-paced movement, Combination, Computational methods, Classification, Movement-related cortical potentials (MRCPs), Event-related desynchronization/synchronization (ERD/ERS), Genetic Algorithm, Brain-computer interface (BCI)
Introduction
Brain-computer interfaces (BCI) may provide an alternate communication pathway for patients with motor dysfunction, such as amyotrophic lateral sclerosis, stroke, or cerebral palsy. Various neural signals have been used for invasive or non-invasive BCIs. Electroencephalography (EEG), a non-invasive method, has been widely studied for BCI implementation. Several successful EEG-based BCI methods have been reported: slow cortical potential-based thought translation device (Birbaumer et al. 2000; Hinterberger et al. 2004), sensorimotor rhythm-based cursor control (Wolpaw et al. 1991), and P300-based letter selection (Donchin et al. 2000). P300 is a positive event-related potential appearing about 300 ms after presenting a rare visual or auditory stimulus. For BCI purposes, the users can select a specific letter from a series of many different letters by producing a P300 when that letter flashes. For P300-based BCI, the communication accuracy may decrease significantly with time due to easy fatigue (Soyuer et al. 2006). Both slow cortical potential and sensorimotor rhythm methods require long-term training before subjects can make robust communication or control (Wolpaw and McFarland 2004). Recent clinical data showed that patients had difficulty participating in long-term BCI training, in particular, those with “locked-in” syndrome (Birbaumer 2006).
It is preferable to achieve BCI control through human natural behavior, so that BCI users do not have to perform long-term training. Internally cued (self-paced) or externally cued hand and finger extensions or flexions are among the repertoire of human natural behavior. Both anatomical and physiological evidence showed the nature of contralateral control of hand movements (Haaland and Harrington 1994). Further, EEG also can demonstrate hemispheric differences during movement production (Stancak and Pfurtscheller 1996; Haaland et al. 2000; Bai et al. 2005). For the purpose of BCI, we are interested in the brain signal associated with movement intention preceding movement. The intention to move is associated with at least two cortical activities over sensorimotor and supplementary motor cortices: the movement-related cortical potential, which occurs about −1.5 s before the movement (Shibasaki et al. 1993); and event-related desynchronization (ERD) or power decrease in alpha and beta bands, which occurs as early as 2s before the movement (Toro et al. 1994a). Furthermore, these activities are available even though no movement occurs (Castro et al. 2005). In Castro’s study, subjects were instructed to get ready to flex and extend their toes before they heard a tone provided externally. In one session, they needed to respond to the stimulus by executing the movement, while in another session, the subjects did not execute the movement with the stimulus. They observed cortical activity before the stimulus in both sessions. This provided evidence that pre-movement activity was available even without real movement. These features yield possible opportunities to classify human intention to move the right or left hand before movement occurs. However, because EEG records potentials from the scalp where intervening tissues may blur the neuronal signals from the cortex, those features are evident only after averaging across a large number of trials.(Toro et al. 1994b; Sochurkova and Rektor 2003; Bai et al. 2005). For single trial EEG, signals relevant to movement are usually very small compared with ongoing background activity. Studies have attempted to classify whether the subject intended to move the right or left hand during the production of real or imagined movement from single trial EEG (Burke et al. 2005; Blankertz et al. 2006; Congedo et al. 2006; Pfurtscheller et al. 2006). They suggested that advanced signal processing and pattern recognition techniques are necessary to extract the relevant signal from single trial EEG. Although many signal processing and pattern recognition techniques have been explored for improving the signal-to-noise ratio for greater classification accuracy (Tie and Sahin 2005; Kim et al. 2006; Rezaei et al. 2006; Townsend et al. 2006), it is still difficult to determine more effective solutions for accurate classification because there are no systematic approaches. For example, previous studies investigated either the performance of different spatial filters (Muller-Gerking et al. 1999; Naeem et al. 2006), or the performance of different classification methods (Garrett et al. 2003; Hinterberger et al. 2003) independently. Therefore, additional investigation is required to explore more effective combinations of spatial filter, temporal filter and classification methods. Furthermore, although one study has investigated a large number of subjects to test different modalities of visual, auditory and cross-modal visual-auditory stimuli for BCI (Pham et al. 2005), previous studies on the comparison of computational algorithms were performed only with a relatively small number of subjects. A larger sample of subjects may yield a better combination of computation methods that are robust across subjects. A larger sample of subjects may yield a better combination of computation methods that are robust among subjects. This is very useful for BCI applications because it may not be practical to rely on an engineering team to test the entire range of computational methods for each prospective BCI user.
We performed a systematic study to explore better combinations of computational methods for classifying self-paced movement on either right or left hand before movement occurred. We recorded high-density 128-channel EEG from a relatively large sample of 12 subjects with about 150 single trials for classification for each subject. Since typical BCI users are unable to perform movements, only the signal preceding the movement was used for the exploration Offline optimization procedures consisted of spatial filtering, temporal filtering, feature selection and classification. We employed state-of-the-art neural signal processing and pattern recognition techniques; spatial filtering using principal component analysis (PCA), independent component analysis (ICA), common spatial patterns analysis (CSP), surface Laplacian derivation (SLD); temporal filtering using power spectral density estimation (PSD) and discrete wavelet transform (DWT); pattern classification using linear Mahalanobis distance classifier (LMD), Quadratic Mahalanobis distance classifier (QMD), Bayesian classifier (BSC), multi-layer perceptron neural network (MLP), probabilistic neural network (PNN), and support vector machine (SVM). We also employed a robust multivariate feature selection strategy using a genetic algorithm (GA). The analysis of features from the optimal selection was performed.
Methods
Subjects
Twelve healthy volunteers (nine males and three females; mean age: 39.1±9.1 years) participated in the study. Eleven subjects were right-handed according to the Edinburgh inventory (Oldfield 1971) and one subject (subject 2) was left-handed. The protocol was approved by the Institutional Review Board; all subjects gave their written informed consent for the study.
Experimental protocol and data acquisition
Subjects were seated in a chair with the forearm semi-flexed and supported by a pillow; they were asked to perform self-paced 3-key sequences on a computer keyboard with either their right or left hand for the purpose of enhancing the MRCP and ERD, and to maintain the subjects’ attention level. The data preceding the first keystroke was used for the following analyses. Subjects were asked to execute a set of sequential key strokes every 10 s. After 10 min of training on each hand, subjects paced the movements, determining the time and laterality in a pseudo-random manner. They were specifically asked not to count time themselves because verbal feedback was provided by the investigator to maintain the target rate (0.1 Hz). Furthermore, subjects were asked to keep all muscles, other than those in the performing hand, relaxed. They were also instructed to remain relaxed between key strokes. Eye movements, blinks, body adjustments, throat clearing, and other movements were to be avoided during the interval at least 3 s prior and 2 s after the movement. The recording was done in five 20-minute blocks with intermittent 3-min breaks to avoid fatigue with total recording time about 2–3 hours.
EEG was recorded from 122 (tin) surface electrodes, mounted on an elastic cap (Electro-Cap International, Inc., Eaton, OH, U.S.A.) with reference of the right ear. The distance between two adjacent electrodes was approximately 2.5 cm. Bipolar recordings of the vertical and horizontal electrooculogram (EOG) and electromyogram (EMG) from the volar surface of the right and left forearm, mostly sampling flexor carpi ulnaris and flexor digitorum superficialis muscles, were also obtained. Signals from all channels were amplified (Neuroscan Inc., El Paso, TX), lowpass filtered at 100Hz (third-order Butterworth filter with at least −12dB/octave rolloff), and digitized (sampling frequency, 1000 Hz).
Data processing
Data processing was performed offline using home-made MatLab (MathWorks, Natick, MA) scripts. We visually inspected all the continuous data and marked EMG onset manually. Marking was done only for those movements where EMG burst onset was sharp and clearly defined. EEG was down-sampled to 250 Hz, i.e., extracted one sample from four continuous samples. Epoching was done with windows of −1.024 s to 0 s with respect to EMG onset. The epoched 1 s data was used for classification. Any epochs contaminated with face muscle artifacts were rejected. Epochs with bilateral EMG activity were also discarded. Eye-movement related artifacts were corrected using an Auto-Regressive Exogenous input (ARX) model, in which the vertical and horizontal EOG signals were used as the exogenous inputs (Cerutti et al. 1988). Approximately 150 artifact-free epochs for each side in each subject were obtained.
Computational methods for offline optimization
The artifact-free EEG epochs from −1.024 s to 0 s with respect to movement onset for each subject were pooled into one dataset with corresponding right or left labels. One complete experiment consisted of dataset generation, training and testing as illustrated in Fig. 1. The exploration experiments were performed on each subject independently, i.e., the performance of 90 combinations of spatial filter, temporal filter and classification method was investigated on an individual basis, and better combinations of computational methods were explored according to the statistical analysis of individual performance. Only the testing results were used for subsequent statistical analysis. To reduce the bias in testing, the complete experiment was repeated five times. The computational methods employed in this study were described as follows. The detailed mathematical or theoretical background of the computational methods was beyond the scope of this paper. We emphasized the algorithms employed and ignored theoretical descriptions, and instead, provide necessary references.
Fig. 1.

The complete procedure of offline optimization: dataset generation, training, and testing. The optimization of computational methods was explored using all combinations from spatial filtering, temporal filtering and classification. The optimization experiments were performed five times for each subject.
Dataset generation procedure
The pooled dataset for each subject was pseudo-randomly separated into training dataset (80%) and testing dataset (20%). The optimization procedure was performed on the training dataset, while the testing dataset was left untouched for the testing purpose only. The control parameters for neural network classifiers were also determined from the training set. For each of the repeated measurements of testing accuracy for each subject, the sampling for training and testing datasets was independent. We repeated the training and testing procedures five times. In each experiment consisting of both training and testing procedures, the pooled dataset was randomly split into the datasets for training and testing. Further, the numbers of samples (EEG trials) for right and left hand movements were balanced for both training and testing procedures.
Training procedure
The training procedure consisted of filtering (spatial filtering and temporal filtering), data preprocessing, feature selection and classification. The purpose for the training was to provide robust computational models that could optimize testing accuracy. We explored a number of state-of-the-art neural signal processing techniques for data filtering and classification. The investigation was established on complete combinations of spatial filter, temporal filtering and classification methods: for example, the computational procedure of ‘ICA’-‘PSD’-‘PNN’, ‘CSP’-‘DWT’-‘MLP’, etc. The total number of combinations was 90, i.e. 5 (‘None’, ‘PCA’, ’ICA’, ‘CSP’, and ‘SLD’) × 3 (‘VAR’, ‘PSD’, and ‘DWT’) × 6 (‘LMD’, ‘QMD’, ‘BSC’, ‘MLP’, ‘PNN’, and ‘SVM’). Detailed explanations of computational algorithms explored in this study are given in the Appendix.
Testing procedure
The testing dataset, which was independent of the training dataset, was used in the testing procedure. The parameters and models determined in the training procedure were applied in the spatial filtering, the temporal filtering, preprocessing, feature selection and classification procedures. Similar to the training procedure, 90 combinations of computational methods were performed.
Pre-temporal filtering
As the spatial filters of ‘PCA’ and ‘CSP’ are susceptible to possible contaminations of physiological and non-physiological artifacts, a previous study suggested to pre-filter signals for the ‘PCA’ and ‘CSP’ modeling (Muller-Gerking et al. 1999). In order to compare the performance of ‘PCA’ and ‘CSP’ with pre-filtering, additional experiments were performed; a narrow bandpass filter (16–24 Hz) and a broad bandpass filter (8–30 Hz) using fourth-order infinite impulse response (IIR) Butterworth filter were applied before the procedure of the ‘PCA’ and ‘CSP’ spatial filtering. The variance of the spatial filtered CSP components (‘VAR’) was used for the following feature selection. The linear classifier ‘LMD’ was applied for the classification.
Summary of the combination methods using different computational algorithms
For the classification of the intention to move right and left hands, the single trial EEG data from 1 s preceding movement to movement onset was extracted and the single trial data was marked according to the EMG activity during right and left hand movement. The pooled data were randomly sampled five times. In each time, the pooled data were randomly extracted to produce a training dataset (80%) and testing dataset (20%) so that the testing dataset was independent from the training dataset. Only the training dataset was used for modeling. The final classification accuracy was obtained from the average of five testing results. To summarize, the combination of five spatial filter algorithms (‘None’, ‘PCA’, ’ICA’, ‘CSP’, and ‘SLD’), three temporal filter methods (‘VAR’, ‘PSD’, and ‘DWT’), and five classification methods (‘LMD’, ‘QMD’, ‘BSC’, ‘MLP’, ‘PNN’, and ‘SVM’) together with ‘GA’-based feature selection were used. A total of 90 combinations of computational algorithms were compared.
Data Analysis
To investigate the neurophysiology associated with human voluntary movement, the movement-related cortical potentials (MRCPs) and event-related desynchronization (ERD) (Toro et al. 1994b) preceding and during the production of self-paced movement were calculated. In order to observe the time course of MRCP and ERD, the data were epoched from −4 to 1.5 s with respect to movement onset. The epoched data were averaged and low pass-filtered at 10 Hz using a second-order Butterworth filter. The MRCP was obtained by baseline correction from −4 to −3 s. To calculate ERD, each epoch data was linearly de-trended and divided into 0.256 s segments. The power spectrum of each segment was calculated using FFT with Hamming window resulting in a band width of about 4 Hz. ERD was obtained by averaging the log power spectrum across epochs and baseline corrected with respect to −4 to −3 s. The detailed calculation of MRCPs and ERD was previously reported (Bai et al. 2006) and (Bai et al. 2005), respectively.
Statistics
To determine better combinations of spatial filter, temporal filter and classification methods, an analysis of variance (ANOVA) for repeated measures with three within-subject main factors was performed on the testing accuracy results. The three within-subject main factors were: (1) spatial filter (‘None’, ‘PCA’, ’ICA’, ‘CSP’, and ‘SLD’ with 5 levels); (2) temporal filter (‘VAR’, ‘PSD’, and ‘DWT’ with 3 levels); and (3) classification (‘LMD’, ‘QMD’, ‘BSC’, ‘MLP’, ‘PNN’, and ‘SVM’ with 6 levels). The total number of repeated measurements for each subject was 5×3×6=90. Mauchly’s test was used to test the assumption of sphericity and significance was found, i.e. the assumption of sphericity was violated. As a result, we applied the Greenhouse-Geisser correction to adjust the degrees of freedom (DF). A significance level of p < 0.05 was adopted for ANOVA analysis in this study.
Additionally, multiple comparison tests were performed on each of the significant (p < 0.05) main factors and interactions identified from the ANOVA test. To reduce the risk of false positives, we used Bonferroni correction to compensate for multiple comparisons. The statistical analysis was performed using SPSS (Ver. 15, Chicago, Illinois).
Implementation
The offline computation was scripted using MATLAB 7.2 and standard toolboxes (MathWorks, Natick, MA); Neural Network Toolbox for ‘PNN’, System Identification Toolbox for ARX modeling, Signal Processing Toolbox for ‘PSD’, and Wavelet Toolbox for ‘DWT’. Three open-source MATLAB packages were used; ‘EEGLAB’ for ‘ICA’ (Delorme and Makeig 2004), ‘Netlab’ for ‘MLP’ (Nabney 2004), and ‘SVMLIB’ for ‘SVM’ (Fan et al. 2005). The statistical analysis was performed using SPSS.
Results
We performed five complete experiments. Each experiment included dataset generation, training, and testing procedures. In each complete experiment, we investigated 90 combinations of computational methods on each of 12 subjects. The ANOVA was performed on the averaged testing accuracy from five complete experiments as shown in Table 1. In ANOVA, significant within-subject factors were: spatial filter, SF (F(2.3,23.3)=15.2, P<0.01); temporal filter, TF (F(1.7,17.2)=6.5, P=0.01), and classification method, CM (F(1.6,16.0)=12.3, P<0.01). Further, we observed significant interaction between the spatial filter and classification methods, SF*CM (F(5.4,53.9)=3.8, P<0.01). No other significant interactions were found.
Table 1.
ANOVA Test of Classification Accuracy
| Source | Type III Sum of Squares | Degrees of Freedom | Greenhou se-Geisser Epsilon | Corrected Degrees of Freedom | Mean Square | F Value | P Value |
|---|---|---|---|---|---|---|---|
| SF | 10099.5 | 4 | 0.58 | 2.3 | 4333.5 | 15.2 | <0.01 |
| Error (SF) | 6630.5 | 40 | 23.3 | 284.5 | |||
| TF | 1743.8 | 2 | 0.86 | 1.7 | 1016.7 | 6.5 | 0.01 |
| Error (TF) | 2705.1 | 20 | 17.2 | 157.7 | |||
| CM | 574.8 | 5 | 0.32 | 1.6 | 341.0 | 12.4 | <0.01 |
| Error (CM) | 441.5 | 50 | 16.0 | 27.6 | |||
| SF*TF | 750.0 | 8 | 0.41 | 3.2 | 231.1 | 2.2 | 0.10 |
| Error (SF*TF) | 3425.4 | 80 | 32.4 | 105.6 | |||
| SF*CM | 252.0 | 20 | 0.27 | 5.4 | 46.7 | 3.8 | <0.01 |
| Error (SF*CM) | 661.7 | 200 | 53.9 | 12.3 | |||
| TF*CM | 68.1 | 10 | 0.39 | 3.9 | 17.7 | 1.8 | 0.15 |
| Error (TF*CM) | 377.9 | 100 | 38.7 | 9.8 | |||
| SF*TF*CM | 146.9 | 40 | 0.16 | 6.6 | 22.4 | 1.0 | 0.46 |
| Error (SF*TF*CM) | 1513.2 | 400 | 65.5 | 23.1 |
(SF: spatial filter; TF: temporal filter; CM: classification method)
Multiple comparison procedures were performed on the significant main effects and interactions. The multiple comparison result for the spatial filter is illustrated in Fig. 2(a). The bar plots showed the estimated value of means for five spatial filters and the error-bar provided the standard errors. ‘ICA’ provided significantly higher accuracy than those of ‘None’, ‘PCA’ and ‘CSP’. No significant difference was found between ‘ICA’ and ‘SLD’. The ‘CSP’ approach produced a significantly lower accuracy than ‘None’, ‘ICA’ and ‘SLD’ approaches. The estimated mean testing accuracy by ‘ICA’ approach was approximately 5% higher than ‘None’ and ‘PCA’ approaches and 8% higher than ‘CSP’ approach. The multiple comparison result for the temporal filter is shown in Fig. 2(b). The ‘DWT’ approaches provided significantly higher accuracy than the ‘VAR’ approach, which provided about 3% mean difference. No significant difference was found between ‘PSD’ and ‘DWT’. Fig. 2(c) shows the multiple comparison results of classification methods. Linear and quadratic statistical classification methods of ‘LMD’, ‘QMD’, and ‘BSC’ provided significantly higher accuracy than the neural network approach of ‘MLP’, but the mean difference was small, i.e., about 1–2%. The ‘SVM’ approach produced similar accuracy than those of statistical classification methods (i.e., no significant difference), although the ‘SVM’ provided better accuracy than ’MLP’ approach. Fig. 3 shows the multiple comparison results of the interaction between spatial filter and classification method. There were 30 combinations of the spatial filter methods and classification methods. From the multiple comparison, the ‘ICA’ and ‘SLD’ are better spatial filter methods and ‘LMD’, ‘QMD’ and ‘SVM’ are better classification methods.
Fig. 2.

Multiple comparison results of significant main effects from three-way ANOVA test on testing accuracy. (a) Spatial filter: ‘ICA’ approach produced significantly higher accuracy than those of ‘None’, ‘PCA’, and ‘CSP’ approaches, but comparable with ‘SLD’ approach. The estimated mean difference between them was about 5–8%. (b) Temporal filter: ‘DWT’ approaches provided significantly higher accuracy than ‘VAR’ approach, but comparable with ‘PSD’ approach. The estimated mean difference between them was about 3%. (c) Classification: linear and quadratic statistical classification methods of ‘LMD’, ‘QMD’, and ‘BSC’, and neural network approach of ‘SVM’ provided significantly higher accuracy than two neural network approaches of ‘MLP’. The estimated mean difference between them was about 1–2%.
Fig. 3.
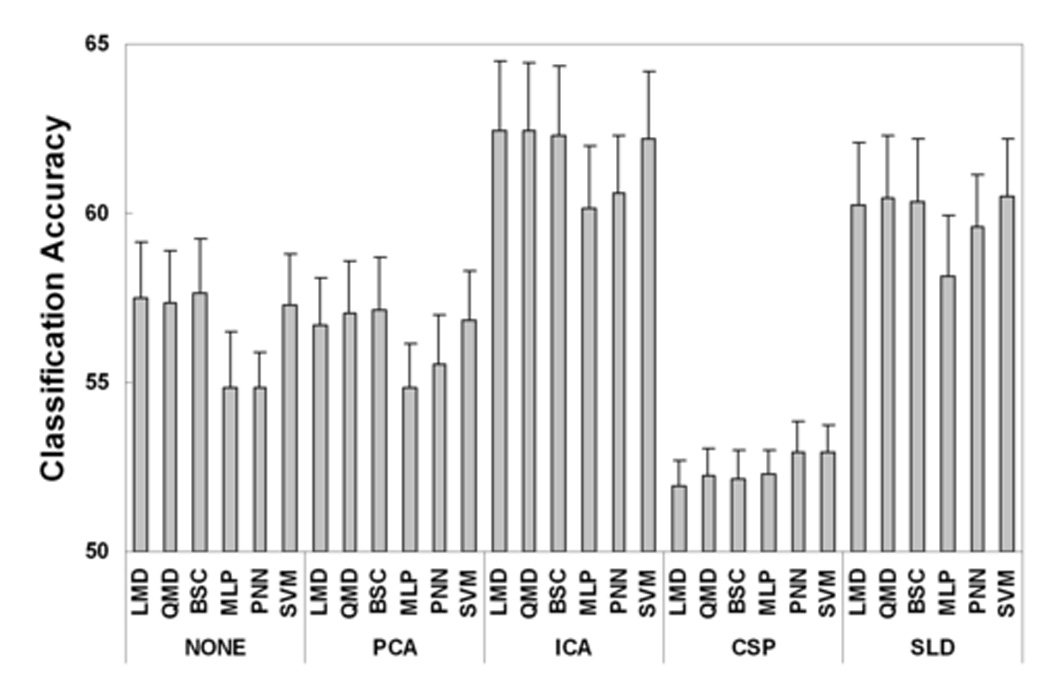
Multiple comparison results of significant interaction between spatial filter and classification method from three-way ANOVA test on testing accuracy. The combinations of spatial filter of ‘ICA’ and ‘SLD’, and classification method of ‘LMD’, ‘QMD’ and ‘SVM’ provided higher classification accuracy.
As shown in Table 2, the classification performance was improved slightly by applying a temporal filter before the ‘CSP’ and ‘PCA’ spatial filter. For ‘PCA’, the classification performance was marginally improved about 1.8% and decreased 3.9%, by applying bandpass filter of 8–30 Hz and 16–24 Hz, respectively. For ‘CSP’, the average classification accuracy from 12 subjects was improved 0.3% by applying a broad bandpass filter (8–30 Hz), and the average classification accuracy was also marginally improved by 1.2% when applying a narrow bandpass filter of 16–24 Hz. These results supported that the ‘ICA’ and ‘SLD’ were better spatial filters providing an improved classification performance than the performance of ‘PCA’ and ‘CSP’. Furthermore, the testing accuracy results of the classification performance of spatial filters on bandpass filtered single trial EEG were obtained using a 10-fold cross-validation method for feature selection. The results of the testing accuracy using 5-fold and 10 fold cross-validation methods are given in Table 2 for the purpose of comparing the classification performance between the two cross-validation methods. For example, when using ‘CSP’ as the spatial filter on the bandpass (8–30 Hz) signal trial EEG, the mean testing accuracy of 12 subjects using a 5-fold cross-validation method for feature selection was 51.4% with standard deviation of 4.6%, whereas the mean testing accuracy of 12 subjects using a 10-fold cross-validation method for feature selection was 53.1% with standard deviation of 4.6%. The difference of the classification performance was small at 1.7% compared with the standard deviations. Similar results are seen in Table 2 with different spatial filter methods on different bandpass filtered single trial EEG. These show that the 5-fold cross-validation method provides comparable classification results with the 10-fold cross-validation method.
Table 2.
Comparison of Classification Performance of Spatial Filters on Bandpass Filtered Single-Trial EEG
| Spatial Filter | PCA | CSP | ||||
|---|---|---|---|---|---|---|
| Bandpass Filter | None | 8–30 Hz | 16–24 Hz | None | 8–30 Hz | 16–24 Hz |
| Accuracy (%) (Mean±STD)* | 56.7±5.7 | 58.5±5.3 | 52.8±4.9 | 51.1±2.6 | 51.4±4.6 | 52.3±4.1 |
| Accuracy (%) (Mean±STD)** | 54.2±4.0 | 59.5±5.3 | 53.5±4.3 | 51.9±3.5 | 53.1±4.6 | 51.5±3.3 |
5-fold cross-validation in feature selection
10-fold Cross-validation in feature selection
According to the statistical test reported in Fig. 2 and Fig. 3, the combination method of ‘ICA’ as the spatial filter, ‘PSD’ as the temporal filter and ‘SVM’ as the classification method was a better combination to classify movement intentions. The number of trials and the testing results using the above computational methods for each subject are given in Table 3. The average of testing accuracy was obtained from the average from five experiments, and the SD showed the standard deviation. Two subjects (3 and 5) had a mean testing accuracy greater than 75%. However, the variance among subjects was large (SD=7.5%). Four subjects had mean accuracy less than 60%.
Table 3.
Testing accuracy for classification of movement intention*
| Subject Index | 1 | 2 | 3 | 4 | 5 | 6 | 7 | 8 | 9 | 10 | 11 | 12 | Average |
|---|---|---|---|---|---|---|---|---|---|---|---|---|---|
| Number of Trials | 156 | 195 | 153 | 146 | 291 | 403 | 277 | 195 | 197 | 104 | 95 | 292 | 209±91 |
| (Right/Left) | 136 | 219 | 154 | 123 | 224 | 321 | 282 | 192 | 192 | 115 | 79 | 356 | 199±86 |
| Testing Accuracy | 55.2 | 60.8 | 75.3 | 64.2 | 75.8 | 56.0 | 69.1 | 60.9 | 53.9 | 68.0 | 56.7 | 62.1 | 63.2±7.5 |
| (Average/SD) | 5.2 | 4.3 | 5.9 | 6.9 | 4.1 | 3.5 | 5.2 | 3.7 | 3.0 | 1.9 | 4.7 | 5.7 |
Spatial filter: ICA; Temporal filter: PSD; Classification: SVM
We performed data analysis to investigate the neurophysiological features supporting the classification of human movement intention. Subject 2, who was left-handed, was excluded in the analysis for neurophysiological consistency. The grand averaged MRCPs and ERD following right and left hand movements are shown in the right and left column, respectively. Both MRCPs and ERD were baseline-corrected with the baseline range from −4 to −3 s. The MRCP waveforms of channel C4 for right and left hand movements are plotted in Fig. 4 (a) and (b). The negative slopes in MRCPs for both right and left hand movements started about −1.2 s before movement onset. The negative peaks for both movements were found just after movement onset. The peak amplitude of MRCPs following left hand movement was larger than that of right hand movement. The head topography of MRCPs at movement onset is illustrated in Fig. 4 (c) and (d). The MRCPs were observed over sensorimotor cortex, and centered at medial-central area. The MRCPs were lateralized to the contralateral left hemisphere before the right hand movement. In contrast, the MRCPs were lateralized to contralateral right hemisphere before the left hand movement. However, the contralateral lateralization was not distinct due to the widespread activity over the central area. The alpha and beta ERD of left hand movement began about 1.8 s before movement, whereas the ERD of right hand movement started about 1 s before movement onset. Both alpha and beta ERD maximized at movement onset. During the window for classification (−1 s to movement onset), ERD in both alpha and beta bands was larger for left hand movement. The head topography of ERD in beta band (20–24 Hz) at 500 ms before movement onset shows that the beta ERD lateralized to left sensorimotor cortex before the right hand movement, in contrast, the beta ERD was present in both right and left hemispheres before the left hand movement.
Fig. 4.

Movement-related cortical potentials (MRCP) and event-related desynchronization (ERD) averaged from 11 subjects (excluding subject 2) preceding self-paced right (on the left column) and left (on the right column) hand movements. The waveforms of the MRCP from channel C4 are illustrated in (a) and (b). Peak MRCP amplitude of left hand movement was larger than that of right hand movement. The head topography of MRCP at movement onset is plotted in (c) and (d) for right and left hand, respectively. The MRCP over sensorimotor cortex lateralized to contralateral left hemisphere preceding the right hand movement; the MRCP over sensorimotor cortex lateralized to the contralateral right hemisphere preceding the left hand movement, however, activity on the ipsilateral left hemisphere was also observed before the left hand movement. Time-frequency plots of ERD from channel C4 are shown in (e) and (f). Both alpha and beta band activities were observed over sensorimotor cortex before the movements. The lateralized ERD over left sensorimotor cortex was observed at 500 ms before the onset of right hand movement (g), but bilateral ERD activities on both hemispheres was seen before the left hand movement.
To obtain direct spatial and temporal information, feature analysis was performed on the Bhattacharyya distance data obtained in the pre-feature selection procedure following the filtering procedure. In this procedure, no spatial filter was employed and ‘PSD’ was employed as the temporal filter. The produced Bhattacharyya distance matrix showed the separability for each channel and frequency. Because the succeeding best-feature selection was performed on the 100 best pre-features, for each subject, the Bhattacharyya distance data smaller than the best 100th value was corrected to zero. The grand average of Bhattacharyya distance among eleven subjects is illustrated in Fig. 5. The first column shows the channel-frequency plots of individual (subjects 3, 5 and 7) and grand average of Bhattacharyya distance; the second and third columns show the alpha (8–12 Hz) and beta band (16–24 Hz) head topography of Bhattacharyya distance. A larger value of the Bhattacharyya distance indicated higher separability. We observed high separability on features in the beta band in subjects 3, 5 and 7, and the grand average. Significant alpha band Bhattacharyya distance was only observed in subject 3 so that the alpha band activity was used for the classification in this subject. No obvious Bhattacharyya distance in DC was observed in the Bhattacharyya distance plot perhaps because the difference was too small, or the variance across trials was large, or both. The head topography of Bhattacharyya distance in beta band shows that channels with higher separability were over the sensorimotor cortex on the right hemisphere. The channel with the maximal separability was C4. In contrast, the separability of the channels on the left sensorimotor cortex was small, which was consistent with the beta ERD observation of the bilateral distribution preceding left hand movement.
Fig. 5.

Feature analysis for the classification of human movement intention. The channel-frequency plots of Bhattacharyya distance, the head topography of Bhattacharyya of alpha band activity (8–12 Hz), and the head topography of Bhattacharyya of beta band activity (16–24 Hz) are illustrated in the first, second and third column, respectively. The average of Bhattacharyya distance from 11 subjects (excluding subject 2) is provided in the fourth row. High separability for intention classification was observed in the beta EEG activity over right sensorimotor cortex, whereas the beta band Bhattacharyya distance was small over left sensorimotor cortex from both individual and average plots. Only subject 3 showed high Bhattacharyya distance in alpha band over contralateral sensorimotor cortex. Bhattacharyya distance of both DC and alpha band components in the other subjects was small.
Discussion
Exploration of computational methods
Signal processing and pattern recognition techniques have been considered a fundamental requirement for BCI research and development. McFarland et al. reported the taxonomy of the computational methods that had been employed in BCI laboratories, which was summarized in a recent BCI meeting (McFarland et al. 2006). According to that taxonomy, we considered that the current study was comprehensive because the majority of the summarized methods had been explored. Comparison is important for optimizing computational methods. Townsend et al. performed a comparison study of signal processing methods for spatial and temporal filtering (Townsend et al. 2006). The comparison of pattern recognition techniques for classification and feature selection was also reported (Garrett et al. 2003; Hinterberger et al. 2003). To our knowledge, the current work is the first to perform a complete comparative investigation on the combination of both signal processing and pattern recognition methods. We aimed to explore better combinations of computational algorithms. We do not conclude that we have identified an optimal method because it was not practical to test every available algorithm. However, we wanted to identify the best performing methods from a large number of options that have either been used in the literature before or have theoretical advantage.
Classification of movement intention during human voluntary movement
Prediction of human movement intention during self-paced or memory-delayed movement has been investigated by several BCI groups. The highest prediction accuracy of 84% was reported in a BCI competition (Wang et al. 2004), in which a similar experimental paradigm was used. This result was higher than the average accuracy obtained in the current study, even when applying an optimized computational method. We considered two possible reasons: subject and experimental paradigm. We investigated 12 naïve subjects in the current study, whereas the result from the BCI competition only provided a dataset from a single subject and it was unclear whether the subject was trained before recording. We observed that the subjects’ variance was relatively large (7.5%) in the current exploration study. It is more likely that the prediction accuracy was subject-dependent so that it was difficult to compare the two studies. Both studies extracted the EEG trials before movement and focused on this period since there is often no EMG activity in potential BCI users and therefore no ability to use actual movement-related signals. The major difference in experimental paradigms between the two studies was the interval between two succeeding keystrokes. The BCI competition was based on a 1s interval (Congedo et al. 2006), whereas we used a 10s interval. Although simple keystrokes can be finished within 1 s, the existence of post-movement activity, for example, event-related synchronization (ERS), might contribute to the classification (Pfurtscheller et al. 1998). However, it is also not clear whether ERS appears when no real movement occurs in BCI applications. In this study, the subjects performed self-paced movement once per 10 s to avoid post movement activity in our experiment. In contrast, faster tapping rates of 0.5 and 2 taps/s were employed in a previous study (Blankertz et al. 2003). Because the window of [−450 −350] ms was used as the baseline, there was a risk of using postmovement activity when the tapping rate was 2 taps/s. Because the subjects did not have enough time to decide which side to move in such a short time, we considered that the post-movement activity improved the classification as the subjects might perform in a rhythmic manner, for example, right and left alternatively.
In this study we aimed to predict human movement intention preceding the movement onset. Therefore, we checked the EMG activity carefully and manually marked the data and extracted the prediction window strictly before the movement onset. We found that the data epoching method in our study was different from a previous study that reported a higher classification accuracy in the prediction of movement intention (Blankertz et al. 2003). In the previous study, the prediction window was extracted with respect to the keypad trigger rather than movement or EMG onset. Although the delay between movement onset and keypad trigger onset was taken into account and an earlier time window for the prediction was set (−120 ms before keypad trigger onset), the prediction window would still pick up the activities after movement onset because of the variance of delay among trials. The EMG activity was found as early as −350 ms before the key stroke, and the error rate of classification was about 30%, i.e. the classification accuracy was about 70% if using the prediction window before −350 ms. This classification accuracy was similar to our results.
We would like explore more effective computational methods to classify human movement intention, and to know what neurophysiological signals can be used for the classification. Although there are many studies related to the single trial classification of movement intention, the results were not identical. For example, Pfurtscheller et al. reported a very high accuracy (89–100%) in an earlier study (Pfurtscheller et al. 1996), but more recently their group reported that the average classification accuracies using different mental strategies were from 56%–80% (Neuper et al. 2005). Although the subject-to-subject variance is a possible reason, we consider the accuracies depend on what kind of signals was used for the classification. We believe that careful study of the experimental design and neurophysiological signal analysis is crucial for appropriate classification. For example, in the pilot study performed in Pfurtscheller’s group (Pfurtscheller et al. 1996), the subjects performed a sustained motor imagery task for 3s with external cues. Although the classification accuracy was high, fatigue may be a problem in long-term BCI use due to sustained motor tasks. Because self-paced movement is a natural movement behavior, humans have less mental load when performing the self-paced movement.
In summary, since BCI is intended to provide a new communication pathway for severe neurological patients who lose voluntary movement, whether the developed BCI technology is suitable for the targeted patients should be considered before the simple evaluation of detection accuracy. There are two issues that should be addressed: one is the physiological analysis of the brain signal used for BCI communication in order to avoid possible contamination of EMG/EOG artifacts due to the well-known volume conduction effect in EEG signal. This problem has also been addressed previously (McFarland et al. 2005; Fatourechi et al. 2007). The second issue is the BCI paradigm design. It is preferable to select a paradigm that requires less mental load and less training due to the compromised condition of the targeted patients. Recent studies reported the fatigue problem when testing on targeted patients with amyotrophic lateral sclerosis (ALS), who were also unable to tolerate long-term training (Birbaumer 2006; Sellers and Donchin 2006). In this study, we aimed to explore computation methods to detect human movement intention associated with natural behavior on untrained subjects. Since the signal was associated with natural behavior, the paradigm was involved with less mental load. Although the signal-to-noise ratio can be improved through extensive training, the exploration of computational methods is more crucial when working on data with a lower signal-to-noise ratio.
For the above reasons, we think that our results are at least as sensitive as earlier studies and our data extraction method is more reasonable for the BCI purpose, where the actual movement will usually be unavailable.
Evaluation of testing accuracy and computational loads
We intended to explore optimal computational methods for the classification. To balance the repeated measurement of the testing accuracy, we designed an investigation on complete combinations of possible computational methods, i.e., a total of 90 combinations. Nonlinear optimization procedures were required for ‘ICA’, GA-based feature selections and nonlinear neural networks. Optimization of these nonlinear methods was highly time-consuming. In particular, for the GA-based feature selection, we investigated different numbers of best features. As a result, one experiment of investigation on 90 combinations required about 90 hours to produce one set of testing accuracy, where we worked on a HP workstation with Xeon 3.2GHz CPU and 2GB memory.
We recorded a relatively large size of samples (number of trials) for each subjects. With the data generation procedure, the testing samples were independent of the training samples. We wondered whether the testing accuracy from one experiment was unbiased since the testing samples were randomly selected from the sample pool and testing sample size was relatively small (20% of whole samples). Subgroup resampling, bootstrapping, and leave-one-out cross-validation methods are among suggested testing methods for pattern recognition. Usually, a bootstrapping method requires a large number of repetitions. The leave-one-out cross-validation may have the minimal variance of the estimation, but it has the largest computational expense. In particular, for this study, it was not practical because nonlinear optimization was required for each training procedure. Considering computational loads, we repeated the experiment of complete investigation of methods five times using subgroup resampling. In each experiment, the samples for training and testing were randomly selected from the same sample pool. Table 3 shows that the variance of the testing accuracy was not large (3.0% to 6.9%). The average of the testing accuracy from five experiments could be a close estimation.
Optimal spatial filter methods
For all spatial filters, the transformation matrix was determined in the training procedure. The testing data were rotated using the pre-determined matrix directly. Although the determination for ICA rotation was time-consuming during the training procedure, in which nonlinear optimization was required, the rotation in the testing procedure was fast and possible in real-time.
Both ‘ICA’ and ‘SLD’ provided better outcomes than other methods, although there was no significant difference between them. Consequently, we consider both as good spatial filter methods. Since ‘ICA’ requires nonlinear optimization, ‘SLD’ is definitely simpler and time-saving. We applied four orthogonal neighbor electrodes as the reference for ‘SLD’. This simple method provides a reference-free solution for common reference problems and as a result, may enhance local activities. However, the employed simple method might be inaccurate due to the different spatial distribution of underlying neuronal sources (McFarland et al. 1997). EEG inverse solutions might provide a more accurate estimation (Kamousi et al. 2005; Congedo et al. 2006), but their effectiveness needs further comparison study. From the comparison result of spatial filter, the average outcome using the ‘ICA’ approach was higher than that of ‘SLD’, although it was not significant. We considered that the variance of the ‘ICA’ approach was large because of its nonlinear optimization procedure. We might expect more accurate estimation of ICA rotation matrix from a large number of samples, whereas inaccurate estimation might be generated from a small number of samples. Therefore, we suggest the ‘ICA’ approach when the sample size (for training) is large; otherwise, the ‘SLD’ is a good choice.
The ‘CSP’ approach provided the lowest average accuracy in this comparison study. A few studies showed that the CSP method provided a better classification performance than other spatial filters; for example, ‘SLD’ by (Muller-Gerking et al. 1999), or ‘ICA’ by (Naeem et al. 2006), whereas we found that the CSP method was not better than the other methods in this study. One possible reason may be that we used high-density electrodes over the whole head, and the covariance matrix was 122×122, which might result in model over-fitting. From our data, the training accuracy using CSP method was as high as 80%–90%; the testing accuracy, however, was low. On the other hand, any artifacts or noise contaminated in the electrodes would make the covariance matrix meaningless. Therefore, to improve the generalization, some constraints, for example, reducing the matrix dimension, needs to be provided according to empirical knowledge as suggested in (Muller-Gerking et al. 1999).
Feature selection
We intended to compare the performance of different combinations of spatial filters, temporal filters and classifiers. The comparison of different feature selection methods was not the purpose of this study. For pattern recognition, there are many feature selection methods, such as exhaustive search, genetic algorithm-based searching, forward searching, and backward searching. Although the exhaustive search can avoid the local minima in the searching procedure, it is not practical in most cases due to huge computational loads. Other searching methods may have the problem of the local minima. The genetic algorithm has a better performance in solving the local minima problem. To reduce the risk of the local minima in the searching procedure, we employed the genetic algorithm-based feature selection method, although the computational loads were still large.
We used a high-density EEG to explore the classification of movement intention so that the feature dimension was very large. Although we could perform GA-based search from whole feature space, it is impractical due to the length of searching time and it is also risky due to the local minima problem in the searching so that we needed to determine an appropriate number of the pre-selected features to reduce the search loads. We did a pilot study to determine the pre-selection number of 100, 200 and 300. Although the features ranking outside 100 were selected in 200 and 300 searching, the classification accuracy from 100 was comparable with those of 200 and 300 searching. Therefore, we determined 100 as the number of the pre-selection feature size. The feature dimension can also be reduced according to empirical knowledge. However, the empirical approach may have risked the loss of useful features that may reduce the accuracy of this comparison study. This point in particular applies when considering the inter-subject differences in the distribution of the motor potentials. Due to the above differences, a careful inspection of individual motor potential is required. However, this will increase more manual power for the optimization, which is usually not preferred in a practical BCI. Furthermore, the information theory-based feature selection was found to not be robust to classify the motor potential in a previous study by (Yom-Tov and Inbar 2002). Based on the above considerations, we considered that the proposed feature selection method using GA algorithm is adequate for feature selection with less risk of losing useful features.
Optimal classification methods
It was not surprising that the ‘SVM’ approach provided a better solution than the other two neural network approaches. The reason might be that ‘SVM’ provided a better control of model complexity to avoid over-fitting. Because of this property, ‘SVM’ was the first choice of neural network method in BCI development, e.g. (Schlogl et al. 2005; Thulasidas et al. 2006).
It was interesting that simple statistical approaches provided a performance similar to the ‘SVM’ approach. This result suggested that the linear or quadratic statistical approaches, which provide a simple discriminant boundary, were sufficient to classify human movement intention. This result was consistent with the previous comparison study of classification methods, which also suggested simple linear approaches (Garrett et al. 2003; Rezaei et al. 2006).
We provided the individual classification results using a better combination of spatial filter, temporal filter and classification methods. We selected the ‘SVM’ as the classification method for reporting the individual classification accuracy because it was one of the better classification methods. However, we did not intend to use the ‘SVM’ as the ultimate classification method because the performance of ‘SVM’ was not significantly better than the performance of the statistical methods.
Feature analysis
Hemispheric asymmetry suggests that the contralateral hemisphere is predominantly involved with dominant hand movement, whereas both contralateral and ipsilateral hemispheres are involved with nondominant hand movement (Kawashima et al. 1993; Volkmann et al. 1998; Jung et al. 2003). For right-handed subjects, only the left sensorimotor cortex is activated during dominant right hand movement, whereas sensorimotor cortices of both right and left hemispheres are activated during nondominant left hand movement. Consequently, the major difference between right and left hand movements would be expected in the right sensorimotor cortex. In this study, the univariate analysis of Bhattacharyya distance was consistent with the above expectation. We observed that the beta band activity in the right sensorimotor cortex had the largest separability.
We observed both MRCP and ERD in alpha band during right and left hand movements. However, the separability of those two components was low, although the MRCP and alpha ERD difference between right and left hand movements could be observed. Although the mean difference of the MRCP preceding right and left hand movement was about 4 uV as shown in Fig. 4, it is not necessarily going to be an effective feature for the classification because we want to make the classification on a single trial basis so that the trial-to-trial variance is also very important. The small values of the Bhattacharyya distance in Fig. 5 suggested a large trial-to-trial variance of the near DC component of the MRCP. A feature with large inter-class difference but also with large trial-to-trial variance will not provide a robust classification. The large variance of alpha ERD might suggest that central alpha rhythm or Mu rhythm can be modulated by mental processes other than movement behavior. This idea is supported by a BCI approach of mental regulation of Mu rhythm (Wolpaw and McFarland 1994; Pfurtscheller et al. 2006). However, the mental regulation of Mu rhythm is not a natural human behavior so that long-term training is usually required for effective control.
We investigated high-frequency components above 40 Hz. We did not observe robust ERD/ERS during right and left hand movements. Further, the separability of high-frequency components measured from Bhattacharyya distance was also low. Our data did not support the idea that very high-frequency components (30Hz–200Hz) discriminate human movement intention, which was reported recently (Gonzalez et al. 2006). The reason might be the paradigm difference: self-paced vs. visuomotor reaction time. From the results of the current study, we considered that the high-frequency components observed by Gonzalez et al. might be related to the visual evoked response. Further, the possible contamination of EMG artifacts, which was noticed by (McFarland et al. 2005), would be another concern. Further evidence is needed to validate the suggested high-frequency components.
Movement intention and brain-computer interface
From this exploratory study, we confirmed that human intention to move either the right or left hand could be discriminated from scalp EEG when employing appropriate signal processing and pattern recognition methods. We consider that natural movements will activate normal physiological processes that can then be taken advantage of by detection techniques even in the absence of movement execution. We intend to achieve BCI control using human natural signals associated with natural movement intention, where movement intention will still be present even without movement execution. The natural movement intention presumably does not require training or effort, and the subjects should tire less. Therefore, the current outcome would provide a potential brain-computer interface under human natural movement behavior where the subject does not require long-term training.
Although this exploratory study was time-consuming, we expect that the time for the training procedure can be reduced significantly when optimal computational methods are determined, because we need not investigate all the combinations. Furthermore, the computational loads for the testing procedure are very small so that possible applications can be done on line or in real-time.
We also noticed that the subject variance of the classification accuracy was also large. In this study, the classification accuracy for four subjects was just higher than the random level (50–60%). It suggests that other BCI approaches might be required for these subjects.
The major purpose of the current study was to test the performance of identifying movement intention using different combinations of computational algorithms. The data analysis was performed on naïve subjects who had no BCI experience. However, we did not assess whether the performance can be improved after training, in particular, with feedback. This will be of interest in future studies.
Acknowledgments
This research was supported by the Intramural Research Program of the NIH, National Institute of Neurological Disorders and Stroke. The authors thank Hiroshi Shibasaki, MD, Takeda General Hospital, for extensive discussion on movement-related cortical potentials, Sungyung Auh, Ph.D., for her contributions to the statistical analysis, and Ms. D.G. Schoenberg for skillful editing.
Glossary
- ARX
auto-regressive exogenous input
- BCI
brain-computer interface
- BSC
Bayesian classifier
- CSP
common spatial patterns analysis
- DWT
discrete wavelet transforms
- EEG
electroencephalography
- EMG
electromyogram
- EOG
electrooculogram
- ERD
event-related desynchronization
- ERP
event-related potentials
- ERS
event-related synchronization
- GA
genetic algorithm
- ICA
independent component analysis
- IIR
infinite impulse response
- LMD
linear Mahalanobis distance classifier
- MLP
multi-layer perceptron neural network
- MRCPs
movement-related cortical potentials
- PCA
principal component analysis
- PNN
probabilistic neural network
- PSD
power spectral density estimation
- QMD
quadratic Mahalanobis distance classifier
- RBF
radial basis function
- SLD
surface Laplacian derivation
- SVM
support vector machine
- VAR
variance
Appendix
1. Filtering
1.1 Spatial Filtering
The spatial filter applies a transformation matrix that is determined under certain constraints to the EEG signal so that the filtered signal may have a better signal-to-noise ratio for identifying the changes of the underlying neuronal sources. This procedure is similar to beamforming, which can increase the gain in the direction of the task-related signals and decrease the gain in the direction of interference and noise (Rodriguez-Rivera et al. 2003). As a result, the spatial filter may improve classification accuracy. Five spatial filtering methods were explored. No spatial filtering was applied for ‘None’ method, which was for comparison purposes. The signal from electrodes was directly fed into the temporal filter.
‘PCA’ is a conventional data reduction method for pattern recognition. The high-dimensional training dataset including both right and left instances were decomposed into PCA components through linear orthonormal transformation, in which the eigenvectors with largest eigenvalues explained the major variance of the dataset. The orthonormal matrix was saved for the PCA transformation in the testing procedure. PCA has been successfully applied in identifying the waveform components of event-related potentials (ERP) (Carretie et al. 2004; Dien et al. 2005) and BCI approach (Vallabhaneni and He 2004). However, there is concern that eigenvectors with smaller eigenvalues may also provide crucial contributions to pattern recognition (Marques 2001). We retained all components from PCA transformation for the succeeding procedure. The components for constructing the classification model were determined in the feature selection procedure.
‘ICA’ transforms EEG signal into latent components or sources with maximal statistical independence. The rationale for ICA decomposition is more neurophysiologically sound, because it is reasonable to assume that neuronal sources are mutually independent and spatial projections of sources are not necessarily orthogonal, which is assumed for PCA-based source estimation. Makeig et al. demonstrated that ICA provided a better image of underlying neuronal sources than did PCA (Makeig et al. 1997). ICA had also been employed in several BCI approaches (Delorme and Makeig 2003; Piccione et al. 2006). For ICA decomposition, we need to select optimal components for further pattern classification. Empirical knowledge of the scalp distribution is usually required for identifying neurophysiologically meaningful components. However, the empirical approach might also risk losing useful features due to the limits of previous knowledge. In this paper, we employed the ‘data-driven’ or computational solution. Similar to PCA, the selection of ICA components was performed in the feature selection procedure. The ICA weighting matrix was achieved by an open source MATLAB routine using logistic infomax algorithm (Delorme and Makeig 2004). The determined ICA weighting matrix in the training procedure was used for the same decomposition in the testing procedure.
‘CSP’ can be considered as an optimal PCA approach, i.e., the common spatial patterns are obtained through PCA decomposition followed by a varimax rotation (Koles et al. 1995; Muller-Gerking et al. 1999). The CSP components are constrained to be as different as possible in the two task conditions. For the EEG signal in this study, the first common spatial pattern accounted for maximal variance in the right hand movement and minimal variance in the left hand movement. Similarly, the last common spatial pattern accounted for maximal variance in the left hand movement and minimal variance in the right hand movement. As a result, different task conditions can be more accurately discriminated from CSP components with larger inter-task variance (Guger et al. 2000). As a post hoc method, CSP is highly data-dependent and is sensitive to noise contamination so that the generalization of CSP-based classification needs to be validated. We retained all CSP components, and feature selection procedure determined the components for classification through cross-validation method.
‘SLD’ performs surface Laplacian transformation on multi-dimensional EEG signals. Realistic Laplacian transformation usually requires a head shape model, which can be constructed from brain imaging (Babiloni et al. 2003). We employed a simple method, which is also called a ‘reference-free’ method (Hjorth 1975) so that the signal is independent of which electrode is used as reference. The EEG signal from each electrode was referenced to the averaged potentials from four orthogonal nearby electrodes. SLD operation enhanced the spatial resolution of local EEG potentials by reducing the volume conduction effect. SLD applies a high-pass filter to suppress low-spatial frequency components along with volume conduction components so that the local synchronizations, in particular, their radial components, have increased spatial specificity (Pfurtscheller 1988) and as a result, the spatial difference following hand movements might be more discriminable.
1.2 Temporal Filtering
Three temporal filtering methods were explored. The temporal filters were performed on spatially filtered EEG trials. The signal power obtained from temporal filters was represented in logarithmic form. ‘VAR’ calculated the variance of the spatial filtered signal, i.e., whole frequency band power of the signal.
‘PSD’ estimated power spectral densities of the spatial filtered signal using the Welch method. A Hamming window was employed to reduce side lobe effect. The FFT length was set to 0.256 s resulting in a frequency resolution of approximately 4 Hz. Power spectral densities were smoothed from segments with 50% overlapping. A number of PSD estimation methods have been used in the signal processing literature, each of which varies in resolution and variance of the estimation. Periodogram or modified periodogram has higher spectral resolution, but the resulting variance is also larger than that of the Welch method (Welch 1967). The multitaper method provides a solution to balance the variance and resolution (Mitra and Pesaran 1999). However, an optimal multitaper method permits the trade-off between resolution and variance to usually be data-dependent (Percival and Walden 1993). We did not employ parametric methods, for example, using autoregressive model coefficients (Huan and Palaniappan 2004). The parametric model requires determining model order. Further, the model coefficients for classification are also indirect to frequencies, which are difficult for general neurophysiological analysis.
‘DWT’ provides multi-resolution representation of EEGs signal or components for time-frequency analysis. We adopted 8th-level one-dimensional decomposition using fourth-order Daubechies mother wavelet (Daubechies 1992). The variances of the DWT components were calculated. The corresponding central frequencies ranged from about 90 Hz to 1 Hz. For the issue of computational loads, we did not explore optimal approaches, for example, optimal filter bank design (Strang and Nguyen 1996).
3. Feature preprocessing
Features having large variances may dominate the learning process in the classifier training. The filtered data (features) were scaled to zero mean and unit standard deviation of 1 for numeric stabilization.
4. Feature selection
The spatially and temporally filtered EEG signals provided high-dimensional features; for example, 122 EEG channels with 32 frequency bins produced 3904 features. Because of the noisy nature of EEG, such high-dimensional features may bias the classification model producing a low testing accuracy. A compact subset of features needs to be determined for achieving a robust classification. The subset feature selection can be determined either empirically or ‘data-driven’. Because of the high dependence among features, the empirical approach usually does not provide a good solution. The exhaustive search method is one of the optimal feature selection methods, which evaluates all possible subsets to determine the best subsets. For example, the exhaustive search of a subset of 3 features from 3904 features results in more than 1 billion combinations. It is impractical to perform this due to the computational burden. We adopted a sub-optimal method of genetic algorithm-based search, which is a stochastic search in the feature space guided by the idea of inheriting, at each search step, good properties of the parent subsets found in previous steps (Raymer et al. 2000). One important procedure in the genetic algorithm-based feature selection is the evaluation of feature subsets. In this study, the feature subsets were evaluated on 5-fold cross-validation accuracy using a Linear Mahalanobis Distance (LMD) classifier in order to reduce the risk of over-training (Li et al. 2006). According to the evaluation of the feature subset, a new generation was created from the best of them. By repeating this procedure, a sub-optimal feature subset for the classification was determined. In this approach, the dimension of feature subset should be provided previously. We performed a pilot study to investigate an optimal dimension. Because of the difference in spatial and temporal filters, it was difficult to determine an optimal dimension. We proposed the strategy of grid search from 4 to 20 with step of 4 according to the finding in the pilot study. In GA approach, the population size was 20, the number of generations was 100, the crossover probability was 0.8, the mutation probability was 0.01, and the stall generation was 20.
Because of the large number of features, the convergence speed under GA was still very slow. For the purpose of faster convergence and less risk of local minima, we proposed an approach of pre-feature selection to pre-select features having larger Bhattacharyya distance between two task conditions. The Bhattacharyya distance is the square of mean difference between two task conditions divided by the variance of the samples in two task conditions (Marques 2001). The Bhattacharyya distance was calculated on each feature (univariate) in feature pool indexing the feature separability between two task conditions, which was somewhat similar to ANOVA statistic test by evaluating the volume of the pooled covariance matrix of the class relative to the separation of their means. As Bhattacharyya distance indexes the separability directly, it is preferable for feature selection with comparison of other indexing methods, for example, the Fisher Score which indexes the similarity. The features were sorted in descending order according to their Bhattacharyya distance; the first 100 features were retained for subsequent multivariate feature selection.
5. Classification
We explored three statistical classification and three neural network classification approaches. For pattern recognition, the simplest classification can be achieved by finding the minimum distance to the prototypes, usually the sample means under different tasks. For example, in the case of a two-feature two-class classification problem, the discriminant boundary is a straight line perpendicular to the linking of means and passing at half distance. Because the features are not necessarily mutually uncorrelated, we adopted linear and quadratic Mahalanobis distance, which takes covariance into account (Marques 2001). ‘LMD’ computed a pooled covariance matrix averaged from individual covariance matrices in two task conditions so that the discriminant boundary is hyper-planes leaning along the regression. ‘QMD’ computed individual covariance matrix for two task conditions so that the discriminant boundary is quadratic surfaces. It should be noticed that the discriminant boundary of ‘LMD’ passes through the midpoint of the line linking the means. In order to use the ‘LMD’ or ‘QMD’ to classify a test sample as belonging to the classes of right or left, the covariance matrix is estimated based on the training samples. Then, given a test sample, the Mahalanobis distance to each class is computed, and classifies the test sample as belonging to that class for which the Mahalanobis distance is minimal.
‘BSC’ also uses the Mahalanobis distance. It is categorized as the optimum classifier because it takes into account the prior probabilities or prevalences and the specific risks of a classification according to the well-known Bayes’ law. Similar to ‘LMD’, the covariance matrix in ‘BSC’ was calculated from the average of the individual covariance matrices in two task conditions. However, it is difficult to be optimal as prior probabilities are usually unknown in practice. Our goal was to discriminate human intention to move either the right or left hand. We expected the probabilities for right and left to be the same. From this prior assumption, we balanced the number of samples for both right and left hand movements during modeling and classification. Because of the same prior probabilities, we expected similar outcomes from ‘LMD’ and ‘BSC’. Because of the random sampling procedure for balancing samples, the outcomes would not be identical, but the difference would be negligible.
We explored three nonlinear classification approaches using neural networks. The neural network approaches provide more complicated discriminant boundaries, for example, by using polynomial functions. Theoretically, it may provide higher accuracy in classification tasks, at least in the training procedure. Successful applications in BCI development have also been reported (Garrett et al. 2003; Hung et al. 2005).
We designed a feed-forward 2-layer (1 hidden layer) multi-layer perceptron neural network in ‘MLP’ approach. The number of inputs was determined by feature selection. For classification purposes, the number of outputs was one. This design had a parameter of the number of hidden nodes, which determines the complexity of the neural network. In general, higher complexity will provide lower generalization, i.e., we may obtain a low testing accuracy although the training accuracy is high. Further, the neural network training, i.e., weight learning, is a nonlinear approach. The training error will be decreased with the increase of number of training iterations when an appropriate learning rate is provided for convergence issue. But, overtraining may also reduce the generalization of the classifier. We employed the multilayer perceptron training algorithm described in Netlab (Nabney 2004). We adopted log-sigmoid function as the activation function, and the scaled conjugate gradient algorithm for neural network training (Bishop 1995). In this approach, early stopping of training and the number of hidden nodes may control the risk of model over-fitting. These two parameters were optimally determined from a 2-D grid search under 5-fold cross-validation. The searching range for the early stopping was from 200 to 2000 with step of 200. The searching range for the hidden nodes was from 2 to 20 with step of 2. A pilot study was performed to determine the above ranges.
The probabilistic neural network is one type of radial basis function (RBF) network for classification purposes. The ‘PNN’ has alternative feed-forward architecture to the two-layer MLP. The ‘PNN’ approach has an advantage that an RBF network may provide a minimum approximating error, whereas the MLP approach does not (Girosi and Poggio 1990). However, on the other hand, RBF approach’s generalization should be considered in order to avoid over-fitting. We employed a probability neural network to classify human intention (Wasserman 1993). In the training procedure, the spread of radial basis functions was optimized from grid searching under 5-fold cross-validation. The searching range was 2K, K from −20 to 20 with step of 2.
Support vector machines (SVM) tackle the principle of structure risk minimization with the consideration of maximization of the margin of separation (Vapnik 1998). As a consequence, SVM can provide a good generalization performance independent of the sample distribution. As a promising method, SVM has been suggested in a number of BCI applications (Lal et al. 2004; Olson et al. 2005; Thulasidas et al. 2006). We employed a SVM approach provided in LIBSVM (Fan et al. 2005). We selected the RBF as the kernel function since the RBF kernel can provide a similar classification outcome compared with other kernels (Keerthi and Lin 2003). Two data-dependent parameters needed to be determined in the training procedure; the penalty parameter for controlling model complexity and the spread parameter for RBF functions. Similar to ‘MLP’ and ‘PNN’, a 2-D grid searching with 5-fold cross-validation was performed; 2K, K from −5 to 15 with step of 2 for the penalty parameter and 2K, K from −15 to 5 with step of 2 for the spread parameter.
Footnotes
This is a PDF file of an unedited manuscript that has been accepted for publication. As a service to our customers we are providing this early version of the manuscript. The manuscript will undergo copyediting, typesetting, and review of the resulting proof before it is published in its final citable form. Please note that during the production process errors may be discovered which could affect the content, and all legal disclaimers that apply to the journal pertain.
Contributor Information
Ou Bai, Human Motor Control Section, Medical Neurological Branch, National Institute of Neurological Disorders, National Institutes of Health, Bethesda, MD 20892, USA.
Peter Lin, Human Motor Control Section, Medical Neurological Branch, National Institute of Neurological Disorders, National Institutes of Health, Bethesda, MD 20892, USA.
Sherry Vorbach, Human Motor Control Section, Medical Neurological Branch, National Institute of Neurological Disorders, National Institutes of Health, Bethesda, MD 20892, USA.
Jiang Li, Department of Electrical and Computer Engineering, VMASC, Old Dominion University, Norfolk, VA 23529, USA.
Steve Furlani, Human Motor Control Section, Medical Neurological Branch, National Institute of Neurological Disorders, National Institutes of Health, Bethesda, MD 20892, USA.
Mark Hallett, Human Motor Control Section, Medical Neurological Branch, National Institute of Neurological Disorders, National Institutes of Health, Bethesda, MD 20892, USA.
References
- Babiloni F, Babiloni C, Carducci F, Romani GL, Rossini PM, Angelone LM, Cincotti F. Multimodal integration of high-resolution EEG and functional magnetic resonance imaging data: a simulation study. Neuroimage. 2003;19:1–15. doi: 10.1016/s1053-8119(03)00052-1. [DOI] [PubMed] [Google Scholar]
- Bai O, Mari Z, Vorbach S, Hallett M. Asymmetric spatiotemporal patterns of event-related desynchronization preceding voluntary sequential finger movements: a high-resolution EEG study. Clin Neurophysiol. 2005;116:1213–1221. doi: 10.1016/j.clinph.2005.01.006. [DOI] [PubMed] [Google Scholar]
- Bai O, Vorbach S, Hallett M, Floeter MK. Movement-related cortical potentials in primary lateral sclerosis. Ann Neurol. 2006;59:682–690. doi: 10.1002/ana.20803. [DOI] [PubMed] [Google Scholar]
- Birbaumer N. Brain-computer-interface research: coming of age. Clin Neurophysiol. 2006;117:479–483. doi: 10.1016/j.clinph.2005.11.002. [DOI] [PubMed] [Google Scholar]
- Birbaumer N, Kubler A, Ghanayim N, Hinterberger T, Perelmouter J, Kaiser J, Iversen I, Kotchoubey B, Neumann N, Flor H. The thought translation device (TTD) for completely paralyzed patients. IEEE Trans Rehabil Eng. 2000;8:190–193. doi: 10.1109/86.847812. [DOI] [PubMed] [Google Scholar]
- Bishop CM. Neural network for pattern recogniton. Oxford: Clarendon Press; 1995. [Google Scholar]
- Blankertz B, Dornhege G, Krauledat M, Muller KR, Kunzmann V, Losch F, Curio G. The Berlin Brain-Computer Interface: EEG-based communication without subject training. IEEE Trans Neural Syst Rehabil Eng. 2006;14:147–152. doi: 10.1109/TNSRE.2006.875557. [DOI] [PubMed] [Google Scholar]
- Blankertz B, Dornhege G, Schafer C, Krepki R, Kohlmorgen J, Muller KR, Kunzmann V, Losch F, Curio G. Boosting bit rates and error detection for the classification of fast-paced motor commands based on single-trial EEG analysis. IEEE Trans Neural Syst Rehabil Eng. 2003;11:127–131. doi: 10.1109/TNSRE.2003.814456. [DOI] [PubMed] [Google Scholar]
- Burke DP, Kelly SP, de Chazal P, Reilly RB, Finucane C. A parametric feature extraction and classification strategy for brain-computer interfacing. IEEE Trans Neural Syst Rehabil Eng. 2005;13:12–17. doi: 10.1109/TNSRE.2004.841881. [DOI] [PubMed] [Google Scholar]
- Carretie L, Tapia M, Mercado F, Albert J, Lopez-Martin S, de la Serna JM. Voltage-based versus factor score-based source localization analyses of electrophysiological brain activity: a comparison. Brain Topogr. 2004;17:109–115. doi: 10.1007/s10548-004-1008-1. [DOI] [PubMed] [Google Scholar]
- Castro A, Diaz F, van Boxtel GJ. What happens to the readiness potential when the movement is not executed? Neuroreport. 2005;16:1609–1613. doi: 10.1097/01.wnr.0000183331.51736.7f. [DOI] [PubMed] [Google Scholar]
- Cerutti S, Chiarenza G, Liberati D, Mascellani P, Pavesi G. A parametric method of identification of single-trial event-related potentials in the brain. IEEE Trans Biomed Eng. 1988;35:701–711. doi: 10.1109/10.7271. [DOI] [PubMed] [Google Scholar]
- Congedo M, Lotte F, Lecuyer A. Classification of movement intention by spatially filtered electromagnetic inverse solutions. Phys Med Biol. 2006;51:1971–1989. doi: 10.1088/0031-9155/51/8/002. [DOI] [PubMed] [Google Scholar]
- Daubechies I. Ten lectures on wavelets; CBMS-NSF conference series in applied mathematics; 1992. [Google Scholar]
- Delorme A, Makeig S. EEG changes accompanying learned regulation of 12-Hz EEG activity. IEEE Trans Neural Syst Rehabil Eng. 2003;11:133–137. doi: 10.1109/TNSRE.2003.814428. [DOI] [PubMed] [Google Scholar]
- Delorme A, Makeig S. EEGLAB: an open source toolbox for analysis of single-trial EEG dynamics including independent component analysis. J Neurosci Methods. 2004;134:9–21. doi: 10.1016/j.jneumeth.2003.10.009. [DOI] [PubMed] [Google Scholar]
- Dien J, Beal DJ, Berg P. Optimizing principal components analysis of event-related potentials: matrix type, factor loading weighting, extraction, and rotations. Clin Neurophysiol. 2005;116:1808–1825. doi: 10.1016/j.clinph.2004.11.025. [DOI] [PubMed] [Google Scholar]
- Donchin E, Spencer KM, Wijesinghe R. The mental prosthesis: assessing the speed of a P300-based brain-computer interface. IEEE Trans Rehabil Eng. 2000;8:174–179. doi: 10.1109/86.847808. [DOI] [PubMed] [Google Scholar]
- Fan R, Chen P, Lin C. Working set selection using the second order information for training SVM. Journal of Machine Learning Research. 2005;6:1889–1918. [Google Scholar]
- Fatourechi M, Bashashati A, Ward RK, Birch GE. EMG and EOG artifacts in brain computer interface systems: A survey. Clin Neurophysiol. 2007;118:480–494. doi: 10.1016/j.clinph.2006.10.019. [DOI] [PubMed] [Google Scholar]
- Garrett D, Peterson DA, Anderson CW, Thaut MH. Comparison of linear, nonlinear, and feature selection methods for EEG signal classification. IEEE Trans Neural Syst Rehabil Eng. 2003;11:141–144. doi: 10.1109/TNSRE.2003.814441. [DOI] [PubMed] [Google Scholar]
- Girosi F, Poggio T. Networks and best approximation property. Biol Cybern. 1990;63:169–176. [Google Scholar]
- Gonzalez SL, Grave de Peralta R, Thut G, Millan Jdel R, Morier P, Landis T. Very high frequency oscillations (VHFO) as a predictor of movement intentions. Neuroimage. 2006;32:170–179. doi: 10.1016/j.neuroimage.2006.02.041. [DOI] [PubMed] [Google Scholar]
- Guger C, Ramoser H, Pfurtscheller G. Real-time EEG analysis with subject-specific spatial patterns for a brain-computer interface (BCI) IEEE Trans Rehabil Eng. 2000;8:447–456. doi: 10.1109/86.895947. [DOI] [PubMed] [Google Scholar]
- Haaland KY, Harrington DL. Limb-sequencing deficits after left but not right hemisphere damage. Brain Cogn. 1994;24:104–122. doi: 10.1006/brcg.1994.1006. [DOI] [PubMed] [Google Scholar]
- Haaland KY, Harrington DL, Knight RT. Neural representations of skilled movement. Brain. 2000;123(Pt 11):2306–2313. doi: 10.1093/brain/123.11.2306. [DOI] [PubMed] [Google Scholar]
- Hinterberger T, Kubler A, Kaiser J, Neumann N, Birbaumer N. A brain-computer interface (BCI) for the locked-in: comparison of different EEG classifications for the thought translation device. Clin Neurophysiol. 2003;114:416–425. doi: 10.1016/s1388-2457(02)00411-x. [DOI] [PubMed] [Google Scholar]
- Hinterberger T, Schmidt S, Neumann N, Mellinger J, Blankertz B, Curio G, Birbaumer N. Brain-computer communication and slow cortical potentials. IEEE Trans Biomed Eng. 2004;51:1011–1018. doi: 10.1109/TBME.2004.827067. [DOI] [PubMed] [Google Scholar]
- Hjorth B. An on-line transformation of EEG scalp potentials into orthogonal source derivations. Electroencephalogr Clin Neurophysiol. 1975;39:526–530. doi: 10.1016/0013-4694(75)90056-5. [DOI] [PubMed] [Google Scholar]
- Huan NJ, Palaniappan R. Neural network classification of autoregressive features from electroencephalogram signals for brain-computer interface design. J Neural Eng. 2004;1:142–150. doi: 10.1088/1741-2560/1/3/003. [DOI] [PubMed] [Google Scholar]
- Hung CI, Lee PL, Wu YT, Chen LF, Yeh TC, Hsieh JC. Recognition of motor imagery electroencephalography using independent component analysis and machine classifiers. Ann Biomed Eng. 2005;33:1053–1070. doi: 10.1007/s10439-005-5772-1. [DOI] [PubMed] [Google Scholar]
- Jung P, Baumgartner U, Bauermann T, Magerl W, Gawehn J, Stoeter P, Treede RD. Asymmetry in the human primary somatosensory cortex and handedness. Neuroimage. 2003;19:913–923. doi: 10.1016/s1053-8119(03)00164-2. [DOI] [PubMed] [Google Scholar]
- Kamousi B, Liu Z, He B. Classification of motor imagery tasks for brain-computer interface applications by means of two equivalent dipoles analysis. IEEE Trans Neural Syst Rehabil Eng. 2005;13:166–171. doi: 10.1109/TNSRE.2005.847386. [DOI] [PubMed] [Google Scholar]
- Kawashima R, Yamada K, Kinomura S, Yamaguchi T, Matsui H, Yoshioka S, Fukuda H. Regional cerebral blood flow changes of cortical motor areas and prefrontal areas in humans related to ipsilateral and contralateral hand movement. Brain Res. 1993;623:33–40. doi: 10.1016/0006-8993(93)90006-9. [DOI] [PubMed] [Google Scholar]
- Keerthi SS, Lin C. Asymptotic behaviors of support vector machines with Gaussian kernel. Neural Computation. 2003;15:1667–1689. doi: 10.1162/089976603321891855. [DOI] [PubMed] [Google Scholar]
- Kim KH, Kim SS, Kim SJ. Superiority of nonlinear mapping in decoding multiple single-unit neuronal spike trains: a simulation study. J Neurosci Methods. 2006;150:202–211. doi: 10.1016/j.jneumeth.2005.06.015. [DOI] [PubMed] [Google Scholar]
- Koles ZJ, Lind JC, Soong AC. Spatio-temporal decomposition of the EEG: a general approach to the isolation and localization of sources. Electroencephalogr Clin Neurophysiol. 1995;95:219–230. doi: 10.1016/0013-4694(95)00083-b. [DOI] [PubMed] [Google Scholar]
- Lal TN, Schroder M, Hinterberger T, Weston J, Bogdan M, Birbaumer N, Scholkopf B. Support vector channel selection in BCI. IEEE Trans Biomed Eng. 2004;51:1003–1010. doi: 10.1109/TBME.2004.827827. [DOI] [PubMed] [Google Scholar]
- Li J, Yao J, Summers RM, Petrick N, T MM, Hara AT. An efficient feature selection algorithm for computer-aided polyp detection. International Journal on Artificial Intelligence Tools. 2006;15:893–915. [Google Scholar]
- Makeig S, Jung TP, Bell AJ, Ghahremani D, Sejnowski TJ. Blind separation of auditory event-related brain responses into independent components. Proc Natl Acad Sci U S A. 1997;94:10979–10984. doi: 10.1073/pnas.94.20.10979. [DOI] [PMC free article] [PubMed] [Google Scholar]
- Marques JP. Pattern recognition: concepts, methods and applications. Berlin: Springer-Verlag; 2001. [Google Scholar]
- McFarland DJ, Anderson CW, Muller KR, Schlogl A, Krusienski DJ. BCI Meeting 2005--workshop on BCI signal processing: feature extraction and translation; IEEE Trans Neural Syst Rehabil Eng; 2006. pp. 135–138. [DOI] [PubMed] [Google Scholar]
- McFarland DJ, McCane LM, David SV, Wolpaw JR. Spatial filter selection for EEG-based communication. Electroencephalogr Clin Neurophysiol. 1997;103:386–394. doi: 10.1016/s0013-4694(97)00022-2. [DOI] [PubMed] [Google Scholar]
- McFarland DJ, Sarnacki WA, Vaughan TM, Wolpaw JR. Brain-computer interface (BCI) operation: signal and noise during early training sessions. Clin Neurophysiol. 2005;116:56–62. doi: 10.1016/j.clinph.2004.07.004. [DOI] [PubMed] [Google Scholar]
- Mitra PP, Pesaran B. Analysis of dynamic brain imaging data. Biophys J. 1999;76:691–708. doi: 10.1016/S0006-3495(99)77236-X. [DOI] [PMC free article] [PubMed] [Google Scholar]
- Muller-Gerking J, Pfurtscheller G, Flyvbjerg H. Designing optimal spatial filters for single-trial EEG classification in a movement task. Clin Neurophysiol. 1999;110:787–798. doi: 10.1016/s1388-2457(98)00038-8. [DOI] [PubMed] [Google Scholar]
- Nabney I. Netlab: Algorithms for Pattern Recognition. London: Springer; 2004. [Google Scholar]
- Naeem M, Brunner C, Leeb R, Graimann B, Pfurtscheller G. Seperability of four-class motor imagery data using independent components analysis. J Neural Eng. 2006;3:208–216. doi: 10.1088/1741-2560/3/3/003. [DOI] [PubMed] [Google Scholar]
- Neuper C, Scherer R, Reiner M, Pfurtscheller G. Imagery of motor actions: differential effects of kinesthetic and visual-motor mode of imagery in single-trial EEG. Brain Res Cogn Brain Res. 2005;25:668–677. doi: 10.1016/j.cogbrainres.2005.08.014. [DOI] [PubMed] [Google Scholar]
- Nunez PL, Srinivasan R, Westdorp AF, Wijesinghe RS, Tucker DM, Silberstein RB, Cadusch PJ. EEG coherency. I: Statistics, reference electrode, volume conduction, Laplacians, cortical imaging, and interpretation at multiple scales. Electroencephalogr Clin Neurophysiol. 1997;103:499–515. doi: 10.1016/s0013-4694(97)00066-7. [DOI] [PubMed] [Google Scholar]
- Oldfield RC. The assessment and analysis of handedness: the Edinburgh inventory. Neuropsychologia. 1971;9:97–113. doi: 10.1016/0028-3932(71)90067-4. [DOI] [PubMed] [Google Scholar]
- Olson BP, Si J, Hu J, He J. Closed-loop cortical control of direction using support vector machines. IEEE Trans Neural Syst Rehabil Eng. 2005;13:72–80. doi: 10.1109/TNSRE.2004.843174. [DOI] [PubMed] [Google Scholar]
- Percival DB, Walden AT. Spectral Analysis for Physical Applications: Multitaper and Conventional Univariate Techniques. Cambridge: Cambridge University Press; 1993. [Google Scholar]
- Pfurtscheller G. Mapping of event-related desynchronization and type of derivation. Electroencephalogr Clin Neurophysiol. 1988;70:190–193. doi: 10.1016/0013-4694(88)90119-8. [DOI] [PubMed] [Google Scholar]
- Pfurtscheller G, Brunner C, Schlogl A, Lopes da Silva FH. Mu rhythm (de)synchronization and EEG single-trial classification of different motor imagery tasks. Neuroimage. 2006;31:153–159. doi: 10.1016/j.neuroimage.2005.12.003. [DOI] [PubMed] [Google Scholar]
- Pfurtscheller G, Kalcher J, Neuper C, Flotzinger D, Pregenzer M. On-line EEG classification during externally-paced hand movements using a neural network-based classifier. Electroencephalogr Clin Neurophysiol. 1996;99:416–425. doi: 10.1016/s0013-4694(96)95689-8. [DOI] [PubMed] [Google Scholar]
- Pfurtscheller G, Zalaudek K, Neuper C. Event-related beta synchronization after wrist, finger and thumb movement. Electroencephalogr Clin Neurophysiol. 1998;109:154–160. doi: 10.1016/s0924-980x(97)00070-2. [DOI] [PubMed] [Google Scholar]
- Pham M, Hinterberger T, Neumann N, Kubler A, Hofmayer N, Grether A, Wilhelm B, Vatine JJ, Birbaumer N. An auditory brain-computer interface based on the self-regulation of slow cortical potentials. Neurorehabil Neural Repair. 2005;19:206–218. doi: 10.1177/1545968305277628. [DOI] [PubMed] [Google Scholar]
- Piccione F, Giorgi F, Tonin P, Priftis K, Giove S, Silvoni S, Palmas G, Beverina F. P300-based brain computer interface: reliability and performance in healthy and paralysed participants. Clin Neurophysiol. 2006;117:531–537. doi: 10.1016/j.clinph.2005.07.024. [DOI] [PubMed] [Google Scholar]
- Raymer ML, Punch WF, Goodman ED, Kuhn LA, Jain AK. Dimensionality reduction using genetic algorithms. Evolutionary Computation, IEEE Transactions on. 2000;4:164–171. [Google Scholar]
- Rezaei S, Tavakolian K, Nasrabadi AM, Setarehdan SK. Different classification techniques considering brain computer interface applications. J Neural Eng. 2006;3:139–144. doi: 10.1088/1741-2560/3/2/008. [DOI] [PubMed] [Google Scholar]
- Rodriguez-Rivera A, Van Veen BD, Wakai RT. Statistical performance analysis of signal variance-based dipole models for MEG/EEG source localization and detection. IEEE Trans Biomed Eng. 2003;50:137–149. doi: 10.1109/TBME.2002.807661. [DOI] [PubMed] [Google Scholar]
- Schlogl A, Lee F, Bischof H, Pfurtscheller G. Characterization of four-class motor imagery EEG data for the BCI-competition 2005. J Neural Eng. 2005;2:L14–L22. doi: 10.1088/1741-2560/2/4/L02. [DOI] [PubMed] [Google Scholar]
- Sellers EW, Donchin E. A P300-based brain-computer interface: initial tests by ALS patients. Clin Neurophysiol. 2006;117:538–548. doi: 10.1016/j.clinph.2005.06.027. [DOI] [PubMed] [Google Scholar]
- Shibasaki H, Sadato N, Lyshkow H, Yonekura Y, Honda M, Nagamine T, Suwazono S, Magata Y, Ikeda A, Miyazaki M, Fukuyama H, Asato R, Konishi J. Both primary motor cortex and supplementary motor area play an important role in complex finger movement. Brain. 1993;116(Pt 6):1387–1398. doi: 10.1093/brain/116.6.1387. [DOI] [PubMed] [Google Scholar]
- Sochurkova D, Rektor I. Event-related desynchronization/synchronization in the putamen. An SEEG case study. Exp Brain Res. 2003;149:401–404. doi: 10.1007/s00221-003-1371-2. [DOI] [PubMed] [Google Scholar]
- Soyuer F, Erdogan F, Senol V, Arman F. The relationship between fatigue and depression, and event-related potentials in epileptics. Epilepsy Behav. 2006;8:581–587. doi: 10.1016/j.yebeh.2006.01.013. [DOI] [PubMed] [Google Scholar]
- Stancak A, Jr, Pfurtscheller G. Event-related desynchronisation of central beta-rhythms during brisk and slow self-paced finger movements of dominant and nondominant hand. Brain Res Cogn Brain Res. 1996;4:171–183. doi: 10.1016/s0926-6410(96)00031-6. [DOI] [PubMed] [Google Scholar]
- Strang G, Nguyen T. Wavelets and filter banks. Wellesley: Wellesley-Cambridge Press; 1996. [Google Scholar]
- Thulasidas M, Guan C, Wu J. Robust classification of EEG signal for brain-computer interface. IEEE Trans Neural Syst Rehabil Eng. 2006;14:24–29. doi: 10.1109/TNSRE.2005.862695. [DOI] [PubMed] [Google Scholar]
- Tie Y, Sahin M. Separation of spinal cord motor signals using the FastICA method. J Neural Eng. 2005;2:90–96. doi: 10.1088/1741-2560/2/4/004. [DOI] [PubMed] [Google Scholar]
- Toro C, Cox C, Friehs G, Ojakangas C, Maxwell R, Gates JR, Gumnit RJ, Ebner TJ. 8–12 Hz rhythmic oscillations in human motor cortex during two-dimensional arm movements: evidence for representation of kinematic parameters. Electroencephalogr Clin Neurophysiol. 1994a;93:390–403. doi: 10.1016/0168-5597(94)90127-9. [DOI] [PubMed] [Google Scholar]
- Toro C, Deuschl G, Thatcher R, Sato S, Kufta C, Hallett M. Event-related desynchronization and movement-related cortical potentials on the ECoG and EEG. Electroencephalogr Clin Neurophysiol. 1994b;93:380–389. doi: 10.1016/0168-5597(94)90126-0. [DOI] [PubMed] [Google Scholar]
- Townsend G, Graimann B, Pfurtscheller G. A comparison of common spatial patterns with complex band power features in a four-class BCI experiment. IEEE Trans Biomed Eng. 2006;53:642–651. doi: 10.1109/TBME.2006.870237. [DOI] [PubMed] [Google Scholar]
- Vallabhaneni A, He B. Motor imagery task classification for brain computer interface applications using spatiotemporal principle component analysis. Neurol Res. 2004;26:282–287. doi: 10.1179/016164104225013950. [DOI] [PubMed] [Google Scholar]
- Vapnik VN. Statistical learning theory. New York: Wiley; 1998. [Google Scholar]
- Volkmann J, Schnitzler A, Witte OW, Freund H. Handedness and asymmetry of hand representation in human motor cortex. J Neurophysiol. 1998;79:2149–2154. doi: 10.1152/jn.1998.79.4.2149. [DOI] [PubMed] [Google Scholar]
- Wang Y, Zhang Z, Li Y, Gao X, Gao S, Yang F. BCI Competition 2003--Data set IV: an algorithm based on CSSD and FDA for classifying single-trial EEG. IEEE Trans Biomed Eng. 2004;51:1081–1086. doi: 10.1109/TBME.2004.826697. [DOI] [PubMed] [Google Scholar]
- Wasserman PD. Advanced Methods in Neural Computing. New York: Van Nostrand Reinhold; 1993. [Google Scholar]
- Welch PD. The Use of Fast Fourier Transform for the Estimation of Power Spectra: A Method Based on Time Averaging Over Short, Modified Periodograms. IEEE Trans. Audio Electroacoust. 1967;AU-15:70–73. [Google Scholar]
- Wolpaw JR, McFarland DJ. Multichannel EEG-based brain-computer communication. Electroencephalogr Clin Neurophysiol. 1994;90:444–449. doi: 10.1016/0013-4694(94)90135-x. [DOI] [PubMed] [Google Scholar]
- Wolpaw JR, McFarland DJ. Control of a two-dimensional movement signal by a noninvasive brain-computer interface in humans. Proc Natl Acad Sci U S A. 2004;101:17849–17854. doi: 10.1073/pnas.0403504101. [DOI] [PMC free article] [PubMed] [Google Scholar]
- Wolpaw JR, McFarland DJ, Neat GW, Forneris CA. An EEG-based brain-computer interface for cursor control. Electroencephalogr Clin Neurophysiol. 1991;78:252–259. doi: 10.1016/0013-4694(91)90040-b. [DOI] [PubMed] [Google Scholar]
- Yom-Tov E, Inbar GF. Feature selection for the classification of movements from single movement-related potentials. IEEE Trans Neural Syst Rehabil Eng. 2002;10:170–177. doi: 10.1109/TNSRE.2002.802875. [DOI] [PubMed] [Google Scholar]