

Abstract
As a first step towards developing a dynamic model of the rat hindlimb, we measured muscle attachment and joint center coordinates relative to bony landmarks using stereophotogrammetry. Using these measurements, we analyzed muscle moment arms as functions of joint angle for most hindlimb muscles, and tested the hypothesis that postural change alone is sufficient to alter the function of selected muscles of the leg. We described muscle attachment sites as second-order curves. The length of the fit parabola and residual errors in the orthogonal directions give an estimate of muscle attachment sizes, which are consistent with observations made during dissection. We modeled each joint as a moving point dependent on joint angle; relative endpoint errors less than 7% indicate this method is accurate. Most muscles have moment arms with a large range across the physiological domain of joint angles, but their moment arms peak and vary little within the locomotion domain. The small variation in moment arms during locomotion potentially simplifies the neural control requirements during this phase. The moment arms of a number of muscles cross zero as angle varies within the quadrupedal locomotion domain, indicating they are intrinsically stabilizing. However in the bipedal locomotion domain, the moment arms of these muscles do not cross zero and thus are no longer intrinsically stabilizing. We found that muscle function is largely determined by the change in moment arm with joint angle, particularly the transition from quadrupedal to bipedal posture, which may alter an intrinsically stabilizing arrangement or change the control burden.
Keywords: Locomotion, Posture, Moment Arm, Joint Center
Introduction
Currently, the rat is one of the preferred animal models for developing and testing treatments for spinal cord injury (SCI). Cellular and pharmacological (McDonald, Liu et al. 1999; Hauben, Butovsky et al. 2000; Ramon-Cueto, Cordero et al. 2000) as well as technological (Teng, Lavik et al. 2002; Timoszyk, de Leon et al. 2002) interventions are currently being developed using rodent models. Motor tasks such as locomotion are commonly selected as outcome measures since they are important, complex behaviors that can be visualized and quantified. However, the complexity of locomotion can make interpretation of behavioral outcomes difficult. For example, compensatory mechanisms can mask motor deficits. Alternatively failures in one part of a complex integrated system can severely disrupt behavior. Moreover, behavioral tasks can be difficult to standardize across experimental preparations. For example, SCI studies may use quadrupedal or bipedal locomotion as motor tasks depending on the specific nature of the lesions and other experimental parameters (e.g. McDonald, Liu et al. 1999; Timoszyk, de Leon et al. 2002). Understanding the different mechanical requirements of quadrupedal vs. bipedal locomotion may assist in interpreting functional capabilities within and between both conditions.
Musculoskeletal modeling can be useful for understanding the biomechanics and control of movement, and for developing devices to restore function following an injury (Zhao, Kirsch et al. 1998; Abbas and Riener 2001). Although detailed models have been developed for the human (Yamaguchi and Zajac 1990; Schutte, Rodgers et al. 1993), and other animals such as the cat (Burkholder and Nichols 2004), quantitative data are limited for rats. For example, quantitative measurements of rat musculoskeletal morphology and physiology are largely limited to the major flexors and extensors of the hindlimbs (Roy, Meadows et al. 1982; Roy, Powell et al. 1984; Roy, Baldwin et al. 1985; Huijing, Baan et al. 1998).
This paper describes the first steps in the development of a dynamic musculoskeletal model of the rat hindlimb. We measured muscle origin and insertion coordinates relative to bony landmarks, joint centers, and muscle moment arms as a function of joint angle for most muscles of the hindlimb. We used these measurements to construct a quasi-static model of the hindlimb.
Development of this model required us to answer the following questions: First, can joint centers of the hindlimb be approximated by simple functions dependent on joint angles? Second, can muscle attachment sites be approximated by low-order curves and are the centroids of those curves sufficient to describe the attachments? We used the model to test the hypothesis that postural change alone, and particularly the transition from quadrupedal to bipedal posture, is sufficient to alter the function of selected leg muscles.
Methods
Unless otherwise noted, all coordinate transforms, joint center identifications, muscle attachment site fits, and moment arm calculations were done with custom programs developed in MATLAB (The MathWorks, Natick, Massachusetts).
Specimen variability and normalization
Seven female Sprague-Dawley rats (280 ± 16 g body weight) were used. All experiments were conducted within the animal welfare regulations of the institutional animal care and use committee. All measurements were normalized to the segment sizes of the first specimen. The size characteristics are shown in Table 1.
Table 1.
Anatomical data for the seven rats used in the experiment.
| Experiment | Rat # | Weight (g) | Tibia length (mm) | Femur length (mm) |
|---|---|---|---|---|
| Muscle attachment site identification | 1 | 285 | 39 | 35 |
| 2 | 309 | 41 | 36 | |
| 3 | 294 | 40 | 35 | |
| Joint center identification | 4 | 267 | 40 | 36 |
| 5 | 259 | 39 | 34 | |
| 6 | 271 | 39 | 35 | |
| 7 | 268 | 39 | 34 |
Digitization of muscle origins and insertions
Muscle origin and insertion coordinates were quantified using stereophotogrammetry. Two digital cameras were mounted on either side of the dissection area so that their fields of view differed by approximately 90°. Needles (20 gauge × 1 in) were placed in each of the spine, hip, femur, tibia and foot segments so that three were visible in any orientation as landmarks.
Muscles were successively dissected away from the bone, and pairs of photographs taken, each containing an attachment site and three pin landmarks. For those muscles that consistently changed direction about another structure (e.g. passing under the annular ligament), that intermediate point was termed a via point and recorded. The rat was anesthetized (100 mg/kg ketamine plus 5mg/kg xylazine, intraperitoneally) during the early dissection to maintain muscle definition and pliability, and euthanized (125 mg/kg sodium pentobarbital, intraperitoneally) when it became necessary to cut the femoral artery to dissect the crural and ventromedial hip muscles.
A commercial stereophotogrammetry program (SIMI Motion; SIMI Reality Motion Systems, Unterschleissheim, Germany) was used to find 3-D coordinates of each origin and insertion in an arbitrary camera coordinate system (CCS1). One to three points on each feature were digitized in each photograph, according to the size of the origin or insertion. Each feature was photographed one to three times per specimen, and all points combined after conversion to the bone reference frame as described below. No distinction was made between multiple points digitized from the same photograph, and points digitized from different photographs. This resulted in 3 to 27 digitized points per attachment site.
Conversion to bone reference frames
After dissection, the bones were denuded and photographed. The coordinates of the pins and bony landmarks were identified in a second camera coordinate system, and then converted by direct linear transformation to the bone coordinate system (BCS) shown in Figure 1 and Table 2, with anatomical landmark abbreviations in Table 3. Once the pin coordinates were known in both CCS1 and BCS, a rotation matrix between those coordinate systems was found using a least-squares algorithm (Goryn and Hein 1995) to account for noise introduced in the digitization process. Finally, the rotation was applied to the muscle origin and insertion points identified in CCS1.
Figure 1.
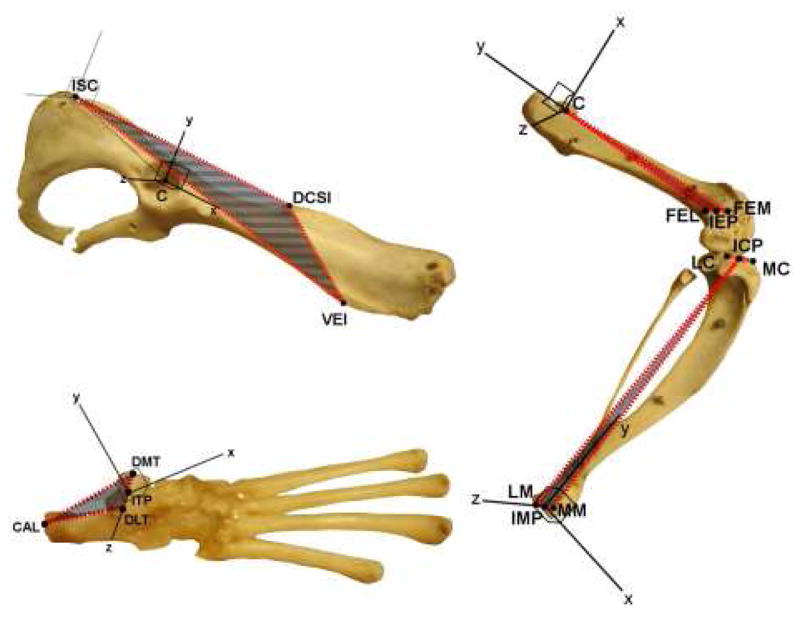
Bone coordinate system definitions. Shaded areas bounded by red represent the planes orthogonal to which axes were defined. Zero angle was defined as the angle for which the axes of proximal and distal segments were oriented the same. Abbreviations are given in Table 3.
Table 2.
Bone coordinate system axis definitions. Abbreviations are given in Table 3. Geometric rotations around the Z, X, and Y axes of the proximal segment correspond to flexion/extension, adduction/abduction, and internal/external (anatomical) rotation, respectively. Adduction, internal rotation, hip flexion, knee extension and ankle dorsiflexion are positive geometric rotations.
| Segment | Axis | Definition |
|---|---|---|
| Hip | Origin | C |
| x | Parallel to the line through DCSI and ISC, pointing cranial | |
| y | Parallel to the projection of the line through DCSI and VEI onto the plane normal to x, pointing dorsal | |
| z | Parallel to a line orthogonal to x and y, pointing lateral | |
| Femur | Origin | C |
| x | Parallel to a line orthogonal to y and z, pointing cranial | |
| y | The line through C and IEP, pointing proximal | |
| z | Parallel to the projection of the line through FEM and FEL onto the plane normal to y, pointing lateral | |
| Tibia | Origin | IMP |
| x | Parallel to a line normal to the plane formed by MM, LM and ICP, pointing cranial | |
| y | Parallel to a line orthogonal to x and z, pointing proximal | |
| z | The line through MM and LM, pointing right | |
| Foot | Origin | ITP |
| x | Parallel to a line normal to the plane formed by DMT, DLT and CAL, pointing cranial | |
| y | Parallel to a line orthogonal to x and z, pointing dorsal | |
| z | The line through DMT and DLT, pointing lateral |
Table 3.
| Adductor Magnus | AM |
| Biceps Femoris Anterior | BFA |
| Extensor Digitorum Longus | EDL |
| Gemellus Inferior | GI |
| Gluteus Maximus | GMa |
| Tibialis Anterior | TA |
| Dorsocaudal extremity of the ischium | ISC |
| Dorsocaudal extremity of the spine of ilium | DCSI |
| Ventral extremity of the ilium | VEI |
| Center of the head of the femur or its socket | C |
| Medial epicondyle of the femur | FEM |
| Lateral epicondyle of the femur | FEL |
| Inter-epicondylar point | IEP |
| Medial condyle of the tibia | MC |
| Lateral condyle of the tibia | LC |
| Inter-condylar point | ICP |
| Medial maleolus of the tibia | MM |
| Lateral maleolus of the tibia | LM |
| Inter-maleolar point | IMP |
| Posterior extremity of calcaneus | CAL |
| Dorsomedial extremity of talus | DMT |
| Dorsolateral extremity of talus | DLT |
| Inter-talar point | ITP |
Joint center identification
Joint rotation centers and axes were found using the stereophotogrammetry process described above. Pins were inserted into the bones, and joints were moved through their natural range while photographs were taken. Pin coordinates were found in CCS1, and then the bones were denuded and photographed to produce pin coordinates in BCS as described above. Instantaneous joint axes were found using Woltring’s (1985) method. An average joint center was found as the least squares estimate of the intersection of the instantaneous axes, and instantaneous joint centers were found as the projection of the average center onto the instantaneous axis.
Functions of zero through second order were fit to the instantaneous joint center data. Relative error was calculated as the mean distance between the experimentally measured locations of the endpoint of the distal segment and the endpoints found using the joint center fit, normalized to the length of the distal segment (Table 4). The joint center location, relative to either the proximal or distal segment, as a first-order function of the angles between the segments is
Table 4.
Errors resulting from zero-, first- or second-order fits of joint center position change with angle. Mean error is the mean distance between experimental and calculated endpoints of the distal segment taken across the range of angles; relative error is mean error normalized to the length of the distal segment as tabulated in Table 1.
| Joint | Order | Mean Error (mm) | Relative Error (%) |
|---|---|---|---|
| Hip | 0 | 1.90 | 7.0 |
| 1 | 1.79 | 6.6 | |
| 2 | 1.98 | 7.3 | |
| Knee | 0 | 1.55 | 4.1 |
| 1 | 1.56 | 4.1 | |
| 2 | 1.66 | 4.4 | |
| Ankle | 0 | 1.72 | 4.5 |
| 1 | 1.53 | 4.0 | |
| 2 | 1.73 | 4.6 |
| (1) |
where θ, φ, ψ are rotation angles about the Z, X, and Y axes respectively.
Moment arm calculation
Because multiple points were digitized for each muscle origin or insertion, it was necessary to reduce these data to generate a single muscle line of action. We digitized points defining the shape of the muscle attachment rather than its centroid. Points from all specimens were combined after normalization to specimen size. A second-order (or first-order if less than five points were digitized) function then was fit to the digitized points. Muscle origins and insertions were taken as the centroids of these fits (Fig. 2): note that the centroid of the fit is not equivalent to the mean location of the digitized points. We define attachment breadth to be the triplet composed of fit curve length and residual error in the two orthogonal directions. The moment arm of the muscle is the outer product of the unit vector in the direction of the muscle line of action and the vector representing the insertion site’s radius from the joint center (Fig. 2).
Figure 2.
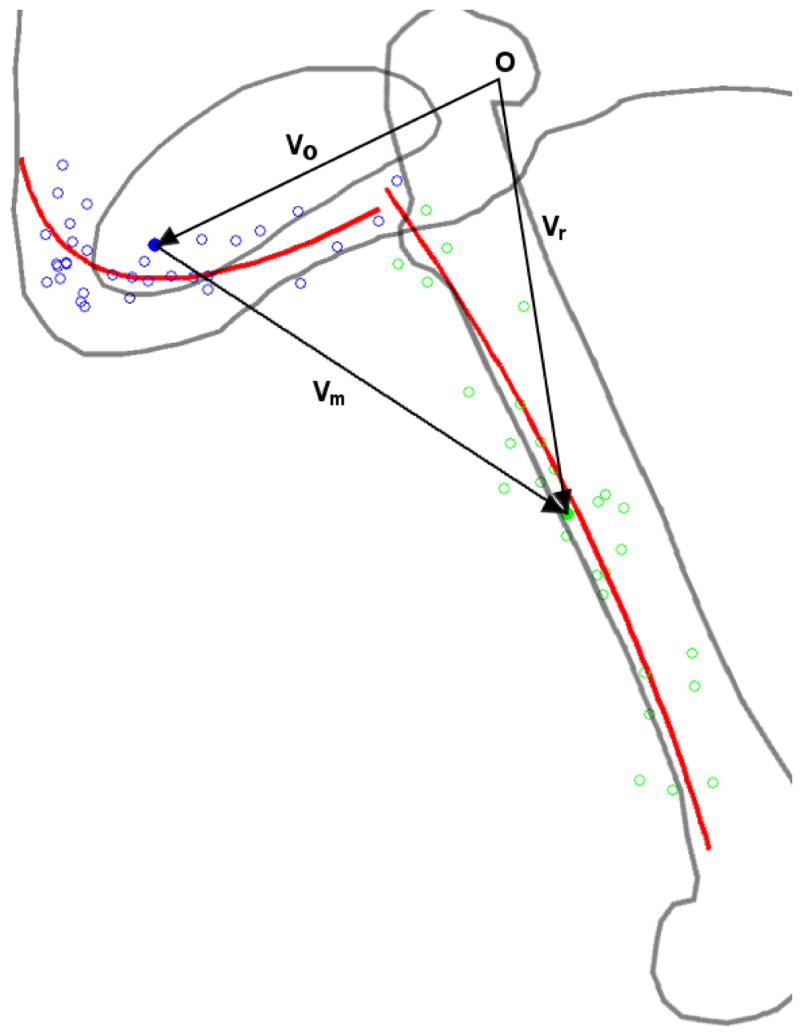
Depiction of the stereotyped shape fit to the digitized muscle attachment points. Adductor brevis origin appears in blue, with digitized points hollow and calculated centroid solid. Insertion likewise appears in green. Red lines indicate the best fit parabolas to the points. Vectors used in calculating moment arm are shown in black, as is the origin. vo and vr indicate the vectors from the joint center to the origin and insertion centroids of the muscle respectively. vm indicates the line of action of the muscle, from origin to insertion centroid. In the case of the hip, proximal and distal reference frame origins (indicated by O) coincide.
Locomotion joint angle measurement
To find the range of joint angles associated with bipedal locomotion in rats, we allowed 5 rats to walk on a treadmill at a speed of 13 cm/s, while supported in a bipedal posture by a body harness with automated partial body weight support (Kubasak, Jindrich et al. in press). Retroreflective markers were placed on the iliac crest, greater trochanter, lateral condyle, lateral malleolus and distal metatarsal, and their positions tracked using a 4 camera motion capture system. Internal joint angles were calculated using custom MATLAB routines.
Results
Physical measurements of a calibration block used in the stereophotogrammetry procedures were compared with measurements derived from its digitized coordinates. RMS error for 28 measurements filling the viewing volume was 0.22 mm, while twenty repeated measurements of a single point resulted in a standard deviation of 0.08 mm.
Joint Centers
For the hip and ankle, a first-order joint center fit minimized the error. For the knee, zero- and first-order fits gave nearly identical error. The parameters of the first-order fit joint center functions are shown in Table 5. A description of their movement as a result of flexion and extension is as follows: hip extension results in slight rostral and ventral translation of the head of the femur. During flexion of the knee, the condyles of the tibia slide toward the extensor surface of the femur. When the ankle is extended, the foot translates laterally while rotating about a point plantar to the talocrural interface.
Table 5.
First-order joint center fit parameters. The first column indicates the joint in question and the second column indicates which segment the center coordinates are relative to. Parameters are used in Equation 1 to determine joint center position.
| x | y | z | |||||||||||
|---|---|---|---|---|---|---|---|---|---|---|---|---|---|
| ax0 | ax1 | bx1 | cx1 | ay0 | ay1 | by1 | cy1 | az0 | az1 | bz1 | cz1 | ||
| Hip | Pelvis | 0.05 | −0.27 | 0.48 | 0.39 | −0.39 | 0.56 | 0.79 | −0.94 | 1.06 | 0.80 | −1.21 | 1.99 |
| Femur | −1.01 | 1.02 | 0.27 | 1.07 | −0.86 | 0.43 | 1.48 | 0.15 | 0.10 | 0.89 | −0.57 | 0.11 | |
| Knee | Femur | −0.95 | 1.03 | −5.77 | −2.43 | −30.84 | 0.27 | 4.23 | 0.27 | 3.19 | 0.59 | −4.21 | −5.25 |
| Tibia | −0.13 | 0.07 | −8.26 | −1.60 | 40.95 | 0.81 | −3.56 | 0.65 | 7.06 | 0.85 | −5.11 | −7.80 | |
| Ankle | Tibia | −0.61 | 0.60 | 1.89 | −4.73 | −0.79 | −0.67 | −0.34 | −2.29 | 0.53 | −0.44 | −0.89 | −0.82 |
| Foot | −2.82 | 1.07 | 4.15 | −6.85 | 0.40 | −1.06 | 0.34 | −0.11 | 0.48 | 0.81 | −1.25 | 0.31 | |
A first-order fit was used for every joint despite the fact that the relative error at the knee was the same as for a zero-order fit. In humans the knee joint center does translate with knee flexion (Blankevoort, Huiskes et al. 1990). The small size of these errors, and the fact that errors were minimal for first-order fits indicate that the first-order fits represent the best approximations.
Muscle attachments
Calculated muscle origin and insertion points (Table 6) were consistent with locations described in the literature (Greene 1935). A solid ellipsoid with axes equal to the three breadth values as defined in the methods provides an estimate of relative muscle attachment sizes. The volumes of these ellipsoids range from 0.03 mm3 for the gastrocnemius insertions to 626 mm3 for the GMa origin. The volumes indicate most attachment sites are small; 95% have volume less than 100 mm3. As expected, muscles showing large ellipsoid volumes are those with known large attachment sites. Insertion and via points with zero breadth in one dimension were photographed only three times; the points were thus coplanar.
Table 6. Coordinates of centroids and breadths (as described in the methods) of muscle attachments (centroid ± breadth).
A. Attachment Coordinates Relative to Hip Coordinate System
B. Attachment Coordinates Relative to Femur Coordinate System
C. Attachment Coordinates Relative to Tibia Coordinate System
D. Attachment Coordinates Relative to Foot Coordinate System
| Name | Type | x (mm) | y (mm) | z (mm) |
|---|---|---|---|---|
| Biceps Femoris Anterior | Origin | −6.70 ± 2.57 | 8.82 ± 0.86 | −6.04 ± 0.85 |
| Biceps Femoris Posterior | Origin | −13.78 ± 1.48 | 2.39 ± 1.90 | −2.18 ± 0.14 |
| Caudofemoralis | Origin | −7.46 ± 3.16 | 9.69 ± 0.79 | −6.20 ± 0.29 |
| Semitendinosus accessory | Origin | −10.10 ± 3.86 | 8.80 ± 2.00 | −5.56 ± 0.54 |
| Semitendinosus primary | Origin | −14.98 ± 0.42 | 1.24 ± 2.46 | −1.03 ± 0.49 |
| Semimembranosus | Origin | −14.27 ± 0.80 | −0.66 ± 4.19 | −3.43 ± 1.54 |
| Quadratus Femoris | Origin | −10.40 ± 0.00 | 0.08 ± 2.92 | −1.85 ± 3.01 |
| Tensor Fascia Latae | Origin | 21.50 ± 3.14 | 0.71 ± 0.17 | 2.74 ± 3.46 |
| Gluteus Maximus | Origin | 15.02 ± 13.29 | 9.90 ± 2.66 | −2.12 ± 4.23 |
| Gluteus Medius | Origin | 17.09 ± 10.19 | 10.34 ± 0.94 | −0.60 ± 6.35 |
| Gluteus Minimus | Origin | 13.47 ± 7.53 | 0.94 ± 1.57 | 0.46 ± 0.60 |
| Piriformis | Origin | 11.53 ± 10.46 | 4.15 ± 0.92 | −0.63 ± 3.75 |
| Gracilis Posticus | Origin | −15.46 ± 0.87 | −5.43 ± 1.70 | −6.32 ± 1.81 |
| Gracilis Anticus | Origin | −6.33 ± 3.44 | −5.90 ± 1.62 | −5.89 ± 0.09 |
| Adductor Longus | Origin | −4.14 ± 4.43 | −4.93 ± 2.41 | −5.30 ± 0.45 |
| Adductor Magnus | Origin | −5.99 ± 3.41 | −5.31 ± 2.40 | −5.56 ± 2.04 |
| Adductor Brevis | Origin | −10.94 ± 3.93 | −5.99 ± 1.32 | −6.83 ± 1.10 |
| Pectineus | Origin | 1.44 ± 3.25 | −3.24 ± 0.30 | −2.88 ± 0.01 |
| Illiopsoas | Origin | 38.86 ± 13.03 | 4.06 ± 0.35 | 2.86 ± 1.93 |
| Obturator Externus | Origin | −8.24 ± 0.64 | −2.53 ± 3.41 | −4.00 ± 1.75 |
| Obturator Internus | Origin | −6.74 ± 4.59 | 3.54 ± 0.30 | −2.79 ± 0.10 |
| Gemellus Superior | Origin | 2.75 ± 4.36 | 1.35 ± 0.77 | −2.26 ± 0.33 |
| Gemellus Inferior | Origin | −6.20 ± 5.86 | 2.51 ± 0.78 | −1.36 ± 0.10 |
| Rectus Femoris | Origin | 5.04 ± 1.70 | 0.11 ± 1.18 | 1.97 ± 0.12 |
| Name | Type | x (mm) | y (mm) | z (mm) |
|
| ||||
| Biceps Femoris Anterior | Insertion | 0.07 ± 0.90 | −30.64 ± 2.64 | 1.47 ± 0.67 |
| Caudofemoralis | Insertion | −2.70 ± 0.32 | −26.50 ± 1.93 | −1.83 ± 1.51 |
| Quadratus Femoris | Insertion | −2.89 ± 0.82 | −3.93 ± 0.73 | 1.20 ± 1.89 |
| Tensor Fascia Latae | Insertion | 5.41 ± 5.00 | −17.69 ± 5.55 | 2.73 ± 4.78 |
| Gluteus Maximus | Insertion | −1.50 ± 0.59 | −9.64 ± 2.37 | 6.42 ± 1.40 |
| Gluteus Medius | Insertion | −2.86 ± 2.25 | −3.18 ± 2.40 | 6.42 ± 1.15 |
| Gluteus Minimus | Insertion | −0.33 ± 1.57 | 0.24 ± 0.73 | 4.77 ± 0.19 |
| Piriformis | Insertion | −1.47 ± 1.72 | 1.42 ± 0.60 | 4.10 ± 0.23 |
| Adductor Longus | Insertion | −1.59 ± 0.04 | −16.90 ± 0.70 | 1.20 ± 0.87 |
| Adductor Magnus | Insertion | −0.75 ± 4.31 | −30.25 ± 1.51 | −2.91 ± 0.76 |
| Adductor Brevis | Insertion | −1.67 ± 1.65 | −16.31 ± 6.92 | 3.59 ± 0.18 |
| Pectineus | Insertion | −2.43 ± 1.04 | −12.35 ± 4.74 | 1.64 ± 1.53 |
| Illiopsoas | Insertion | −2.14 ± 1.32 | −5.05 ± 1.97 | 0.18 ± 0.12 |
| Obturator Externus | Insertion | −2.26 ± 0.06 | −0.16 ± 1.33 | 2.30 ± 0.71 |
| Obturator Internus | Insertion | −1.99 ± 0.74 | 1.12 ± 0.60 | 2.36 ± 0.93 |
| Gemellus Superior | Insertion | −1.16 ± 1.73 | 1.83 ± 0.19 | 2.44 ± 0.64 |
| Gemellus Inferior | Insertion | −3.23 ± 0.63 | 0.13 ± 0.00 | 2.11 ± 1.53 |
| Vastus Lateralis | Origin | −1.14 ± 0.72 | −2.93 ± 3.46 | 5.75 ± 0.40 |
| Vastus Intermedius | Origin | 0.90 ± 0.18 | −11.21 ± 8.61 | 3.20 ± 2.54 |
| Vastus Medialis | Origin | −0.36 ± 0.99 | −6.75 ± 4.06 | 1.21 ± 0.28 |
| Medial Gastrocnemius | Origin | −2.77 ± 0.28 | −28.15 ± 1.49 | −2.16 ± 0.80 |
| Lateral Gastrocnemius | Origin | −2.96 ± 0.51 | −28.79 ± 1.46 | 1.60 ± 1.24 |
| Plantaris | Origin | −2.34 ± 0.42 | −27.84 ± 0.77 | 1.24 ± 2.07 |
| Popliteus | Origin | −2.43 ± 1.14 | −30.88 ± 1.04 | 1.60 ± 3.14 |
| Name | Type | x (mm) | y (mm) | z (mm) |
| Biceps Femoris Posterior | Insertion | 3.21 ± 0.61 | 23.77 ± 10.87 | 3.80 ± 3.66 |
| Semitendinosus | Insertion | 4.84 ± 0.20 | 23.40 ± 2.98 | 0.50 ± 1.49 |
| Semimembranosus | Insertion | 1.97 ± 2.51 | 35.44 ± 1.95 | −0.99 ± 1.13 |
| Gracilis Posticus | Insertion | 4.72 ± 0.99 | 26.96 ± 1.00 | −0.58 ± 0.76 |
| Gracilis Anticus | Insertion | 4.22 ± 1.68 | 28.76 ± 2.75 | −0.39 ± 1.42 |
| Rectus Femoris | Insertion | 2.03 ± 0.10 | 40.99 ± 2.88 | 1.68 ± 2.13 |
| Rectus Femoris | Via | 0.48 ± 0.12 | 42.86 ± 0.30 | 0.20 ± 0.00 |
| Vastus Lateralis | Insertion | 2.03 ± 0.10 | 40.99 ± 2.88 | 1.68 ± 2.13 |
| Vastus Lateralis | Via | −0.72 ± 1.54 | 42.62 ± 0.00 | 4.50 ± 0.00 |
| Vastus Intermedius | Insertion | 2.03 ± 0.10 | 40.99 ± 2.88 | 1.68 ± 2.13 |
| Vastus Intermedius | Via | 0.68 ± 0.17 | 43.26 ± 0.06 | 2.55 ± 0.03 |
| Vastus Medialis | Insertion | 2.03 ± 0.10 | 40.99 ± 2.88 | 1.68 ± 2.13 |
| Vastus Medialis | Via | 0.48 ± 0.12 | 42.86 ± 0.30 | 0.20 ± 0.00 |
| Soleus | Origin | −3.30 ± 1.16 | 33.25 ± 0.07 | 4.02 ± 2.54 |
| Tibialis Anterior | Origin | 3.12 ± 1.87 | 33.26 ± 4.54 | 4.33 ± 3.12 |
| Tibialis Anterior | Via | 2.86 ± 0.48 | 2.57 ± 1.01 | −0.60 ± 0.00 |
| Extensor Digitorum Longus | Origin | 1.11 ± 0.57 | 38.91 ± 1.84 | 4.61 ± 1.16 |
| Extensor Digitorum Longus | Via | 2.17 ± 0.89 | 2.53 ± 0.32 | 0.59 ± 0.05 |
| Tibialis Posterior | Origin | −1.47 ± 2.74 | 34.13 ± 0.91 | 1.67 ± 0.46 |
| Tibialis Posterior | Via | −0.63 ± 0.46 | −0.07 ± 0.20 | −1.20 ± 0.01 |
| Flexor Digitalis Longus | Origin | −2.68 ± 2.08 | 33.71 ± 0.31 | 2.46 ± 0.58 |
| Flexor Digitalis Longus | Via | −0.63 ± 0.46 | −0.07 ± 0.20 | −1.20 ± 0.01 |
| Flexor Hallicus Longus | Origin | −1.47 ± 2.74 | 34.13 ± 0.91 | 1.67 ± 0.46 |
| Flexor Hallicus Longus | Via | −0.63 ± 0.46 | −0.07 ± 0.20 | −1.20 ± 0.01 |
| Peronei | Origin | −2.24 ± 0.40 | 35.59 ± 4.57 | 4.31 ± 0.75 |
| Peronei | Via | −0.83 ± 0.30 | −0.02 ± 0.11 | 2.68 ± 0.09 |
| Popliteus | Insertion | 0.73 ± 4.09 | 29.24 ± 3.02 | −0.33 ± 0.30 |
| Name | Type | x (mm) | y (mm) | z (mm) |
| Medial Gastrocnemius | Insertion | −4.16 ± 0.47 | 0.65 ± 0.29 | 1.06 ± 0.05 |
| Lateral Gastrocnemius | Insertion | −4.16 ± 0.48 | 0.65 ± 0.29 | 1.06 ± 0.05 |
| Plantaris | Insertion | −4.16 ± 0.48 | 0.65 ± 0.29 | 1.06 ± 0.05 |
| Soleus | Insertion | −4.16 ± 0.48 | 0.65 ± 0.29 | 1.06 ± 0.05 |
| Tibialis Anterior | Insertion | 5.31 ± 0.31 | −2.31 ± 0.89 | −0.66 ± 0.13 |
| Extensor Digitorum Longus | Insertion | 3.49 ± 1.66 | −1.74 ± 0.86 | 1.22 ± 0.26 |
| Tibialis Posterior | Insertion | −0.51 ± 1.36 | −1.70 ± 0.16 | −1.16 ± 0.68 |
| Flexor Digitalis Longus | Insertion | −0.51 ± 1.37 | −1.70 ± 0.17 | −1.16 ± 0.67 |
| Flexor Hallicus Longus | Insertion | −0.51 ± 1.36 | −1.70 ± 0.16 | −1.16 ± 0.68 |
| Peronei | Insertion | 1.93 ± 0.34 | −2.13 ± 0.00 | 1.41 ± 0.82 |
Muscle attachment centroid coordinates agreed closely across the three specimens. The inter-specimen standard deviation averaged 2.20 mm across all attachment sites. Of the 85 attachment sites measured, 66 had inter-specimen SD less than 3 mm. Inter-specimen SDs were generally larger for muscles with broader attachments. 61% of attachments had inter-specimen SD less than the breadth of the attachment; inter-specimen SDs larger than the attachment breadth occurred almost exclusively at small tendinous attachment sites. These data indicate that the modeled attachment coordinates are adequate approximations of the actual sites, and that inter-specimen variability was low.
Moment arms
Moment arms showed a large range of magnitudes across joint angles. For instance, the moment arm of BFA about the hip ranges from approximately zero in full hip flexion to −15.3 mm in full extension (Fig. 3A). In fact, at near full hip flexion BFA has the smallest moment arm among extensors, whereas at near full extension the BFA is one of three primary extensors. Within the space of angles normally observed during quadrupedal locomotion (hip −5 to 50°; knee −110 to −60°; ankle −20 to 40°) (Gruner, Altman et al. 1980; Thota, Watson et al. 2005), the changes in moment arm are less pronounced. Many muscles including the adductors have moment arms with a large range (e.g. 4.9 mm for AM) across the physiological domain of joint angle, but their moment arms peak and vary little (e.g. 1.0 mm for AM) within the quadrupedal locomotion domain. Further, the mean moment arm in the domain of angles corresponding to bipedal locomotion (hip −30 to −5°; knee −110 to −60°; ankle −60 to −20°) differed an average of 45% from the mean quadrupedal locomotion moment arm. Five individual muscle moment arms differed by greater than 100%.
Figure 3.
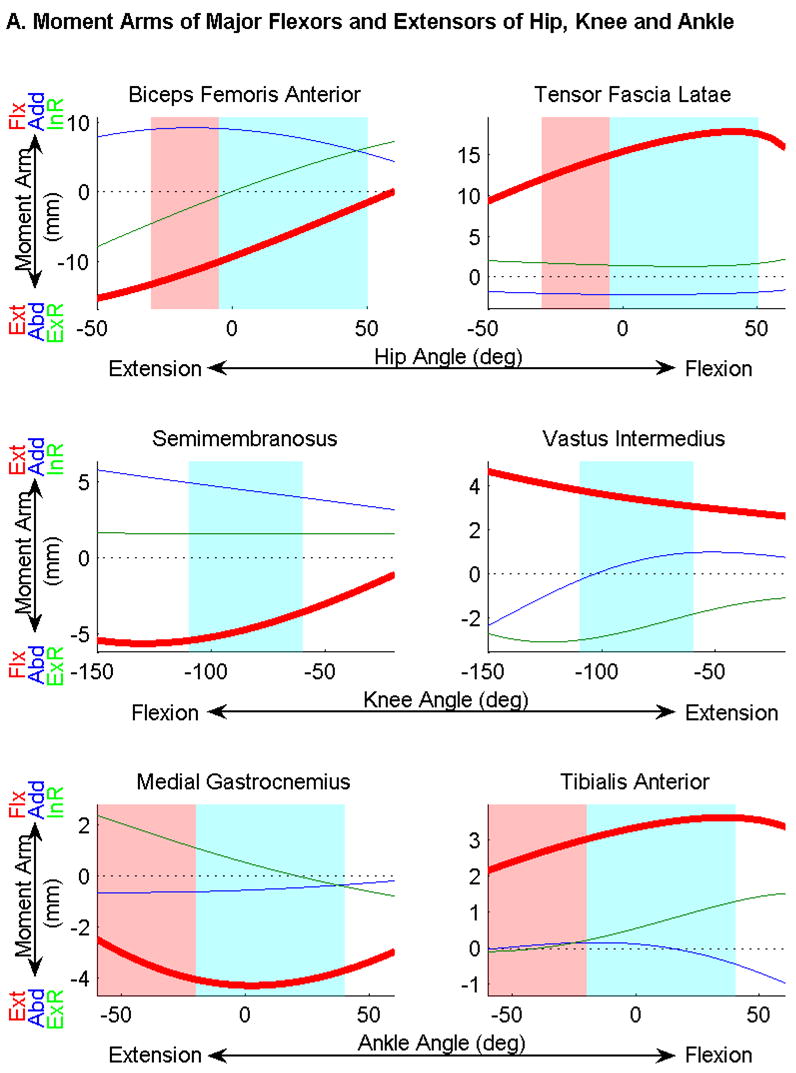

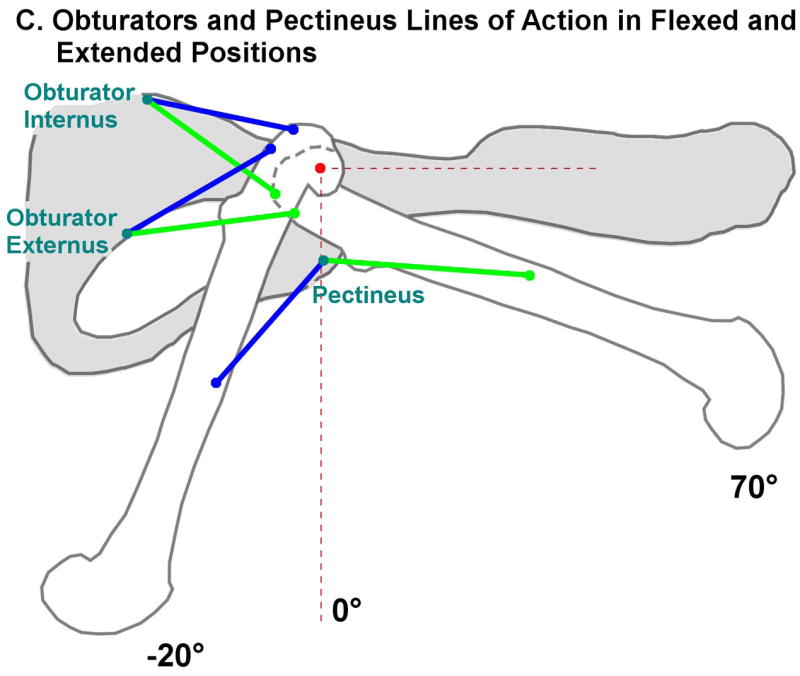
Moment arms as a function of flexion/extension angle of the joints, calculated from muscle origin insertion centroids and joint center functions. Extension/flexion (Ext/Flx) moment arms are shown in bold red, abduction/adduction (Abd/Add) moments in blue, and external/internal rotation (ExR/InR) moments in green. The range of angles encountered during quadrupedal locomotion is highlighted in blue; the bipedal range is highlighted in red. The range of knee angles is the same in bipedal and quadrupedal locomotion. A) Major flexors and extensors of the hip, knee and ankle. Note that knee flexion moment arms and angles are negative, while hip and ankle values are positive. This is a result of the common nomenclature differing from the mathematically consistent definition of angle used in the experiment. B) Moment arms of three muscles of the hip whose flexion/extension moment arms cross zero. C) Lines of action connecting origins and insertions of the obturators and pectineus in flexed (green) and extended (blue) positions. The average hip joint center is marked in red. This figure illustrates the change in function of the obturators and pectineus as the hip is extended.
Moment arms of several muscles crossed zero as joint angle varied. Notably, Pectineus and the obturators switch from flexors to extensors as the hip transitions from 21 to 40° of flexion (Fig. 3B,C): these angles are within the domain of quadrupedal locomotion. Because a zero crossing in the negative direction indicates an intrinsically stabilizing muscle (Young, Scott et al. 1993), these muscles are likely primarily responsible for hip stabilization. However in the domain of hip angles encountered during bipedal locomotion, the moment arms at these angles do not cross zero and thus are no longer intrinsically stabilizing.
From these data we conclude that in the rat, (1) joint centers can be accurately modeled using first-order functions of joint angle; (2) centroids of linear or quadratic fits are appropriate for modeling muscle attachments; and (3) the moment arm variations with joint angle show that muscle function is determined by posture, i.e. leg postures during bipedal locomotion can lead to substantial differences in muscle moment arms compared to postures used during quadrupedal locomotion.
Discussion
Suitability of functional approximations
Perhaps the simplest determination of muscle attachment involves visually approximating the centroid of an attachment in a number of specimens and taking the mean (Burkholder and Nichols 2004). While in many muscles this technique may yield a reasonable estimate of attachment centroid, muscles with broad or highly curved attachments make manual estimation of such a centroid prone to error. To reduce this estimation error, we selected points spanning the attachment area. Because such a span of points does not follow a normal distribution, their mean does not describe the attachment centroid. Instead, we selected a function capable of capturing the curvature of attachment and requiring few points for fitting. We described muscle attachment sites as first- or second-order curves, which we found sufficient to describe all attachment sites.
Knee and ankle movement does not occur about a fixed axis. Furthermore, articulations orthogonal to flexion/extension are important but often ignored in modeling. Models of the human knee have approximated the flexion axis as a constant or a function of angle, and many include the “screw-home” motion whereby rotation is coupled to flexion (Blankevoort, Huiskes et al. 1990; Churchill, Incavo et al. 1998; Piazza and Cavanagh 2000). While these models can be adequate kinematic descriptions, rotation in all three orthogonal directions is possible, constrained by joint dynamic properties (e.g. spring and damping effects). We therefore chose to model each joint as a moving point, the location of which is dependent on joint angle.
Modeling the joint as a moving point allows more realistic modeling of joint dynamics but requires the approximation that at any given joint angle, differential rotations in any direction will be about the same point. We consider this approximation reasonable since it is equivalent to requiring the function of center location to be continuous, and the observed low relative errors indicate that this method can accurately model moving joint centers.
While we have reported data that allow calculation of moment arms for the physiological range of motion of the hindlimb, it is important to note that the model they comprise is currently static. Subsequent investigations of muscle physiology and joint dynamics will be necessary to create a dynamic model that can be directly applied to locomotion.
Low variability in locomotion moment arms
Within the quadrupedal locomotion domain of joint angles, the flexion/extension moment arms of most muscles are far less variable than in the overall physiological domain. In fact, 27 of the 37 muscles modeled have flexion/extension moment arms which peak at an angle within 15° of the locomotion domain and the slope of the moment arm within the locomotion domain is correspondingly small. Additionally, large differences in muscle moment arms between quadrupedal and bipedal locomotion were found. If the rat musculoskeletal system is designed to maximize power during locomotion, similar to the design observed in other small animals (Full and Ahn 1995), the small variation in moment arms, coupled with some muscles’ intrinsic stabilization effect during quadrupedal locomotion may simplify the neural control requirements during this task. This is in contrast to movements such as during weight-supported bipedal locomotion or in response to rapid or large perturbations (Jindrich and Full 2002), which are outside the intrinsically stabilizing range of the hip muscles or require control over larger ranges of movement (and muscle moment arms). These behaviors may impose greater control burdens than required during quadrupedal locomotion. Interpretations of rat bipedal gait recovery after SCI should take this potential for increased control burden into account.
Intrinsically stabilizing muscles
Eight muscles have intrinsically stabilizing moment arms, indicated by a negative-slope zero crossing. In addition to the three noted in the results with hip flexion/extension stabilization, the GI also stabilizes in hip flexion/extension and the four quadriceps muscles have stabilizing moment arms at the knee in adduction/abduction (Fig. 4). Interestingly, no muscles were observed to have intrinsically stabilizing moment arms in adduction/abduction about the hip or ankle. This may be explained by the fact that the femur is typically abducted from the body, requiring only an adduction moment to stabilize the hip, and the ankle is prevented from rolling by the width of the foot.
Figure 4.

Moment arms as functions of adduction/abduction angle of the joints, calculated from muscle origin and insertion centroids and joint center functions. Extension/flexion (Ext/Flx) moment arms are shown in red, abduction/adduction (Abd/Add) moments in bold blue and external/internal rotation (ExR/InR) moments in green.
Comparison with a previous model
Flexion/extension moment arms are consistent in sign and trend with those reported for the cat by Burkholder and Nichols (2004). Adduction/abduction moment arms in the ankle also are largely consistent in sign, with the following exceptions: the cat TA and EDL are reported to have stabilizing moment arms, whereas in the rat the TA is an adductor and the EDL is an abductor, although both have very small moment arms for these actions (Fig. 4). These differences can be explained by the differences in locomotor posture. Whereas cats use a digitigrade posture, rats use a plantigrade posture. As noted above, the plantigrade posture coupled with the width of the foot may make active stabilization of the ankle in abduction/adduction less necessary.
Summary
This study investigated the morphological properties of the rat hindlimb necessary for static determination of muscle moment arms throughout the physiological range of motion. It was found that muscle function is largely determined by the change in moment arm with changes in joint angle, which may produce an intrinsically stabilizing arrangement or reduce the neural control burden. Furthermore, muscle function changes with posture, particularly in the transition from quadrupedal to bipedal posture, which eliminates the stabilizing behavior of some muscles while severely altering the moment arms of others.
Acknowledgments
This project was supported by NIH grant P01 NS016333 and NRSA fellowship F31 EB006305.
Footnotes
All authors were fully involved in this study and preparation of the manuscript. The material within has not been and will not be submitted for publication elsewhere.
Publisher's Disclaimer: This is a PDF file of an unedited manuscript that has been accepted for publication. As a service to our customers we are providing this early version of the manuscript. The manuscript will undergo copyediting, typesetting, and review of the resulting proof before it is published in its final citable form. Please note that during the production process errors may be discovered which could affect the content, and all legal disclaimers that apply to the journal pertain.
References
- Abbas JJ, Riener R. Using Mathematical Models and Advanced Control Systems Techniques to Enhance Neuroprosthesis Function. Neuromodulation. 2001;4(4):187–195. doi: 10.1046/j.1525-1403.2001.00187.x. [DOI] [PubMed] [Google Scholar]
- Blankevoort L, Huiskes R, de Lange A. Helical axes of passive knee joint motions. Journal of Biomechanics. 1990;23(12):1219–1229. doi: 10.1016/0021-9290(90)90379-h. [DOI] [PubMed] [Google Scholar]
- Burkholder TJ, Nichols TR. Three-dimensional model of the feline hindlimb. Journal of Morphology. 2004;261(1):118–129. doi: 10.1002/jmor.10233. [DOI] [PMC free article] [PubMed] [Google Scholar]
- Churchill DL, Incavo SJ, Johnson CC, Beynnon BD. The Transepicondylar Axis Approximates the Optimal Flexion Axis of the Knee. Clinical Orthopaedics & Related Research. 1998;356:111–118. doi: 10.1097/00003086-199811000-00016. [DOI] [PubMed] [Google Scholar]
- Full R, Ahn A. Static forces and moments generated in the insect leg: comparison of a three-dimensional musculo-skeletal computer model with experimental measurements. Journal of Experimental Biology. 1995;198(6):1285–1298. doi: 10.1242/jeb.198.6.1285. [DOI] [PubMed] [Google Scholar]
- Goryn D, Hein S. On the estimation of rigid body rotation from noisy data. IEEE Transactions on Pattern Analysis and Machine Intelligence. 1995;17(12):1219–1220. [Google Scholar]
- Greene EC. Anatomy of the Rat. Transactions of the American Philosophical Society. 1935;27:ii-370. [Google Scholar]
- Gruner JA, Altman J, Spivack N. Effects of arrested cerebellar development on locomotion in the rat. Experimental Brain Research. 1980;40(4):361–373. doi: 10.1007/BF00236145. [DOI] [PubMed] [Google Scholar]
- Hauben E, Butovsky O, Nevo U, Yoles E, Moalem G, Agranov E, Mor F, Leibowitz-Amit R, Pevsner E, Akselrod S, Neeman M, Cohen IR, Schwartz M. Passive or Active Immunization with Myelin Basic Protein Promotes Recovery from Spinal Cord Contusion. Journal of Neuroscience. 2000;20(17):6421–6430. doi: 10.1523/JNEUROSCI.20-17-06421.2000. [DOI] [PMC free article] [PubMed] [Google Scholar]
- Huijing PA, Baan GC, Rebel GT. Non-myotendinous force transmission in rat extensor digitorum longus muscle. Journal of Experimental Biology. 1998;201(5):683–691. [PubMed] [Google Scholar]
- Jindrich DL, Full RJ. Dynamic stabilization of rapid hexapedal locomotion. Journal of Experimental Biology. 2002;205(18):2803–2823. doi: 10.1242/jeb.205.18.2803. [DOI] [PubMed] [Google Scholar]
- Kubasak MD, Jindrich DL, Zhong H, Takeoka A, McFarland KC, Munoz-Quilez C, Roy RR, Edgerton VR, Ramon-Cueto A, Phelps PE. Long-term step training enhances improvements in hindlimb plantar stepping and step kinematics promoted by OEG transplantation in adult paraplegic rats. Brain. doi: 10.1093/brain/awm267. in press. [DOI] [PMC free article] [PubMed] [Google Scholar]
- McDonald JW, Liu X-Z, Qu Y, Liu S, Mickey SK, Turetsky D, Gottlieb DI, Choi DW. Transplanted embryonic stem cells survive, differentiate and promote recovery in injured rat spinal cord. Nature Medicine. 1999;5(12):1410–1412. doi: 10.1038/70986. [DOI] [PubMed] [Google Scholar]
- Piazza SJ, Cavanagh PR. Measurement of the screw-home motion of the knee is sensitive to errors in axis alignment. Journal of Biomechanics. 2000;33(8):1029–1034. doi: 10.1016/s0021-9290(00)00056-7. [DOI] [PubMed] [Google Scholar]
- Ramon-Cueto A, Cordero MI, Santos-Benito FF, Avila J. Functional Recovery of Paraplegic Rats and Motor Axon Regeneration in Their Spinal Cords by Olfactory Ensheathing Glia. Neuron. 2000;25(2):425–435. doi: 10.1016/s0896-6273(00)80905-8. [DOI] [PubMed] [Google Scholar]
- Roy RR, Baldwin KM, Martin TP, Chimarusti SP, Edgerton VR. Biochemical and physiological changes in overloaded rat fast- and slow-twitch ankle extensors. Journal of Applied Physiology. 1985;59(2):639–646. doi: 10.1152/jappl.1985.59.2.639. [DOI] [PubMed] [Google Scholar]
- Roy RR, Meadows ID, Baldwin KM, Edgerton VR. Functional significance of compensatory overloaded rat fast muscle. Journal of Applied Physiology. 1982;52(2):473–478. doi: 10.1152/jappl.1982.52.2.473. [DOI] [PubMed] [Google Scholar]
- Roy RR, Powell PL, Kanim P, Simpson DR. Architectural and histochemical analysis of the semitendinousus muscle in mice, rats, guinea pigs, and rabbits. Journal of Morphology. 1984;181(2):155–160. doi: 10.1002/jmor.1051810204. [DOI] [PubMed] [Google Scholar]
- Schutte LM, Rodgers MM, Zajac FE, Glaser RM. Improving the efficacy of electrical stimulation-induced leg cycle ergometry: an analysis based on a dynamic musculoskeletal model. IEEE Transactions on Rehabilitation Engineering. 1993;1(2):109–125. [Google Scholar]
- Teng YD, Lavik EB, Qu X, Park KI, Ourednik J, Zurakowski D, Langer R, Snyder EY. Functional recovery following traumatic spinal cord injury mediated by a unique polymer scaffold seeded with neural stem cells. Proceedings of the National Academy of Sciences. 2002;99(5):3024–3029. doi: 10.1073/pnas.052678899. [DOI] [PMC free article] [PubMed] [Google Scholar]
- Thota AK, Watson SC, Knapp E, Thompson B, Jung R. Neuromechanical Control of Locomotion in the Rat. Journal of Neurotrauma. 2005;22(4):442–465. doi: 10.1089/neu.2005.22.442. [DOI] [PubMed] [Google Scholar]
- Timoszyk WK, de Leon RD, London N, Roy RR, Edgerton VR, Reinkensmeyer DJ. The Rat Lumbosacral Spinal Cord Adapts to Robotic Loading Applied During Stance. Journal of Neurophysiology. 2002;88(6):3108–3117. doi: 10.1152/jn.01050.2001. [DOI] [PubMed] [Google Scholar]
- Woltring HJ, Huiskes R, de Lange A, Veldpaus FE. Finite centroid and helical axis estimation from noisy landmark measurements in the study of human joint kinematics. Journal of Biomechanics. 1985;18(5):379–389. doi: 10.1016/0021-9290(85)90293-3. [DOI] [PubMed] [Google Scholar]
- Yamaguchi GT, Zajac FE. Restoring unassisted natural gait to paraplegics via functional neuromuscular stimulation: a computer simulation study. IEEE Transactions on Biomedical Engineering. 1990;37(9):886–902. doi: 10.1109/10.58599. [DOI] [PubMed] [Google Scholar]
- Young RP, Scott SH, Loeb GE. The distal hindlimb musculature of the cat: multiaxis moment arms at the ankle joint. Experimental Brain Research. 1993;96(1):141–151. doi: 10.1007/BF00230447. [DOI] [PubMed] [Google Scholar]
- Zhao W, Kirsch RF, Triolo RJ, Delp S. A bipedal, closed-chain dynamic model of the human lower extremities and pelvis for simulation-based development of standing and mobility neuroprostheses. Proceedings of the 20th Annual International Conference of the IEEE Engineering in Medicine and Biology Society; Hong Kong, China. 1998. [Google Scholar]