

Abstract
The virulence factor CBP is the most abundant protein secreted by Histoplasma capsulatum, a pathogenic fungus that causes histoplasmosis. Although the biochemical function and pathogenic mechanism of CBP are unknown, quantitative Ca2+ binding measurements indicate that CBP has a strong affinity for calcium (KD = 6.45 ± 0.4 nM). However, no change in structure was observed upon binding of calcium, prompting a more thorough investigation of the molecular properties of CBP with respect to self-association, secondary structure, and stability. Over a wide range of pH values and salt concentrations, CBP exists predominantly as a stable, noncovalent homodimer in both its calcium-free and- bound states. Solution-state NMR and circular dichroism (CD) measurements indicated that the protein is largely α-helical, and its secondary structure content changes little over the range of pH values encountered physiologically. ESI-MS revealed that the six cysteine residues of CBP are involved in three intramolecular disulfide bonds that help maintain a highly protease resistant structure. Thermally and chemically induced denaturation studies indicated that unfolding of disulfide-intact CBP is reversible and provided quantitative measurements of protein stability. This disulfide-linked, protease resistant, homodimeric α-helical structure of CBP is likely to be advantageous for a virulence factor that must survive the harsh environment within the phagolysosomes of host macrophages.
The dimorphic fungal pathogen Histoplasma capsulatum is a major causative agent of respiratory and systemic disease, especially in immunocompromised individuals. Once inside the host, the yeast form of Histoplasma proliferates in what should be a potent antimicrobial environment, the macrophage phagolysosome (1). We previously showed that Histoplasma interferes with normal acidification of this intracellular compartment (2), but intracellular yeasts must also cope with lysosomal enzymes, reactive oxygen and nitrogen intermediates, iron limitation, and nutrient deprivation. H. capsulatum is one of only a few organisms known to survive this harsh environment; consequently, the unique mechanisms employed by H. capsulatum to replicate within the phagolysosomes of mammalian cells are of particular interest. Currently, only two virulence factors have been genetically proven, and the molecular mechanisms of H. capsulatum pathogenesis are not well understood (3, 4).
The first characterized virulence determinant, CBP (calcium binding protein),1 was identified as a yeast phase-specific secreted protein that specifically binds calcium (5, 6). H. capsulatum strains with a disrupted CBP1 gene grow normally in vitro but are severely attenuated in a mouse model of pulmonary infection (3). CBP is the major protein secreted by H. capsulatum and appears to be the only released protein able to bind appreciable amounts of calcium (5). Remarkably, CBP contains no conserved calcium-binding motifs in addition to sharing no significant sequence homology with any other protein in NCBI’s GenBank. Nevertheless, many Ca2+-binding proteins share little in common besides their ability to specifically bind calcium ions with appreciable affinity (7). Typically, the particular biological role of these proteins relates directly to the Ca2+ affinity as well as the natural environment’s limitations on this affinity. Calcium sensor proteins, such as calmodulin and troponin C, are inactive at low Ca2+ concentrations (10−7–10−8 M) and undergo substantial conformational changes when calcium is bound at high concentrations (10−5–10−6 M) (8). Proteins, such as parvalbumin and calbindin D9k, are involved in Ca2+ buffer and transport functions, have a greater affinity for calcium, and are thought to be involved in deactivation of signal transducers and/or quenching of Ca2+ signals (9). Conformational changes have only an occasional or small effect in this group of calcium-binding proteins. In light of these differences between the two classes of calcium-binding proteins, accurate determination of Ca2+ binding affinity and assessment of conformational changes induced by calcium could reveal the function of CBP in pathogenesis.
The goal of this study was to gain insight into the mechanism of intracellular survival that CBP affords H. capsulatum. Biophysical studies were performed regarding its association state and structural stability, including analytical ultracentrifugation, electrospray ionization mass spectrometry (ESI-MS), and CD and NMR spectroscopy. These studies reveal remarkable properties of protease resistance, structural stability, and conformational rigidity that are likely to be advantageous for a virulence factor secreted into the harsh environment of the phagolysosome.
MATERIALS AND METHODS
Materials
All chemical reagents were ACS grade or higher and were purchased from Sigma (St. Louis, MO) unless indicated otherwise. All isotope reagents were purchased from Isotech, Inc. (Miamisburg, OH). All enzymes were proteomics grade. Endoproteinases Asp-N, Glu-C, and Lys-C were purchased from Roche Applied Science (Penzberg, Germany). Immobilized pepsin was purchased from Pierce (Rockford, IL).
Sample Preparation
Unlabeled, 15N-labeled, and 13C-and 15N-labeled CBP proteins were expressed and purified using a modification of a procedure described previously (5). Briefly, H. capsulatum G186ARura5 yeast strains harboring an additional plasmid-born copy of CBP1 driven by its native promoter (plasmid pTS404) were grown at 37 °C to early stationary phase in 3 M minimal medium (10) adapted by substitution of [15N]ammonium sulfate, [13C]glucose (0.1%), and reduced levels of proline (1.5 g/L) and cystine (0.84 g/L). H. capsulatum is an organic sulfur auxotroph; therefore, 13C-and 15N-labeled cysteine (0.33 g/L of 3 M medium) replaced the cystine to resolve the disulfide bond linkages by NMR. After growth, the CBP-containing culture supernatant was concentrated, diafiltered, and lyophilized. CBP was separated by reversed-phase HPLC using a C8 column (RP-300; Applied Biosystems, Foster City, CA) followed by an Aquapore phenyl column (PH-300; Applied Biosystems) with linear gradients from 100% buffer A [0.1% trifluoroacetic acid (TFA)] to 100% buffer B (0.1% TFA with 70% acetonitrile) over the course of 60 min. Samples used for NMR spectroscopy contained ~1 mM CBP in 0.01 M deuterated HEPES (pH 6.5), 0.1 M KCl, 0.02% (w/v) NaN3, and either 5 or 99% D2O. The concentration of purified CBP was determined from the absorbance at 280 nm by using a molar extinction coefficient of 11357 M−1 cm−1 as calculated from quantitative MS analysis. The typical yield of purified CBP from 1 L of culture was 10 mg. Calcium-free (apo) protein was prepared by resuspending lyophilized CBP in Ca2+-free buffer, prepared in Chelex-100 resin (Bio-Rad, Hercules, CA)-treated water. This protein sample was then passed over a 1 mL column of Calcium Sponge S (Molecular Probes, Eugene, OR).
Ca2+ Binding Studies
To estimate the binding constant of CBP, Ca2+ titrations of the protein were performed in the presence of the fluorescent chelator fura-2 (Invitrogen, Carlsbad, CA), which exhibits strong fluorescence enhancement with a ratiometric spectral shift upon binding Ca2+ (11-13). The concentrations of calcium-free fura-2 (ε363 = 2.8 × 10⁴ M−1 cm−1) and CBP (ε280 = 1.1357 × 10⁴ M−1 cm−1) were determined by measuring the absorbance. A calcium calibration kit was used to produce an accurate series of solutions with the amount of total Ca2+ increasing by 1 mM CaEGTA with each dilution (Invitrogen, Carlsbad, CA). The calcium titrations were performed using a quartz cuvette containing 2 mL of 1 μM fura-2 and 1 μM CBP in 20 mM MOPS buffer (pH 6.5) and 100 mM KCl. Calcium aliquots were added; the solution was mixed thoroughly, and the fluorescence excitation scan from 250 to 450 nm was measured at an emission wavelength of 510 nm after equilibration for 30 s using a Perkin-Elmer LS50B luminescence spectrometer (Perkin-Elmer, Waltham, MA). Two to three sets of data were obtained for both chelator–protein and chelator-only titrations. The titration curve for flourescence emission maximum peak intensity (at 340 nm excitation) versus free calcium concentration was analyzed with CaLigator (14) for a model with a chelator of known Ca2+ affinity and up to four macroscopic Ca2+ binding constants for the protein. The same software was used to determine the Ca2+ binding constant for fura-2 using a single-binding site model for titrations of fura-2 alone. The dissociation constant for the chelator fura-2 under these experimental conditions is 96.65 ± 1.0 nM.
Analytical Ultracentrifugation
Sedimentation equilibrium experiments were performed on an Optima XL-A analytical ultracentrifuge using An50Ti and An60Ti rotors (Beckman Instruments, Inc., Fullerton, CA). Samples were sedimented at four different rotor speeds (25000, 35000, 37000, and 45000 rpm). Absorbance data were collected by scanning the sample cells at a wavelength of 280 nm at intervals of 0.001 cm in the step mode, with six averages per step. The samples were judged to be at equilibrium when at least three successive scans, each taken 2 h apart, were superimposable. Sedimentation equilibrium was achieved within 48 h for all samples.
Sedimentation equilibrium profiles were edited using REEDIT (J. Lary, National Analytical Ultracentrifuge Center, Storrs, CT) to extract the data between the sample meniscus and the bottom of the sample cell. These edited data files were then examined by nonlinear, least-squares (NLLS) analysis using WINNONLIN (D. Yphantis, University of Connecticut, Storrs, CT; M. Johnson, University of Virginia, Charlottesville, VA; J. Lary, National Analytical Ultracentrifuge Center). WINNONLIN fit the concentration profiles as a function of radial position to a sum of exponential terms, each of which reflected the population of an oligomeric species (n-mer) formed from n monomeric units:
| (1) |
where AT is the total absorbance at radial position r within the centrifuge cell, ε = (r2 − rref 2)/2, and b is the baseline offset. The reduced molecular mass of the monomeric species is given by
| (2) |
where M is the molecular mass of the monomer, υ is the partial specific volume of the monomer, ρ is the solvent density [calculated for each buffer condition using SEDN-TERP (D. Hayes, Magdalen College, Warner, NH; T. Laue, University of New Hampshire, Durham, NH; J. Philo, Amgen)],ω is the angular speed of the rotor (in radians per second), R is the gas constant, and T is the absolute temperature. If υ does not change upon oligomerization, then the reduced molecular mass for the n-mer is given by nσ. In eq 1, Ln0,abs is the overall association constant for n-mer species defined in absorbance units (where L10,abs = 1):
| (3) |
where An is the absorbance of the n-mer species and Af is the absorbance of the monomeric species. Substituting Beer’s law into eq 2 and rearranging yields eq 4:
| (4) |
where Ln0 is the overall equilibrium association constant defined in molar units, ε is the extinction coefficient of monomeric CBP, and l is the path length of the sedimentation cell (l = 1.2 cm).
The value of υ for the CBP (three disulfide bonds; same value for both monomer and dimer) was calculated from the protein sequence by using the method of Cohn and Edsall (15) and the program SEDNTERP, returning a value of 0.7212 mL/g at 20 °C.
Circular Dichroism
CD experiments were conducted on a JASCO 810 spectropolarimeter equipped with a built-in magnetic stirrer for temperature equilibration within the cell, and all measurements were carried out with three protein samples. Experimental parameters were as follows: sensitivity, 100 mdeg; increment, 0.1 nm; scan speed, 50 nm/min; bandwidth, 5 nm. Three replicate scans between 200 and 250 nm were averaged for each data point. Thermal unfolding was monitored by continuous heating in a 1 cm path length cuvette at 0.5 °C/min from 20 to 90 °C, and the ellipticity at 222 nm was collected continuously. Reversibility was determined from the recovery of the ellipticity after cooling. Thermal unfolding curves were analyzed by a least-squares fit of the data to a modified van’t Hoff equation describing a two-state unfolding reaction to determine the enthalpy of unfolding (ΔHm) and the midpoint of the thermal transition(Tm):
| (5) |
where the parameters yf, mf, yu and mu refer to the y-intercepts and slopes of the pre-and postunfolding baseline, respectively. ΔHm° is the enthalpy of unfolding, and Tm is the temperature at the midpoint of unfolding. R is the gas constant (1.987 cal mol−1 deg−1), and T is the absolute temperature (in kelvin). The fits were performed using a nonlinear least-squares regression analysis in Scientist (MicroMath Scientific Software, Salt Lake City, UT).
For measuring unfolding by urea, CD spectra (λ = 250–200 nm) were recorded after overnight incubation of the protein at the desired urea concentration using a cylindrical jacketed cuvette with an optical length of 1 mm at 25 °C. Data were fit to a two-state unfolding reaction; the signal change at 222 nm was analyzed according to the linear extrapolation method (LEM) to estimate the values of the free energy change upon protein unfolding at zero denaturant concentration (ΔG°) and the linear dependence of ΔG°on denaturant concentration (mG) (16, 17). The denaturant concentration at which the fraction of unfolded protein is 0.5, Cm or the midpoint of unfolding, was calculated from the relationship Cm = −ΔG°/mG.
Enzymatic Digestion and Peptide Purification
All digests were carried out at 37 °C for 2–18 h at an enzyme:substrate ratio of 1:20 (w/w) (unless otherwise indicated). For trypsin digests, lyophilized enzyme was resuspended in 1 mM HCl (1 mg/mL) and cleavage of CBP was carried out in 100 mM ammonium bicarbonate (pH 8.5). Glu-C digests were carried out in 100 mM ammonium acetate (pH 4.0) for cleavage at glutamyl bonds only, or in 100 mM phosphate (pH 7.8) for cleavage at both glutamyl and aspartyl bonds. Glu-C digests were also carried out in 1 M urea. Both Asp-N and Lys-C cleavage reactions were carried out at 25 °C in 100 mM NH4HCO3 (pH 8.5) after Asp-N was resuspended in 50 μL of 10 mM Tris (pH 8.0) and Lys-C was resuspended in 50 mM Tricine and 10 mM EDTA. Immobilized pepsin slurry (0.25 mL) was washed and resuspended in 1 mM HCl before 30 s incubations at room temperature with CBP. The reaction was stopped by pelleting pepsin beads in a centrifuge and removal of protein fragments in the supernatant. Thermolysin digests were carried out in 50 mM Tris (pH 7.2) and 150 mM NaCl at 1:50 (protease:protein mass ratio) at 70 °C. Chemical cleavage at aspartic acid residues was accomplished by incubating the protein in 2% formic acid for 2 h at 108 °C. The resulting peptide solutions were then lyophilized to dryness and resuspended in water for HPLC purification and/or fragment identification by ESI-MS.
Peptides were separated by RP-HPLC on a column (RP-300; Applied Biosystems) equilibrated with solvent A [0.1% (v/v) trifluoroacetic acid in water]. Elution was performed at a flow rate of 1 mL/min with a 0 to 60% linear gradient of solvent B [70% (v/v) acetonitrile and 0.1% (v/v) TFA] over the course of 60 min.
For peptic digests, immobilized pepsin slurry was washed with 0.1% TFA. For each time point, 30 μL of pepsin slurry was incubated with 30 μg/mL CBP in 0.1% TFA for 1–10 min at room temperature. Reactions were stopped by removing the protein solution after brief centrifugation of the slurry. Samples were diluted 1:25 in a 3% CH3CN/0.1% formic acid (FA) mixture prior to MS analysis. Then 1–2 μL of diluted sample was mixed with an equivalent volume of matrix and allowed to air-dry for 10 min before MS analysis.
Mass Spectrometry
ESI-MS was used to determine fragment sizes of all enzymatic digests in positive ion mode on a Waters (Milford, MA) Q-ToF Global Ultima instrument. Data were acquired and analyzed with MassLynx 4.0, and the peptide editor was used to match fragment masses after detection by ESI-MS and deconvolution of m/z to an average mass by MaxEnt1, software provided by the manufacturer.
For peptic digests in H2 18O, the sample was loaded onto a silica capillary column with a PicoFritTM tip (New Objective, Inc., Woburn, MA) packed in-house with C18 reverse-phase material (Delta-Pak, 0.075 mm × 100 mm, 5 mm, 300 Å, Waters Corp., Milford, MA). The gradient was pumped using an Eksigent (Livermore, CA) NanoLC-1D instrument and was from 0 to 60% solvent B (97% CH3CN, 3% H2O, and 0.1% FA) over 60 min, and then to 80% solvent B for 10 min at an eluent flow rate of 260 nL/min followed by a 10 min re-equilibration step. The flow was directed into the entrance of the heated capillary of an LTQ-FT mass spectrometer (Thermo-Fisher, San Jose, CA). A mass spectrum of eluting peptides was obtained at high mass resolving power with the FT mass spectrometer component, while MS/ MS experiments on the nine most abundant eluents were rapidly performed in the LTQ instrument at a collision energy of 33% of maximum, selecting the precursor mass over a range of 0.5 Da below to 2.0 Da above and using wideband activation. Triply repeated ions were placed in a dynamic exclusion list for 60 s.
CBP was digested in silico with MS-Bridge from Protein Prospector (18, 19). Observed monoisotopic m/z data were used to identify the peptide by comparison with theoretical peptide masses. Isotope peak intensities of peptides produced by proteolysis in 47% H2 18O (experimentally determined 18O: 16O ratio) were measured directly from the raw data. Isotope ratios were determined from isotopic distribution modeling in Qualbrowser 1.4 as carried out in ref 20.
NMR
All NMR data were collected at 25 °C on 600 and 700 MHz Varian (Palo Alto, CA) Unity INOVA spectrometers, each equipped with four radiofrequency channels and a triple-resonance pulsed-field-gradient probe. Pulse sequences were either provided by Varian BioPack or kindly provided by L. Kay (University of Toronto, Toronto, ON). Data were processed with FELIX 2001 (Accelrys, Inc.) on a Silicon Graphics Indy/R5000 workstation. Chemical shifts were referenced using sodium 4,4-dimethyl-4-silapentane-1-sulfonate (DSS) in NMR sample buffer (21). The sequence-specific backbone resonance assignments were made using a combination of three-dimensional (3D) HNCACB (22, 23), CBCA(CO)NNH (24), HNCO (24), CBCA(CO)CAHA (25), and two-dimensional (2D) 15N HSQC experiments. The aliphatic side chain resonances were assigned using a series of 3D TOCSY experiments, which included HCC(TOCSY)-NNH (26), CC(TOCSY)NNH (26), and an aliphatic HC(C)H-TOCSY (27). The side chain aromatic ring 13C and 1H resonance assignments were made using aromatic 3D HC(C)H-TOCSY (27) and 2D hbCBcgcdHD or hbCBcgcdHDHE experiments (28). A 3D 13C-edited NOESY-HSQC spectrum was collected with a mixing time of 180 ms to assign the disulfide bond linkages from distance restraints.
RESULTS
Calcium Binding Affinity
Previous characterization of Histoplasma’s calcium binding protein (CBP) indicated that this protein specifically binds calcium (5). However, these initial qualitative binding studies were conducted with membrane-immobilized CBP, and no measurements of Ca2+ affinity, cooperativity, or number of binding sites were obtained (5). In the study presented here, the Ca2+ binding affinity of CBP and any potential effects on protein conformation were investigated.
Samples of apo-CBP were shown by ESI-MS to be free of calcium before binding assays were undertaken (Figure 1A). A mass of 7855 Da for apo-CBP was observed, and multiple Ca2+ bond forms appear (at MWapo + nMWCa2+) in the presence of a 100-fold excess of calcium (Figure 1B). No significant changes in intrinsic fluorescence, CD profile, or NMR chemical shifts were measured for CBP upon addition of calcium under the buffer conditions used for 45Ca blot binding experiments undertaken previously [10 mM MES (pH 6.5), 60 mM KCl, and 5 mM MgCl2] (data not shown) (5). To detect Ca2+ binding, we employed Ca2+ titrations in the presence of the chromophoric chelator fura-2 inacompetitionassaywithCBPasdescribedpreviously(11-13). The data were analyzed by a model that allows for up to four macroscopic binding constants in the protein using CaLigator (14). The titrations with fura-2 suggest that there are two calcium-binding sites as the data are best fit to a model with two binding sites [K1 = (3.10 ± 0.4) × 108 M−1, and K2 = (6.07 ± 0.2) × 108 M−1] (Figure S1 of the Supporting Information).
Figure 1.
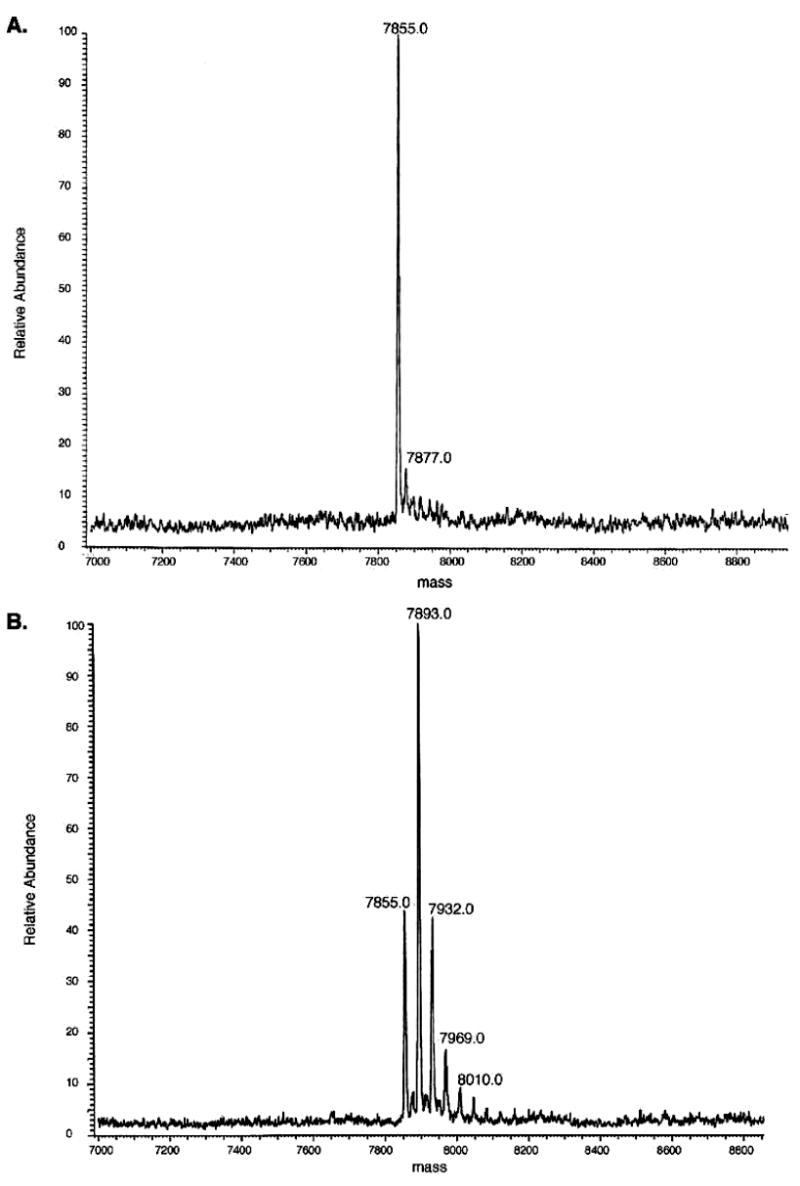
ESI-MS spectra of (A) calcium-free and (B) calcium-loaded CBP show that calcium can be completely removed from the protein preparation and that several different calcium-bound forms exist in the gaseous phase of electrospray ionization. Calcium-free CBP was obtained after the sample was passed over a Calcium-Sponge, whereas 10 mM CaCl2 was added to generate the calcium-loaded CBP sample in identical buffer [10 mM ammonium acetate (pH 7.0)].
Previous work has established that Ca2+ titrations in the presence of a chromophoric chelator are sufficiently accurate to discriminate between cooperative binding and independent binding (13, 29). The titration data collected in these studies provide no obvious evidence of either positive cooperativity or sequential binding, indicating that calcium binding by CBP occurs via two independent sites. If we assume that the two sites are symmetrical (one per monomer), then the individual association constants are equivalent and can be derived using the Scatchard hypothesis. The microsopic binding constants for CBP are therefore 1.55 × 10⁸ M−1, yielding a microscopic dissociation constant (KD) of 6.45 ± 0.4 nM.
Sedimentation Equilibrium Analysis
Preliminary gel filtration chromatography of native CBP showed a single peak in 0.10 M KCl (pH 7.0), indicating an apparent molecular mass between 17 and 44 kDa and suggesting that the protein existed as a multimer in solution (unpublished results). In the work presented here, the native molecular mass and quaternary structure of CBP were studied by sedimentation equilibrium analysis.
(A) Oligomerization State
Sedimentation equilibrium data were collected at four different rotor speeds and at three different protein concentrations (10, 20, and 40 μM total monomer). Single, ideal species analysis of individual traces was performed using nonlinear, least-squares analysis (NLLS) to determine the apparent molecular mass and effective oligomerization state of CBP at various protein concentrations. Figure 2A shows a typical concentration trace and fit to the observed trace when using a single-species model. At each loading concentration, the average molecular mass was greater than that predicted for a CBP monomer (7855 Da) and increased with an increasing loading concentration of protein, consistent with CBP self-association. The data presented in Table 1 reveal that as the rotor speed was increased, the apparent molecular mass decreased slightly at all three sample concentrations, consistent with mass action association and characteristic of a self-associating protein. These data were then fit to several models of self-association to determine unambiguously the oligomerization state of CBP. As one can see in Table 2, only a fit of the data to the dimer model dramatically reduces the residuals for a single-species model. However, the model that best describes the experimental data is a monomer–dimer equilibrium. The observation of a random distribution of residuals between the observed data and the fit based on the monomer–dimer equilibrium suggests that no additional oligomerization state exists or that the dissociation constant of any higher-order oligomer is much greater than 40 μM, the experimental concentration.
Figure 2.
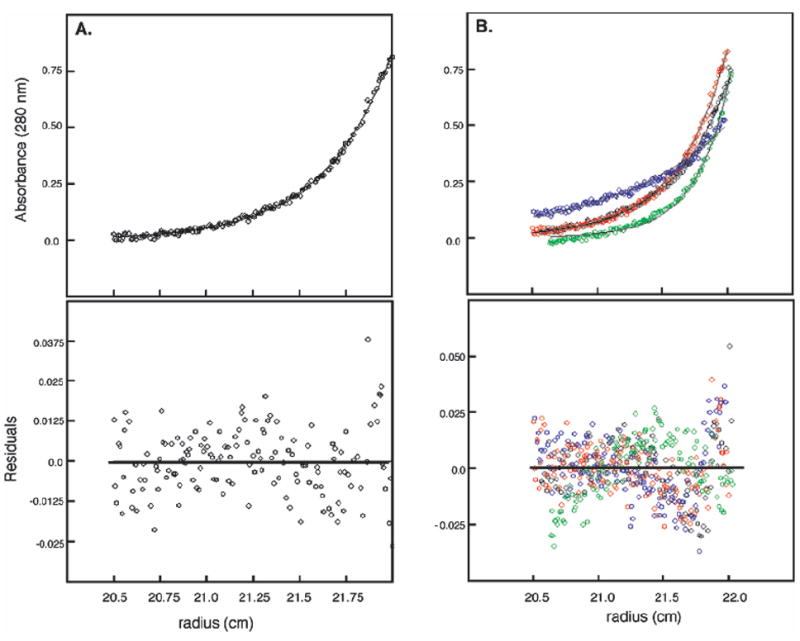
Selected sedimentation equilibrium data and fits for CBP. Panel A shows data fit to a single-species model, and data in panel B make up a multispeed fit to a monomer–dimer equilibrium model. Experimental conditions were as follows: sample concentration of 10 (A) or 40 μM (B), rotation speeds of 25000 rpm (A) and (● in panel B) 35000 (red), 37000 (green), and 45000 rpm (blue), and a temperature of 20 °C. The data were fit using eq 1 and the monomeric molecular mass of 7855 Da from eq 2. Residuals are shown below the respective data or fit.
Table 1.
Concentration and Speed Dependence of the Apparent Molecular Mass of CBP
| speed (rpm) | [protein]a (μM) | molecular massb (kDa) | n-merc (%) |
|---|---|---|---|
| 25000 | 40 | 19 ± 2 | 2.45 |
| 35000 | 40 | 14.4 ± 0.9 | 1.84 |
| 37000 | 40 | 14.4 ± 0.7 | 1.84 |
| 45000 | 40 | 13.6 ± 0.6 | 1.74 |
| 25000 | 20 | 21 ± 4 | 2.73 |
| 35000 | 20 | 17 ± 2 | 2.13 |
| 37000 | 20 | 16 ± 1 | 2.05 |
| 45000 | 20 | 13 ± 1 | 1.70 |
| 25000 | 10 | 16 ± 3 | 2.04 |
| 35000 | 10 | 16 ± 2 | 2.02 |
| 37000 | 10 | 15.6 ± 0.9 | 1.98 |
| 45000 | 10 | 12 ± 1 | 1.55 |
Concentration of protein loaded in centrifuge cells at the beginning of the experiment.
Molecular masses were obtained by fitting to eq 2.
Values for the n-mer at each protein concentration and speed were obtained by fixing the monomeric molecular mass at 7855 Da.
Table 2.
Comparison of Fitting Statistics for Various Models of CBP Equilibrium Self-Associationa
| [protein]b(μM) | molecular massc (kDa) | monomer | dimer | trimer | tetramer | oligomerization state
|
|||
|---|---|---|---|---|---|---|---|---|---|
| 1 ⇆ 2 | 1 ⇆ 3 | 1 ⇆ 4 | 1 ⇆ 2 ⇆ 4 | ||||||
| 40 | 15 ± 1 | 4.98 | 0.57 | 3.92 | 9.71 | 0.19 | 0.43 | 0.52 | 0.42 |
| 20 | 15 ± 1 | 0.75 | 0.093 | 0.55 | 1.43 | 0.062 | 0.082 | 0.070 | 0.065 |
| 10 | 15 ± 1 | 1.10 | 0.16 | 0.95 | 2.19 | 0.085 | 0.13 | 0.10 | 0.090 |
The concentration traces at each protein concentration were obtained at four different speeds (25000, 35000, 37000, and 45000 rpm) and at 20 °C. Values under oligomerization state are summations of the squared difference between the observed and fitted values. The fitted values were generated by NLLS fitting to eq 4 for the monomer–n-mer equilibrium with the fixed monomeric eight of 7855 Da. (The error estimate represents the 95% confidence interval.)
Concentration of protein loaded in centrifuge cells at the beginning of the experiment.
Molecular mass obtained by fitting data at three speeds to eq 2.
(B) Dimer Dissociation Constant
Determination of the dissociation constant for a self-associating system from sedimentation equilibrium is best approached by the simultaneous fitting of multiple data sets (30). Therefore, data at four different rotor speeds for each sample concentration were simultaneously fit to obtain either the apparent molecular mass or dissociation constant for the dimer. The monomer–dimer model again correctly described this three-speed data set as judged by the distribution of residuals (see Figure 2B). Table 2 contains the fitted parameters determined from multiple-data set analysis at three concentrations of CBP. Analysis of the data using a monomer–dimer equilibrium model indicates that, under our experimental conditions, the average value of the dissociation constant (Kd) is 5.6 ± 2.6 μM at 20 °C and pH 6.5 (0.01 M KH2PO4 buffer with 0.1 M KCl).
(C) Effect of Solution Conditions on the Oligomerization State
Given that CBP is a noncovalent dimer, we examined the oligomerization state of the protein with respect to calcium concentration, pH, denaturant concentration, and salt concentration to compare the degree of dimer formation under the various physiological conditions that likely exist within H. capsulatum-infected phagolysosomes as well as more harsh conditions, likely to disrupt the dimer interface. The sedimentation equilibrium data indicate that native CBP exists predominantly as a dimer under all the conditions that were tested (see Table 3). Variations in pH and salt or Ca2+ concentration have very little effect on the oligomeric status of CBP. Only when CBP is denatured (with 7 M urea) does the monomeric form predominate in solution.
Table 3.
Effect of Solution Conditions on Apparent Molecular Masses and Dissociation Constants of the Dimer, Kd, Obtained from Multispeed Analysis of Sedimentation Equilibrium Data
| buffer conditiona | molecular massb (kDa) | n-merc | Kdd (μM) |
|---|---|---|---|
| apo-CBP | 15 ± 1 | 1.93 | 5.6 ± 2.6 |
| holo-CBPe | 15 ± 1 | 1.93 | 5.8 ± 2.8 |
| pH 3.0 | 14 ± 1 | 1.72 | 5.1 ± 0.7 |
| pH 5.0 | 16 ± 1 | 2.06 | N/Af |
| pH 8.0 | 14 ± 1 | 1.84 | 2.4 ± 0.8 |
| 1 M KCl | 13.3 ± 0.4 | 1.70 | 14.5 ± 3.3 |
| 2 M KCl | 13.1 ± 0.4 | 1.66 | 22.7 ± 6.1 |
| 3.5 M urea | 14.4 ± 0.7 | 1.84 | 1.9 ± 0.7 |
| 7.0 M urea | 9.1 ± 0.7 | 1.15 | 246 ± 33 |
All buffer conditions are 0.01 M KH2PO4, pH 6.5, and 0.1 M KCl (except for pH 3 and 5 where 0.01 M acetate buffer was used) unless otherwise noted with protein concentrations of 10, 20, and 40 μM.
Apparent molecular mass determined by fitting data at three speeds and three different initial protein concentrations to a single-species model.
Values for the n-mer were obtained by fixing the monomeric molecular mass at 7855 Da.
Values for the Kd were obtained by fitting to a monomer–dimer equilibrium model with the fixed molecular mass of 7855 Da.
The calcium binding buffer conditions for holo samples included 80 μM CaCl2.
Could not be fit to monomer–dimer equilibrium model.
Secondary Structure Analysis
Previously, the secondary structure of CBP was predicted from the sequence by using LINUS (31) and indicated that CBP is predominantly α-helical, with two short β-strand segments at the N-terminus (6). Here direct evidence for an altered secondary structure is presented.
(A) Circular Dichroism
Analysis of the far-UV CD spectrum of native CBP (Figure 3) confirmed that the protein contains significant α-helix. The contribution of CBP’s three disulfide bonds to the native fold was assessed by collecting CD spectra in the presence of a reducing agent (DTT) and/ or a denaturant (urea), as shown in Figure 3. The helical content of fully reduced CBP, calculated from the ratio of ellipticity at 222 nm, is only ~29% of that of the native protein. Urea-denatured CBP, with disulfide bonds still intact, maintains a similar ~21% of the native secondary structure, indicating that the disulfide bonds contribute significantly to protein stability and structure. No significant changes were detected in phosphate buffer (pH 6.5), with and without 0.10 M KCl, or in the presence of CaCl2 (data not shown). In addition, the far-UV CD profile of CBP did not vary over the pH range of 4.5–6.5.
Figure 3.
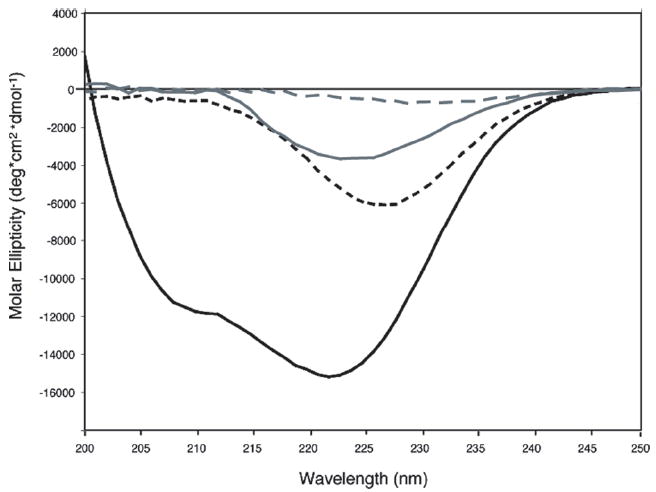
Far-UV CD spectra of CBP: native CBP at pH 6.5 (solid black line), reduced CBP (dashed black line), denatured CBP (solid gray line), and reduced and denatured CBP (dashed gray line). The samples contained 25 μM CBP in 0.01 M KH2PO4 (pH 6.5) and 0.1 M KCl at 25 °C; reduced samples also contained 15 mM DTT, and denatured samples also contained 10 M urea.
(B) NMR
The 2D 1H–15N HSQC spectrum of CBP (Figure 4) shows excellent chemical shift dispersion indicative of a folded protein. There is no indication of a dimer given that chemical shifts are degenerate for symmetric homodimers. Seventy-four of the expected 76 backbone peaks and six peaks attributed to the side chains of the one glutamine and two asparagine residues were resolved. Sequence-specific assignments (1H, 13C, and 15N) for CBP were made using a suite of heteronuclear multidimensional NMR experiments. Backbone 1H, 13C, and 15N assignments were obtained for all residues in CBP beyond proline 3 (except proline 56), and more than 90% of the side chain proton and carbon chemical shifts were assigned.
Figure 4.
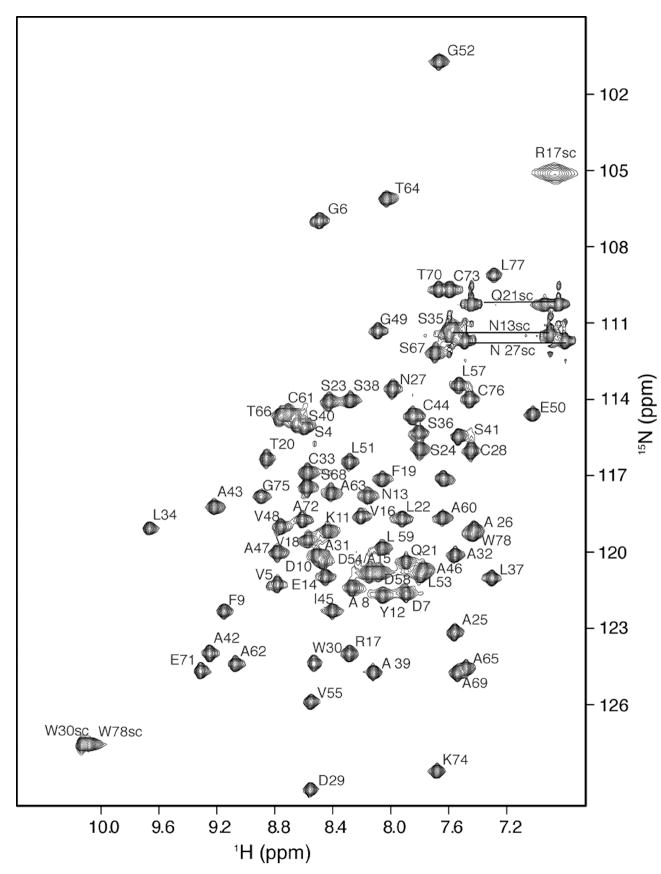
1H–15N HSQC spectrum of uniformly 15N-labeled CBP at a protein concentration of 1 mM in 10 mM deuterated Hepes (pH 6.5), 100 mM KCl, and 0.02% NaN3 at 25 °C. Backbone amide correlations are labeled according to the assignments described in text. Cross-peaks are connected by lines corresponding to Gln and Asn side chain NH2 groups.
Following the essentially complete chemical shift assignment of CBP, elements of secondary structure were derived from consensus chemical shift indices, NOE connectivities, and dihedral angle constraints calculated from measured 3JNHα coupling constants. As shown in Figure 5, significant stretches of dαN(i, i + 3) and dαβ (i, i + 3) NOE connectivities between residues 4 and 25, 34 and 43, 46 and 54, and 57 and 64 were found. Furthermore, strong dαN(i, i + 2) and dNN(i, i + 2) connectivities and 3JNHα coupling constants of <6 Hz in these regions suggest that all of these regions are α-helical (32). The region between the helical segments and the C-terminus lack the short-range NOE connectivity patterns characteristic of well-defined secondary structural elements. For example, no dαN(i, i + 3) or dαβ(i, i + 3) cross-peaks were observed for residues 27–33 or 64–73; rather, only dNN(i, i + 1) cross peaks were found. In addition, several large 3JNHα coupling constants (>6 Hz) were determined for residues Ser 4, Asn 27, Asp 29, Ser 38, Ala 39, Glu 50, Gly 52, Thr 64, Gly 75, Cys 76, and Leu 77, suggesting these residues are in extended or loop regions. Figure 5 also displays the consensus chemical shift indices (CSIs) for CBP and the resulting solution-state secondary structure. This CSI-derived secondary structure reveals major differences from the de novo-predicted secondary structure of CBP. Four distinct α-helices were identified. The longest α-helix (from residue 5 to 25) replaces the computationally predicted β-sheets at the N-terminus.
Figure 5.
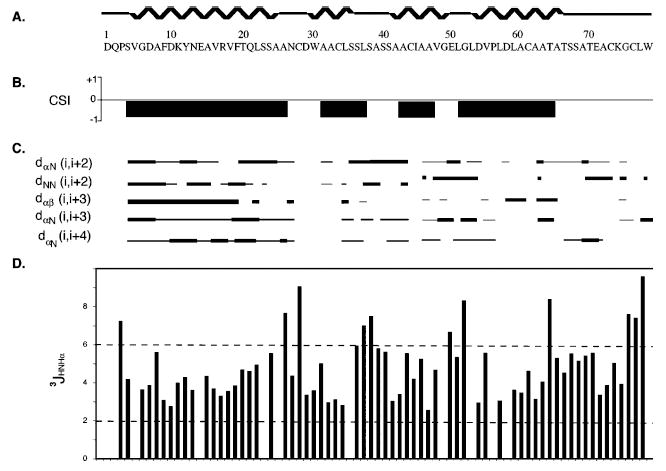
Summary of secondary structure determinants collected for CBP. (A) Secondary structure determined from the consensus chemical shift index, the residue numbers, and the amino acid sequence of mature CBP. (B) Measured chemical shift indices for CBP, where positive CSI values correspond to regions of β-sheet and negative values reflect regions of α-helix. (C) NOE connectivities, which are classified by the NOE volume (strong or weak) and are reflected in the thickness of the bars. (D) Measured scalar coupling constants (3JHNHA), with values between 2 and 6 corresponding to α-helical bond angles.
Disulfide Bond Linkage Pattern
With no prior information about the status of the six cysteine residues of CBP, our first objective was to determine the native state of these cysteines, each of which had the potential to be involved in intra-or intermolecular linkages or to remain in a reduced state. The molecular mass of apo-CBP determined from high-accuracy ESI-MS (Figure 1) is 7855 Da, which is precisely 6 Da less than the average mass of mature CBP (7861 Da) containing no disulfide bonds. In addition, the oxidized state of the six cysteine residues was clearly indicated by the 13C chemical shift of the Cβ atoms between 37 and 43.2 ppm. The Cβ chemical shift is extremely sensitive to the redox state, and the observed Cβ shift for oxidized cysteines falls in the range of 41 ± 4 ppm and for reduced cysteines the range 28 ± 2 ppm (33). The existence of monomeric CBP observed in both MS and sedimentation equilibrium data indicates that CBP is not a disulfide-linked (covalent) dimer. These results provide evidence of the presence of three intramolecular disulfide bonds and led to further examination of the disulfide bond linkage pattern, necessitating use of proteolysis in conjunction with MS and NMR techniques.
(A) Proteolysis
Purified CBP was digested with various proteases (trypsin, Glu-C, Lys-C, Asp-N, etc.) with potential cleavage sites mapped onto the sequence of CBP in Figure 6. Digested samples were then purified by RP-HPLC and subjected to ESI-mass spectrometry (ESI-MS) and collision-induced tandem mass spectrometry (CID MS/MS) analysis to determine sites of cleavage from the masses of resulting peptides. The ESI mass spectrum of trypsin-digested peptides exhibited a strong peak for a fragment with a mass of 5962 Da. This peptide corresponds to that created by cleavage of mature CBP at Arg 17, leaving residues 18–78 intact with a missed cleavage at Lys 74. Further cleavage of this tryptic peptide by Glu-C resulted in a 5981 Da fragment, which can be ascribed to the addition of H2O (+18 Da) by proteolytic cleavage at one of the glutamic acid sites. The resulting peptide apparently resisted further digestion because of the presence of the disulfide linkages, and further tandem MS analysis of the Glu-C fragment revealed that cleavage had occurred at Glu 50. Similar digests with Asp-N and Lys-C produced fragments corresponding to cleavage only at the N-terminus, which did not provide any fragmentation patterns that could aid in identification of the disulfide linkages. Additional digestions were carried out under denaturing conditions (where compatible with enzyme) and at high concentrations of enzyme for extended periods of time; however, these extreme conditions did not promote further proteolysis. The fact that so many missed cleavages emerged from these proteolysis experiments is evidence of the protease resistant nature of CBP.
Figure 6.
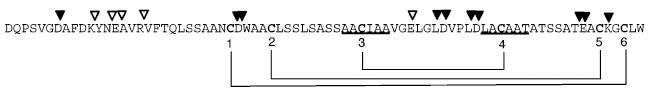
Summary of CBP proteolysis. Successful cleavage sites identified by ESI-MS after proteolysis are indicated above the sequence of CBP for digests with trypsin, Glu-C, Asp-N, or Lys-C indicated by white triangles, whereas missed cleavage sites are indicated by black triangles. Underlined segments represent disulfide-linked peptides identified by 50% H2 18O proteolysis with pepsin. The final resolved disulfide linkages are designated with brackets and numbered by cysteine positions.
(B) Disulfide-Linked Peptide 18O/16O Isotope Patterns
Proteolytic 18O labeling in a peptic digest was pursued as an alternative to conventional protease methods for identification of disulfide-linked peptides (20). Pepsin has broad specificity, increasing the likelihood of cleavage between all cysteine residues of the substrate protein. The ambiguity of resulting mixtures of peptide is overcome by digestion in 50% H2 18O, which provides distinct isotope profiles for disulfide-linked peptides in digests because the oxygen atom is incorporated at the C-terminus of the cleavage site (34). CBP was digested with pepsin in 50% H2 18O, and a potential two-chain disulfide-linked peptide was tentatively identified on the basis of its characteristic isotopic mass profile. A distinctive ion from this disulfide-linked peptide was observed at m/z 1065.5, consistent with the assignment of a peptide containing Ala 42–Ala 47 (C3) linked to Leu 59–Thr 64 (C4). This linkage was confirmed by tandem MS analysis (Figure S2 of the Supporting Information), where the presence of all b and y ions confirms the sequence of the peptides. These data are consistent with a disulfide link between Cys 44 (C3) and Cys 61 (C4).
Further proteolysis experiments did not provide any further information about disulfide linkages. In addition, failed attempts at partial reduction of CBP followed by cyanylation (or other chemical modification) only provided further verification of the stability of this protein’s disulfide bonds. Therefore, alternative methods that do not depend on breaking of bonds or reducing of the disulfide bonds were sought for resolving the remaining two cysteine bonds.
(C) NMR
Determination of the final two linkages required labeling of the cysteines for subsequent chemical shift assignment and identification of unique NOE patterns. Preliminary labeling of CBP for NMR did not incorporate 13C or 15N at the cysteine (or proline) residues because both amino acids are included in the growth medium as essential nutrients for H. capsulatum. Only after the medium had been enriched with [13C/ 15N]cysteine could the chemical shifts of the cysteine residues be assigned unambiguously. Numerous NOEs were observed between Cys 44 and Cys 61, though neither was involved in NOE contacts with any of the other cysteine residues, reinforcing the presence of a disulfide bridge between C3 and C4. The proximity of Cys 28 to Cys 33 and Cys 73 to Cys 76 in the primary sequence, coupled with the fact that both the carbon and proton chemical shift values for these residues are similar or overlapping, made assignment of these two disulfide bonds more complicated. The Cα planes of Cys 73 and Cys 76 in the CH-NOESY spectrum did yield specific correlations between the Hα atom of Cys 73 and both Hβ protons of Cys 33, and likewise between the Hα atom of Cys 76 and the Hβ protons of Cys 28, as shown in Figure S3 of the Supporting Information. These unique NOESY patterns provide direct evidence for the following disulfide linkage pattern based on cysteine position numbering, 1–6, 2–5, 3–4, yielding the direct covalent intramolecular Cys 28–Cys 76, Cys 33–Cys 73, and Cys 44–Cys 61 linkages.
Protein Stability
To characterize the stability and domain structure of CBP, we undertook an analysis of the thermal and denaturant-induced unfolding transitions of CBP.
(A) Thermal Denaturation
Thermal unfolding of CBP was monitored using far-UV CD. With a short exposure to an elevated temperature, thermal denaturation of CBP is ≥95% reversible (data not shown). Our data suggest that the denaturation transition of CBP occurs through a single conformational event from a native dimer to an unfolded monomer. In such a denaturation process, the midpoint temperature should be concentration-dependent, decreasing with protein concentration. This dependency is observed experimentally in Figure 7, where three denaturation curves are shown covering the 5–50 μM protein concentration range. Using a model that assumes that folded monomers (or unfolded dimers) are not populated significantly, we satisfactorily fit individual thermal transitions for CBP with a NLLS fitting procedure, and the results are shown in Figure 7 as solid lines (with residuals to the fit at the top). The thermodynamic parameters derived from the analysis over the range of protein concentrations are summarized in Table 4. CBP unfolds with an apparent single transition and an average midpoint, Tm, of 52.9 °C. The average enthalpy of unfolding (ΔHm°), also determined from NLLS fitting of the data to a modified van’t Hoff equation, is 58.5 kcal/mol. The Tm value increases with protein concentration, as expected for most dimeric proteins (Table 4). Thermal denaturation was also carried out on calcium-free and calcium-bound CBP, yet no changes in denaturation curves were observed (data not shown).
Figure 7.
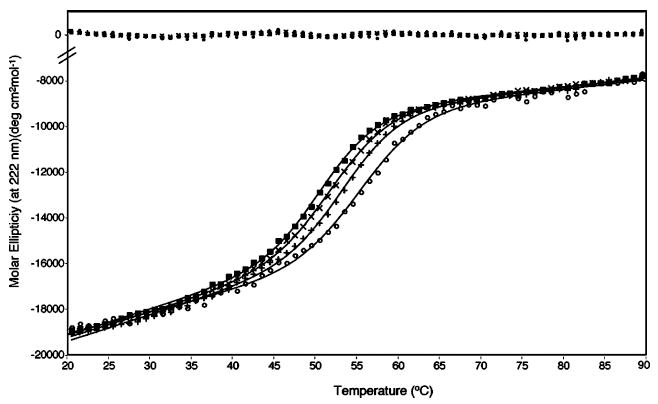
Thermal denaturation monitored by CD of CBP at protein concentrations of 5 (■), 10 (×), 20 (+), and 50 μM (○) in 0.01 M KH2PO4 and 0.1 M KCl (pH 6.5). Solid lines represent the results of fitting the data to a two-state unfolding model, with residuals plotted at the top.
Table 4.
Thermal Denaturation Parameters for CBPa
| [protein] (μM) | Tmb (°C) | ΔHm°c (kcal/mol) |
|---|---|---|
| 5 | 50.6 ± 0.1 | 60 ± 2 |
| 10 | 52.0 ± 0.1 | 57 ± 2 |
| 20 | 53.5 ± 0.2 | 61 ± 2 |
| 50 | 55.5 ± 0.3 | 56 ± 3 |
Buffer conditions are 0.01 M KH2PO4, pH 6.5, and 0.1 M KCl.
Midpoint of thermal transition determined by NLLS fitting of data to a modified van’t Hoff equation.
Enthalpies of unfolding parameters were also determined by fitting of individual thermal transitions to a two-state model using a thermodynamic formalism.
(B) Chemical Denaturation
To further examine the stability properties and unfolding pathway of CBP, we performed far-UV CD measurements in the presence of increasing concentrations of urea under conditions where the protein forms a stable dimer. Urea-induced conformational changes were detected by measuring the relative change in ellipticity at 222 nm, and the unfolding profile (Figure 8) reflects a simple two-state denaturation curve. Therefore, our initial analysis of urea denaturation curves was based on the assumption that only two states exist at equilibrium: the native dimer (N2) and the unfolded monomer (2U). Dissociation leads to the formation of an intrinsically unstable species, given that a folded monomeric species will not be significantly populated at equilibrium. The unfolding mechanism and the energetics can be determined using the linear extrapolation method (LEM), much like that of monomer denaturation (16, 17, 35). NLLS fitting of the data shown in Figure 8 indicates that the extrapolated free energy of unfolding (ΔG°) is 2.9 ± 0.5 kcal/mol, the midpoint of unfolding Cm is 3.4 M urea, and the slope m is −0.84 kcal mol−1 M−1. With the exception of the calculated ΔG °, these values are within the range expected for a stable protein with a compact folded core (36, 37). The presence of residual protein structure that remains at high denaturant concentrations likely explains the artificially low ΔG° value for CBP. In other words, the three disulfide bonds of each CBP monomer still contribute to the stability of the denatured state, and these denaturation curves obtained under oxidizing conditions do not account for the bonds.
Figure 8.
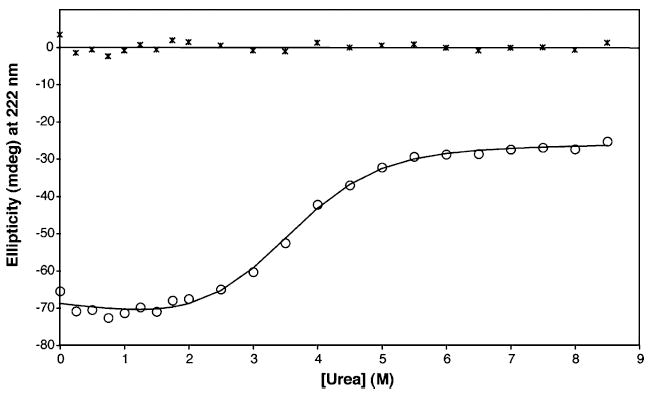
Urea-induced denaturation monitored by CD of CBP (25 μM) in 0.01 M KH2PO4 and 0.1 M KCl (pH 6.5) at room temperature. The solid line represents the results of fitting the data (○) to a two-state unfolding model with residuals plotted at the top.
DISCUSSION
The Ca2+ binding results presented here suggest that CBP binds two Ca2+ ions with relatively high affinity [K1 = (3.10 ± 0.4) × 108 M−1 and K2 = (6.07 ± 0.2) × 108 M−1]. This is consistent with the amount of free calcium available during infection by Histoplasma, which grows within phagolysosomes of host macrophages. The calcium level within macrophage lysosomes is highly dependent on pH, and it is likely that calcium levels would be rather limited (<1 μM) in the pH range of 6.0–6.5 that is maintained during Histoplasma infection (2, 38). The results of this work also clearly demonstrate that the secondary, tertiary, and quaternary structure of CBP are Ca2+-independent. CD spectra, NMR chemical shifts, and sedimentation equilibrium profiles are all unaffected by the presence of calcium, indicating that CBP does not undergo any conformational change with respect to binding calcium. This lack of any Ca2+-induced conformational changes suggests that CBP is unable to transduce extracellular Ca2+ concentration changes to other proteins. However, there is the possibility that calcium binding affinity and/or conformational changes may require other cofactors, such as membrane binding. Calcium binding is also not involved in stabilizing the structure of CBP, as verified by identical thermal denaturation profiles in the presence or absence of calcium.
Sedimentation equilibrium analysis is a powerful and thermodynamically rigorous method for determining native molecular masses in dilute solutions (30, 39, 40). These data clearly demonstrate that CBP exists in equilibrium between monomer and dimer states. Sedimentation equilibrium analysis also enables determination of dissociation constant(s). In this study, global fits at multiple sample concentrations resulted in consistent dissociation constant values, indicating accuracy of the determined parameter. For CBP, the KD value of the dimer is 5.6 ± 2.6 μM at 20 °C, indicating that the dimeric species of this protein is critically dependent on the intracellular concentration of CBP, yet the stability of the dimeric form, once formed, is considerable as high-salt (2 M KCl) and partially denaturing conditions (3.5 M urea) did not significantly alter the monomer–dimer equilibrium. It is important to establish the oligomerization state of CBP directly in this manner as it affects interpretation of the results of other analyses such as structural and unfolding studies.
Although CBP has no sequence homology to any other proteins, initial secondary structure predictions based on the sequence of CBP by using early de novo modeling (31) indicated that the N-terminus adopts a two-stranded β-sheet while the remainder of the protein is α-helical (6). NMR and CD spectroscopy analyses substantiate the proposal that CBP has a defined secondary structure that is predominantly α-helical, and the CSI results also provide evidence of distinct differences from the preliminary model. The 1:1 correspondence between the number of backbone NH peaks observed in the 15N HSQC spectrum and the number of amino acid residues indicates that CBP adopts a single conformation in aqueous solution under the conditions used for the NMR experiment.
The CD spectrum and hence the secondary structure composition of CBP change very little over the pH range of 4.5–6.5. Minor pH-induced conformational changes were observed in the far-UV CD spectra, as the peak intensity varied by 70%, yet minima were retained at 208 and 222 nm. The pH independence of the CD spectral profile suggests that CBP retains a high degree of α-helical structure over the pH range this protein would encounter inside the phagolysosome. It also is likely that the α-helicity observed at low pH results from the conformational constraints produced by CBP’s three disulfide bonds, which was noted for other disulfide-linked proteins (41).
CBP monomers each contain three intramolecular disulfide bonds. Initial attempts to define the complete disulfide bond arrangement of CBP were hampered by its resistance to proteolysis; however, the disulfide linkage pattern could be determined via a combination of peptic digestions in 50% H2 18O and NMR distance restraints. The resolved disulfide bond arrangement (Cys 28–Cys 76, Cys 33–Cys 73, and Cys 44–Cys 61) provides a key restraint for future work aimed at defining the tertiary and quaternary structure of CBP. This nested pattern (1–6, 2–5, 3–4) of disulfide bonds is likely the most significant contributor to the inherent stability, structure, and yet-to-be-determined specific function of CBP. In fact, the spacing and position of the six cysteine residues are absolutely conserved in CBP identified in the sequence of three H. capsulatum strains (G186AR, G217B, and WU24) and the closely related dimorphic fungal pathogen Paracoccidiodes brasiliensis (GenBank accession number Q6TS31), suggesting that this disulfide bond arrangement is critical for function.
We characterized the thermodynamic properties of CBP from H. capsulatum and demonstrate that CBP denatures reversibly through a single transition that involves dimer dissociation. As expected from a denaturation transition coupled to dissociation, the midpoint of thermal unfolding (Tm) is concentration-dependent. An estimation of the in vivo CBP concentration is necessary for the determination of the stability of the protein under physiological conditions. Unfortunately, the volume of the lumen of the phagolysosomal compartment is unknown, so the concentration of intracellular CBP cannot be accurately estimated; thus, the oligomeric status in this compartment remains unresolved. Nonetheless, both the stability data and the dimer dissociation constant determined here suggest that the monomeric form of CBP is unstable and indicate that CBP likely functions as a dimer in vivo. These findings also indicate that CBP may be regulated through a concentration-dependent, quaternary structural transition.
Dimer dissociation and unfolding of CBP were examined with respect to increasing urea concentration to provide additional information regarding the general structural stability properties of the protein and to enable comparisons of its stability to those of other dimer systems. The conformational stabilities, ΔG°, determined for dimeric proteins that denature with a single transition of native dimer to denatured monomer range from 10 to 27 kcal/mol (37). The unfolding free energy for CBP determined from equilibrium urea denaturation studies would suggest that the protein is not thermodynamically stable. However, this value for the conformational stability of CBP is almost certainly artificially small due to the presence of intact disulfide bonds that maintain residual structure at high denaturant concentrations under nonreducing conditions.
Like those of many other secreted proteins, the structure and stability of CBP are decidedly dependent on its disulfide bonds. Oxidized CBP is not completely unfolded in 10 M urea, whereas even local structures are abolished by reduction. Reduction of the three disulfide bond removes more than 70% of the CD signature of the α-helix structure of native CBP and makes unfolding noncooperative. Hence, the reduced protein has a poorly ordered structure and retains only approximately one-third of the secondary structure of native CBP. Despite the fact that the overall energy contribution of the three disulfide bonds could not be quantified from the available data because unfolding of reduced CBP is noncooperative, these observations underline the importance of the disulfide linkages in stabilizing the fold and local native structure.
A comparison of the extrapolated free energy of unfolding, ΔG°, and the independently determined dissociation of native dimer, ΔGdiss°, provides information about the relative contributions of tertiary and quaternary structure to stability (37). The difference between ΔG°, 2.9 kcal/mol, and ΔGdiss°, 7.1 kcal/mol (calculated from ΔGdiss° = −RT ln Kdis), for CBP suggests that the isolated monomer is unstable under the experimental conditions. These stability measurements for CBP are well below the normal conformational stability of monomers (6–14 kcal/mol) (42), thus supporting the concept that the stability of CBP arises from monomer–monomer interactions, including the enthalpic contributions across the dimer interface.
CONCLUSION
When CBP was initially identified and characterized as a calcium binding protein, its function in pathogenesis was linked to a correlation between calcium chelation and inhibition of normal endosomal acidification (3, 43). This study represents the first quantitative assessment of the Ca2+ binding affinity of CBP and is consistent with its secretion into a phagolysosomal compartment (44) that is likely to be calcium-limiting. However, CBP structure is unperturbed upon binding calcium, and calcium seems to be unrelated to the high structural stability of this protein. The thermal stability and structural studies presented here indicate that the highly helical CBP homodimers can be dissociated to form monomers only in a denatured state. Initial characterization of the secondary structure, oligomerization status, and disulfide bond linkage laid the foundation for future investigations of the three-dimensional structure of CBP that are currently underway with the purpose of defining the functional role of this unique protein in H. capsulatum pathogenesis.
Supplementary Material
Calcium titration curves using chromophoric chelator fura-2 in competition with CBP (Figure S1), MS/MS spectra of pepsin-digested CBP from the 18O/16O−H2O cleavage reaction (Figure S2), and 2D planes of the 3D 13C NOESY-HSQC spectrum of CBP (Figure S3). This material is available free of charge via the Internet at http://pubs.acs.org.
Acknowledgments
We acknowledge the generous assistance of John D. Monsey and Karl Maluf in calcium binding and analytical ultracentrifuge data collection, respectively. We are grateful for the use of CD and fluorescence spectroscopy equipment in the labs of Kathleen Hall, Carl Frieden, Sharon Campbell, and David Fremont. We thank Randy Rodrigues for NMR pilot studies as well as the other members of the Goldman, Cistola, and Gross labs for input and advice throughout this project. We are also indebted to Kathleen Hall and Peter Chivers for critical review of the manuscript.
Footnotes
This work was supported by National Institutes of Health Grants AI25584 to W.E.G., DK48046 to D.P.C., DK52574 to the Protein Structure Core of the Washington University Digestive Diseases Research Core Center, and 2P41RR00954 for the Mass Spectrometry Research Resource at Washington University.
Abbreviations: CBP, calcium-binding protein; ESI-MS, electrospray ionization mass spectrometry; CD, circular dichroism; NMR, nuclear magnetic resonance; RP-HPLC, reversed-phase high-pressure liquid chromatography; TFA, trifluoroacetic acid; FA, formic acid; m/z, mass-to-charge ratio; Q-tof, quadrupole time-of-flight; LTQ-FT, linear quadrupole ion trap-Fourier transform; HSQC, heteronuclear single-quantum coherence; NLLS, nonlinear least-squares; NOESY, nuclear Overhauser and exchange spectroscopy; CSI, chemical shift index; 3JNHα, three-bond coupling constant between the amide nitrogen and the α-proton; LEM, linear extrapolation method.
References
- 1.Eissenberg LG, Goldman WE. Fusion of lysosomes with phagosomes containing Histoplasma capsulatum: Use of fluoresceinated dextran. Adv Exp Med Biol. 1988;239:53–61. doi: 10.1007/978-1-4757-5421-6_6. [DOI] [PubMed] [Google Scholar]
- 2.Eissenberg LG, Goldman WE, Schlesinger PH. Histoplasma capsulatum modulates the acidification of phagolysosomes. J Exp Med. 1993;177:1605–1611. doi: 10.1084/jem.177.6.1605. [DOI] [PMC free article] [PubMed] [Google Scholar]
- 3.Sebghati TS, Engle JT, Goldman WE. Intracellular parasitism by Histoplasma capsulatum: Fungal virulence and calcium dependence. Science. 2000;290:1368–1372. doi: 10.1126/science.290.5495.1368. [DOI] [PubMed] [Google Scholar]
- 4.Rappleye CA, Engle JT, Goldman WE. RNA interference in Histoplasma capsulatum demonstrates a role for α-(1,3)-glucan in virulence. Mol Microbiol. 2004;53:153–165. doi: 10.1111/j.1365-2958.2004.04131.x. [DOI] [PubMed] [Google Scholar]
- 5.Batanghari JW, Goldman WE. Calcium dependence and binding in cultures of Histoplasma capsulatum. Infect Immun. 1997;65:5257–5261. doi: 10.1128/iai.65.12.5257-5261.1997. [DOI] [PMC free article] [PubMed] [Google Scholar]
- 6.Batanghari JW, Deepe GS, Jr, Di Cera E, Goldman WE, Bhattacharya A, Murthy MR, Surolia A. Histoplasma acquisition of calcium and expression of CBP1 during intracellular parasitism. Mol Microbiol. 1998;27:531–539. doi: 10.1046/j.1365-2958.1998.00697.x. [DOI] [PubMed] [Google Scholar]
- 7.Linse S, Forsen S. Determinants That Govern High-Affinity Calcium Binding. In: Means AR, editor. Advances in Second Messenger and Phosphoprotein Research. Raven Press, Ltd; New York: 1995. pp. 89–108. [DOI] [PubMed] [Google Scholar]
- 8.Nakayama S, Moncrief ND, Kretsinger RH. Evolution of EF-hand calcium-modulated proteins. II. Domains of several subfamilies have diverse evolutionary histories. J Mol Evol. 1992;34:416–448. doi: 10.1007/BF00162998. [DOI] [PubMed] [Google Scholar]
- 9.Pauls TL, Cox JA, Berchtold MW. The Ca2+-binding proteins parvalbumin and oncomodulin and their genes: New structural and functional findings. Biochim Biophys Acta. 1996;1306:39–54. doi: 10.1016/0167-4781(95)00221-9. [DOI] [PubMed] [Google Scholar]
- 10.Worsham PL, Goldman WE. Quantitative plating of Histoplasma capsulatum without addition of conditioned medium or siderophores. J Med Vet Mycol. 1988;26:137–143. [PubMed] [Google Scholar]
- 11.Linse S. Calcium Binding to Proteins Studied via Competition with Chromophoric Chelators. In: Vogel HJ, editor. Calcium-Binding Protein Protocols. Humana Press; Totowa, NJ: 2002. pp. 15–24. [DOI] [PubMed] [Google Scholar]
- 12.Haugland R. Handbook of fluorescent probes and research chemicals. Molecular Probes, Inc.; Eugene, OR: 1996. [Google Scholar]
- 13.Linse S, Brodin P, Drakenberg T, Thulin E, Sellers P, Elmden K, Grundstrom T, Forsen S. Structure-function relationships in EF-hand Ca2+-binding proteins. Protein engineering and biophysical studies of calbindin D9k. Biochemistry. 1987;26:6723–6735. doi: 10.1021/bi00395a023. [DOI] [PubMed] [Google Scholar]
- 14.Andre I, Linse S, Graves PR, Haystead TA. Measurement of Ca2+-binding constants of proteins and presentation of the CaLigator software. Anal Biochem. 2002;305:195–205. doi: 10.1006/abio.2002.5661. [DOI] [PubMed] [Google Scholar]
- 15.Laue TM, Shah BD, Ridgeway TM, Pelletier SL. Computer-aided interpretation of analytical sedimentation data for proteins. In: Harding SE, Rowe AJ, Horton JC, editors. Analytical Ultracentrifugation in Biochemistry and Polymer Science. Royal Society of Chemistry; Cambridge, U.K.: 1992. pp. 90–125. [Google Scholar]
- 16.Santoro MM, Bolen DW. A test of the linear extrapolation of unfolding free energy changes over an extended denaturant concentration range. Biochemistry. 1992;31:4901–4907. doi: 10.1021/bi00135a022. [DOI] [PubMed] [Google Scholar]
- 17.Schellman JA. The thermodynamic stability of proteins. Annu Rev Biophys Biophys Chem. 1987;16:115–137. doi: 10.1146/annurev.bb.16.060187.000555. [DOI] [PubMed] [Google Scholar]
- 18.Chalkley RJ, Baker PR, Huang L, Hansen KC, Allen NP, Rexach M, Burlingame AL. Comprehensive analysis of a multidimensional liquid chromatography mass spectrometry dataset acquired on a quadrupole selecting, quadrupole collision cell, time-of-flight mass spectrometer: II. New developments in Protein Prospector allow for reliable and comprehensive automatic analysis of large datasets. Mol Cell Proteomics. 2005;4:1194–204. doi: 10.1074/mcp.D500002-MCP200. [DOI] [PubMed] [Google Scholar]
- 19.Clauser KR, Baker P, Burlingame AL. Role of accurate mass measurement (±10 ppm) in protein identification strategies employing MS or MS/MS and database searching. Anal Chem. 1999;71:2871–2882. doi: 10.1021/ac9810516. [DOI] [PubMed] [Google Scholar]
- 20.Wallis TP, Pitt JJ, Gorman JJ. Identification of disulfide-linked peptides by isotope profiles produced by peptic digestion of proteins in 50% 18O water. Protein Sci. 2001;10:2251–2271. doi: 10.1110/ps.15401. [DOI] [PMC free article] [PubMed] [Google Scholar]
- 21.Markley JL, Bax A, Arata Y, Hilbers CW, Kaptein R, Sykes BD, Wright PE, Wuthrich K. Recommendations for the presentation of NMR structures of proteins and nucleic acids. J Mol Biol. 1998;280:933–952. doi: 10.1006/jmbi.1998.1852. [DOI] [PubMed] [Google Scholar]
- 22.Muhandiram DR, Kay LE. Gradient-Enhanced Triple-Resonance Three-Dimensional NMR Experiments with Improved Sensitivity. J Magn Reson Ser B. 1994;103:203–216. [Google Scholar]
- 23.Kay LE, Xu GY, Yamazaki T. Enhanced-sensitivity triple-resonance spectroscopy with minimal H2O saturation. J Magn Reson. 1994;109:129–133. [Google Scholar]
- 24.Grzesiek S, Dobeli H, Gentz R, Garotta G, Labhardt AM, Bax A. 1H, 13C, and 15N NMR backbone assignments and secondary structure of human interferon-γ. Biochemistry. 1992;31:8180–8190. doi: 10.1021/bi00150a009. [DOI] [PubMed] [Google Scholar]
- 25.Kay LE. Pulsed-field gradient-enhanced three-dimensional NMR experiment for correlating 13Cα/β, 13C′, and 1Hα chemical shifts in uniformly carbon-13-labeled proteins dissolved in water. J Am Chem Soc. 1993;115:2055–2057. [Google Scholar]
- 26.Grzesiek S, Anglister J, Bax A. Correlation of Backbone Amide and Aliphatic Side-Chain Resonances in 13C/15N-Enriched Proteins by Isotropic Mixing of 13C Magnetization. J Magn Reson Ser B. 1993;101:114–119. [Google Scholar]
- 27.Kay LE, Xu GY, Singer AU, Muhandiram DR, Formankay JD. A Gradient-Enhanced HCCH-TOCSY Experiment for Recording Side-Chain 1H and 13C Correlations in H2O Samples of Proteins. J Magn Reson Ser B. 1993;101:333–337. [Google Scholar]
- 28.Yamakaki T, Forman-Kay JD, Kay LE. Two-dimensional NMR experiments for correlating carbon-13β and proton δ/γ chemical shifts of aromatic residues in 13C-labeled proteins via scalar couplings. J Am Chem Soc. 1993;115:11054–11055. [Google Scholar]
- 29.Linse S, Brodin P, Johansson C, Thulin E, Grundstrom T, Forsen S. The role of protein surface charges in ion binding. Nature. 1988;335:651–652. doi: 10.1038/335651a0. [DOI] [PubMed] [Google Scholar]
- 30.Yphantis DA. Equilibrium Ultracentrifugation of Dilute Solutions. Biochemistry. 1964;3:297–317. doi: 10.1021/bi00891a003. [DOI] [PubMed] [Google Scholar]
- 31.Srinivasan R, Rose GD. LINUS: A hierarchic procedure to predict the fold of a protein. Proteins. 1995;22:81–99. doi: 10.1002/prot.340220202. [DOI] [PubMed] [Google Scholar]
- 32.Wuthrich K. NMR of Proteins and Nucleic Acids. John Wiley and Sons; New York: 1986. [Google Scholar]
- 33.Sharma D, Rajarathnam K. 13C NMR chemical shifts can predict disulfide bond formation. J Biomol NMR. 2000;18:165–171. doi: 10.1023/a:1008398416292. [DOI] [PubMed] [Google Scholar]
- 34.Gorman JJ, Wallis TP, Pitt JJ. Protein disulfide bond determination by mass spectrometry. Mass Spectrom Rev. 2002;21:183–216. doi: 10.1002/mas.10025. [DOI] [PubMed] [Google Scholar]
- 35.Hu CQ, Sturtevant JM, Thomson JA, Erickson RE, Pace CN. Thermodynamics of ribonuclease T1 denaturation. Biochemistry. 1992;31:4876–4882. doi: 10.1021/bi00135a019. [DOI] [PubMed] [Google Scholar]
- 36.Mei G, Di Venere A, Rosato N, Finazzi-Agro A. The importance of being dimeric. FEBS J. 2005;272:16–27. doi: 10.1111/j.1432-1033.2004.04407.x. [DOI] [PubMed] [Google Scholar]
- 37.Neet KE, Timm DE. Conformational stability of dimeric proteins: Quantitative studies by equilibrium denaturation. Protein Sci. 1994;3:2167–2174. doi: 10.1002/pro.5560031202. [DOI] [PMC free article] [PubMed] [Google Scholar]
- 38.Christensen KA, Myers JT, Swanson JA. pH-dependent regulation of lysosomal calcium in macrophages. J Cell Sci. 2002;115:599–607. doi: 10.1242/jcs.115.3.599. [DOI] [PubMed] [Google Scholar]
- 39.Hansen JC, Lebowitz J, Demeler B. Analytical ultracentrifugation of complex macromolecular systems. Biochemistry. 1994;33:13155–13163. doi: 10.1021/bi00249a001. [DOI] [PubMed] [Google Scholar]
- 40.Laue TM, Rhodes DG. Determination of size, molecular weight, and presence of subunits. Methods Enzymol. 1990;182:566–587. doi: 10.1016/0076-6879(90)82045-4. [DOI] [PubMed] [Google Scholar]
- 41.Resnick H, Carter JR, Kalnitsky G. The relationship of disulfide bonds and activity in ribonuclease. J Biol Chem. 1959;234:1711–1713. [PubMed] [Google Scholar]
- 42.Pace CN. Conformational stability of globular proteins. Trends Biochem Sci. 1990;15:14–17. doi: 10.1016/0968-0004(90)90124-t. [DOI] [PubMed] [Google Scholar]
- 43.Gerasimenko JV, Tepikin AV, Petersen OH, Gerasi-menko OV. Calcium uptake via endocytosis with rapid release from acidifying endosomes. Curr Biol. 1998;8:1335–1338. doi: 10.1016/s0960-9822(07)00565-9. [DOI] [PubMed] [Google Scholar]
- 44.Kugler S, Young B, Miller VL, Goldman WE, Bhattacharya A, Murthy MR, Surolia A. Monitoring phase-specific gene expression in Histoplasma capsulatum with telomeric GFP fusion plasmids. Cell Microbiol. 2000;2:537–547. doi: 10.1046/j.1462-5822.2000.00078.x. [DOI] [PubMed] [Google Scholar]
Associated Data
This section collects any data citations, data availability statements, or supplementary materials included in this article.
Supplementary Materials
Calcium titration curves using chromophoric chelator fura-2 in competition with CBP (Figure S1), MS/MS spectra of pepsin-digested CBP from the 18O/16O−H2O cleavage reaction (Figure S2), and 2D planes of the 3D 13C NOESY-HSQC spectrum of CBP (Figure S3). This material is available free of charge via the Internet at http://pubs.acs.org.