

Abstract
NADH-quinone oxidoreductase (complex I) in bovine heart mitochondria has a molecular weight of approximately 1 million Da composed of 45 distinct subunits. It is the largest energy transducing complex so far known. Bacterial complex I is simpler and smaller, but the essential redox components and the basic mechanisms of electron and proton translocation are the same. Over the past three decades, Ohnishi et al. have pursued extensive EPR studies near liquid helium temperatures and characterized most of the iron–sulfur clusters in complex I. Recently, Yakovlev et al. [G. Yakovlev, T. Reda, J. Hirst, Reevaluating the relationship between EPR spectra and enzyme structure for the iron-sulfur clusters in NADH:quinone oxidoreductase, Proc. Natl. Acad. Sci. U. S. A. 104 (2007) 12720–12725] challenged Ohnishi’s group by claiming that there were EPR “misassignments” among clusters N4, N5 and N6b (in order to prevent confusion, we used current consensus nomenclature, as the nickname). They claimed that we misassigned EPR signals arising from cluster N5 to cluster N4, and signals from cluster N6b to cluster N4. They also proposed that cluster N5 has (4Cys)-ligands. Based on the accumulated historical data and recent results of our site-specific mutagenesis experiments, we confirmed that cluster N5 has (1His+3Cys)-ligands as we had predicted. We revealed that E. coli cluster N5 signals could be clearly detected at the sample temperature around 3 K with microwave power higher than 5 mW. Thus Hirst’s group could not detect N5 signals under any of their EPR conditions, reported in their PNAS paper. It seems that they misassigned the signals from cluster N4 to N5. As to the claim of “misassignment” between clusters N4 and N6b, that was not a possibility because our mutagenesis systems did not contain cluster N6b. Therefore, we believe that we have not made any “misassignment” in our work.
Keywords: Complex I, Iron, sulfur cluster, EPR, Site-directed mutagenesis, NADH-Q oxidoreductase
1. Introduction
NADH-quinone oxidoreductase (complex I) is the largest and most complicated energy transducing enzyme complex in both bacterial and mitochondrial aerobic respiratory chains [1–3]. It is located at the entry point of the electron transfer from NADH and it catalyzes the following reaction:
where Q indicates ubiquinone or its homologues. The X-ray structure of the peripheral arm (hydrophilic extra-membrane domain) of Thermus thermophilus complex I was determined at 3.3 Å resolution by Sazanov and Hinchliffe [4,5].
As shown in Fig. 1, these authors revealed the presence of a beautiful long chain of redox-active components composed of one non-covalently bound FMN and 7 iron–sulfur (Fe/S) clusters (NADH–FMN-N3-N1b-N4-N5-N6a-N6b-N2–Q) as a main electron transfer pathway in complex I. Sazanov’s group also assigned that cluster N5 has unique (1His+3Cys)-ligands and N4 has regular (4Cys)-ligands. (To avoid confusion, we used current consensus name (as nickname) throughout this paper. Only when the accuracy of the nomenclature is required for clarity, the nickname is followed by a structure–subunit–ligand indicating nomenclature proposed by Hirst’s group, as shown in Table 1). Cluster N1a was proposed to playa unique role based on the following three reasons: (i) Cluster N1a has a very low midpoint redox potential (Em7.0 = −370 mV) [2], except E. coli N1a. (ii) Its edge-to-edge distance to FMN is 12.3 Å. (iii) Its distance to the closest Fe/S cluster N3 is 19.4 Å [4] (see Fig. 1). The cluster N7 was not included in the main electron transfer chain, because of the following two reasons: (i) N7 is not conserved, existing only in a limited number of bacteria (including E. coli and T. thermophilus). (ii) N7 is quite away from the respiratory chain; the closest Fe/S cluster is at the distance of 20.1 Å [4].
Fig. 1.
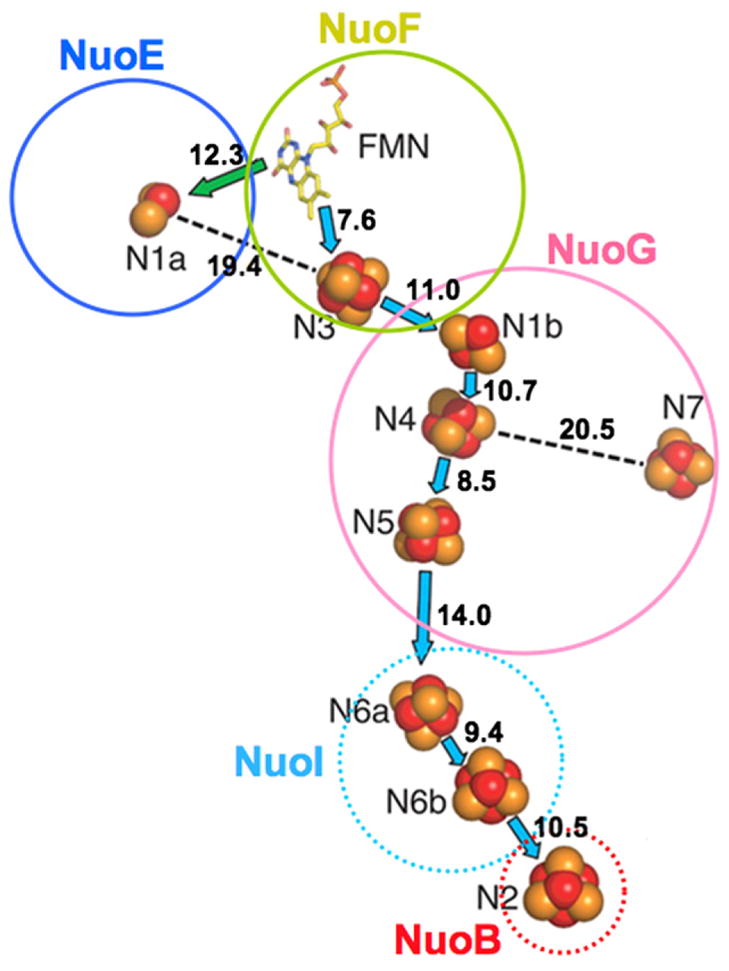
Arrangement of redox centers in the hydrophilic domain of T. thermophilus complex I reported in [4] with minor modifications. These authors used consensus nomenclature, which is based on EPR spectroscopy [2] and recent site-directed mutagenesis studies [8]. Cluster N1a is in subunit NuoE; cluster N3 and FMN in NuoF; clusters N1b, N4, N5, and N7 in NuoG; clusters N6a and N6b in NuoI; cluster N2 in NuoB in E. coli complex I. The edge-to-edge distances between the redox centers are given in Å. Subunits circled by the solid line reside in the NADH dehydrogenase fragment, and subunits circled by the dotted line are located in the connecting fragment of the E. coli complex I.
Table 1.
The iron–sulfur clusters in complex I and their EPR signals
| Subunit | Fe/S cluster | Nomenclature |
Spectral g values |
||
|---|---|---|---|---|---|
| Nickname | Defined namea | E. coli complex I | Bovine heart complex I | ||
| NuoE/Nqo2 | [2Fe–2S] | N1a | 2Fe[E] | 2.00, 1.95, 1.92 |
2.02, 1.94, 1.92b ↓ (2.00, 1.95, 1.92)c |
| NuoF/Nqo1 | [4Fe–4S] | N3 | 4Fe[F] | 2.04, 1.92, 1.88 | 2.04, 1.93, 1.86–1.87 |
| NuoG/Nqo3 | [2Fe–2S] | N1b | 2Fe[G] | 2.02, 1.94, 1.94 | 2.02, 1.94, 1.92 |
| [4Fe–4S] | N4 | 4Fe[G]C |
2.09, 1.93, 1.89 ↓ (2.07, 1.93, 1.88)d |
2.10, 1.94, 1.89 | |
| [4Fe–4S]e | N5 | 4Fe[G]H | Not detectedf | 2.07, ~1.93, 1.90 | |
| [4Fe–4S] | N7 | 4Fe[G]* | 2.05, ~1.94, 1.91 | Not present | |
| NuoI/Nqo9 | [4Fe–4S] | N6a | 4Fe[I]1 | ? | ? |
| [4Fe–4S] | N6b | 4Fe[I]2 | 2.09, 1.94, 1.89 (?) | ? | |
| NuoB/Nqo6 | [4Fe–4S] | N2 | 4Fe[B] | 2.05, 1.91, 1.91 | 2.05, 1.92, 1.92 |
We use consensus name as a nickname of Fe/S cluster, and nomenclature proposed by Hirst’s group listed as defined name.
Somewhat undefined (Em8.0 < −500 mV) at extreme low Eh.
Fp subcomplex.
NuoCDEFG subcomplex, or NuoG subunit.
Coordinated by 1His3Cys ligands, all other clusters are 4Cys ligands.
Most recently, gx =1.90 of cluster N5 was detected with 5 mW and around 3 K in E. coli NuoCDEFG subcomplex.
4Fe[G]* signifies that this is a non-conserved form of [4Fe(G)C].
EPR spectroscopy has been the most informative technique for the study of multiple Fe/S clusters in complex I. The X-ray structure study confirmed the presence of a total of 9 different Fe/S clusters in T. thermophilus complex I, which was predicted by EPR studies [2,6–8]. In addition, EPR analysis provided useful information on the spin–spin interactions between neighboring redox centers, allowing the calculation of their distances, for example, 12 Å between cluster N2 and protein-bound Q [9,10].
However, both sensitivity and spectral resolution of the EPR technique are generally much lower than those of spectrophotometric techniques. In addition, as shown in Table 1, EPR spectral properties of Fe/S clusters, such as the principal g values, line widths, and the spin relaxation rates can be very sensitive to the microenvironment around the Fe/S cluster, especially in a delicate multi-component membrane protein like complex I. EPR identification of an Fe/S cluster residing in the overexpressed single subunit could be misleading, because its EPR signals may be altered from that in the intact complex I system. In an overexpressed system, a complex I subunit is not immersed in its natural environment. Table 1 also suggests that there is still a possibility of finding more iron–sulfur clusters which have not yet been characterized.
Recently Hirst’s group addressed this delicate and difficult problem [11]. Using the E. coli system, they reevaluated the assignments of Fe/S clusters by comparing the EPR spectra observed both in the over-expressed single NuoG subunit and in the intact complex I. They came to the conclusion that EPR spectra of structurally defined clusters N6b and N4 were misassigned to the currently accepted clusters N4 and N5, respectively. They also proposed that cluster N5 has regular (4Cys)-ligands, and that N4 is localized in NuoI subunit.
Since there are 8 or 9 Fe/S clusters in complex I, and since the nomenclature of their subunits is different in different species, the complex I field is very confusing. In order to help in understanding the points raised by Hirst’s group, we summarized in Table 1 the subunit location, the cluster types ([2Fe–2S] or [4Fe–4S]), the nomenclature of the individual iron–sulfur clusters by nicknames (assigned by EPR) and structure–ligand-indicating formulas proposed by Hirst’s group together with their principal g values measured in both intact E. coli and bovine heart complex I. For simplicity, we provided the gz,y,x values only to the second decimal point. In the bovine heart complex I, gz,y,x values of 6 EPR detectable Fe/S clusters (N1a, N3, N1b, N4, N5 and N2) can easily be discriminated from each other based on their gz and gx values [12]. Two other clusters (N6a and N6b) have been so far undetectable or non-resolvable in the bovine heart complex I.
Both clusters N4 and N6b have similar gz,y,x =(2.09,1.94,1.89) values in E. coli complex I, although “spectral line shapes” seem to be somewhat different. Thus, it is difficult to distinguish them based only on their EPR parameters. Therefore, in this paper, we will first focus on the controversy concerning the Fe/S clusters in the largest subunit, NuoG, and come back later to the topics of N6a/b, which reside in NuoI. Subunit NuoG contains 3 or 4 distinct Fe/S clusters, N1b, N4, N5, with or without N7. Cluster N1b is a binuclear Fe/S center and can be readily assigned based on very slow spin relaxation. It is detectable at a much higher temperature than that used for tetranuclear Fe/S clusters. It has a typical [2Fe–2S]-type EPR spectrum with an axial symmetry (g//, ⊥ = 2.03, 1.94) [13]. Cluster N7 is not conserved in the whole complex I family. Therefore, the two remaining [4Fe–4S] clusters N4 and N5 are the clusters involving in the suggestion of “misassignment”.
Using knockout mutations (all ligand residues in each of four Fe/S clusters were simultaneously replaced by Ala), we examined individual clusters N1b, N4, N5, and N7 in the MBP (maltose-binding protein)-fused E. coli NuoG subunit. It was found that cluster N4 was localized in the NuoG subunit. In this experiment, there was no involvement of the NuoI subunit. Therefore, there was no possibility that we misassigned N6b for N4 [8]. We will summarize our most recent work [12] which is the extended site-directed mutagenesis study of the His-ligand of cluster N5 in E. coli NuoCDEFG subcomplex. This work confirmed our previous proposal that cluster N5 has the His-containing mixed-ligand structure.
2. Results and discussion
2.1. The cluster N4 is localized in the NuoG subunit and is ligated by 4Cys residues
2.1.1. From a historical point of view
As seen in Table 1, the principal g values of cluster N4 in the E. coli complex I are gz,y,x =2.09, ~1.93, 1.89 [11,13], which are similar to the gz,y,x =2.10, ~1.94, 1.89 of cluster N4 in the bovine heart complex I [2]. The g values of cluster N5 in the bovine heart complex I are gz,y,x = 2.07, ~1.93, 1.90 [2]. In E. coli complex I, N5 signals were unknown until we detected them very recently as described in the following section 2.2.
However, Ohnishi et al. reported the g values of cluster N4 as gz,y,x = 2.07, 1.95, 1.88–1.89, in various overexpressed NuoG subunits [6–8], and more recently similar g values were reported by Hirst’s group in the E. coli singly overexpressed NuoG subunit [11]. Ohnishi et al. interpreted these shifted g values as reflecting some modification due to a different environment around cluster N4 in the artificially overexpressed system [2]. On the other hand, these gz,y,x values were similar to the g values of cluster N5 in the bovine heart [2], andYarrowia lipolytica complex I [14,15]. Therefore, simply based on the comparison of the g values, Hirst’s group claimed that in the previous EPR analyses Ohnishi’s group “misassigned” N5 signals to N4 in the overexpressed NuoG system. However, as we will explain below, the EPR signals of cluster N4 are especially sensitive to the alteration of the protein environment around cluster N4.
Additionally, in E. coli complex I, the N6b signals with gz,y,x =2.09, 1.94, 1.89 [16] are very close to those for N4 signals (gz,y,x =2.09, 1.93, 1.89) [11]. Hirst’s group also claimed that Ohnishi et al. “misassigned” cluster N6b to N4. If EPR spectral parameters are fixed and can never be altered at any level of structural organization, their interpretation might be correct. However, biological systems are often neither clear-cut nor simple. According to early observations made by Ohnishi et al., the cluster N4 was found to be extremely sensitive even to a minor alteration of the cluster’s microenvironment in complex I [17,18]. We will summarize earlier published relevant observations which indicated that the N4 signals can be easily altered.
When SMP (submitochondrial particles) were prepared from pigeon heart mitochondria (even by a mild pressure–rupture method), the midpoint redox potential (Em) of cluster N4 was shifted by −160 mV (from −250 mV to −410 mV) [17]. However, Em values of all other clusters remained unchanged: ~−380 mV for N1a, ~−250 mV, iso-potential for clusters (N1b, N3, N4, N5), and ~−20 mV for cluster N2. These data suggest that cluster N4 is localized in a protein environment, which is much more sensitive to exposure to the hydrophilic milieu than all other clusters.
When Neurospora crassa cells were grown in the presence of chloramphenicol, a small complex I was synthesized which contains only clusters N1, N3, and N4 in contrast to the large form of complex I, which contains N2 in addition to these 3 Fe/S clusters [18]. Although both clusters N1 and N3 retained their original EPR properties, the N4 spectrum was greatly broadened, seen as the line width change from (Lz,y,x =10.5, 7.6, 12.3) in the large form to (Lz,y,x =17.0, 8.3, 20.0) in the small form. All other properties such as Em and the principal g values were unchanged for all other iron–sulfur clusters. This again indicates that cluster N4, unlike all other clusters, is especially sensitive to the alteration of the cluster’s microenvironment.
We should also point out that, as shown in the top right corner of Table 1, we always observed the gz signals of the cluster N1a in the bovine heart mitochondria, SMP, and isolated complex I as gz =2.02–2.03 [19] similar to many other binuclear clusters [20] with an exception of E. coli N1a [13,21]. The gz =2.00 signals were observed only in the isolated bovine heart Fp subfraction containing NuoEF and 9 kDa subunits [22] and in overexpressed NuoE homologues [23,24].
As shown above, cluster N4 is especially sensitive to alteration of the protein environment around the cluster while other clusters are not. The NuoG subunit, which is singly overexpressed in the E. coli cytoplasm, was expressed in the absence of neighboring subunits of complex I. Therefore, it is in a quite different environment than within the native complex I. This is also seen as a considerable lowering (by 100–200 mV) of the Em values of both the [2Fe–2S] N1b and the [4Fe–4S] N4 clusters in the artificially overexpressed system [25]. In this environment, the gz value of cluster N4 could be shifted from 2.09–2.10 to 2.06–2.07.
Since the shifted value (gz =2.07) coincides with that of the bovine heart cluster N5, Hirst’s group thought that the gz =2.07 signal must be arisen from cluster N5, but not from N4 (see their Fig. 5 in [11] which was measured at 12 K).
2.1.2. From our recent experiments
Now we will present more direct experimental data obtained from the site-directed mutagenesis of candidate ligand residues of cluster N4. We determined specific effects of such a mutation on the electron transfer activity and EPR spectral profiles of cluster N4. Our relevant experimental data are presented in Fig. 2.
Fig. 2.

(A) Comparison of EPR spectra between wild-type and mutants of the reconstituted MBP-NuoG subunit at 6 K in the presence of 10 mM sodium dithionite, 5 μM of benzyl viologen and methyl viologen. (B) EPR spectra of the reconstituted MBP-NuoGΔN4 and MBP-NuoGΔN5 were recorded at 4 K with different microwave power at 100 mW (thick line) and 4 mW (thin line), and 0.25 mW (dotted line). The signals were normalized to 1 mg/ml of protein concentration. The spectra were recorded under the following conditions: microwave frequency, 9.44 GHz; microwave power, 5 mW; modulation amplitude, 10.115 G; modulation frequency, 100 kHz; time constant, 164 ms. Principal g values were indicated. Mutant subunits, designated ΔN4 and ΔN5 (in which each set of the iron–sulfur binding motifs for cluster N4 and N5 in the E. coli NuoG subunit were individually inactivated by the substitution of all four ligands with Ala), were expressed as maltose-binding protein fusion proteins and were purified [8]. After in vitro reconstitution, wild-type and mutant subunits were characterized by EPR.
In order to examine the identity of the iron–sulfur cluster N7, Nakamaru-Ogiso constructed knockout mutants (of each cluster, namely, ΔN1b, ΔN5, ΔN4, and ΔN7, utilizing the overexpressed E. coli MBP-NuoG subunit system, as reported in [8]. The MBP-fused expression system has been known to work for the overexpression of membrane/hydrophobic proteins that easily aggregate in the cytosol. We did not detect N1b signals in any of preparations including MBP-NuoG (wild-type). Since MBP is a relatively large molecule relative to the NuoG subunit, and the sequence motif for cluster N1b is located very close to the N-terminal. Perhaps, the polypeptide chain around cluster N1b could not properly fold for the insertion of the cluster N1b. Therefore, the lack of N1b signals was not caused by the mutagenesis effect. The authors described this effect in their paper. There are two [2Fe–2S] clusters in complex I. The identification of cluster N1b was already pretty established based on studies of N1a[19,21–24] as well as of N1b [25,26]. Thus there was no need for identifying an N1b signal here again. Therefore, we used this mutant system for identifying cluster N4 and N7 signals.
Cluster N7 is not conserved in the whole complex I family, and this cluster was reported to be necessary for the stability of complex I [7,27]. As expected, the N7 knockout mutant (abbreviated as ΔN7) showed generally very low intensity EPR signals. Therefore, in Fig. 2A, we selectively showed EPR signals only for the control, N4 and N5 knockout mutants, abbreviated as ΔN4 and ΔN5, respectively, (where all four ligand residues of individual clusters were simultaneously replaced by Ala) were recorded at 6 K and 5 mW microwave power.
For the top spectrum of wild-type, N7 (gz,x =2.05,1.91) and N4 (gz,x = 2.07,1.88) signals were observed, while N5 signals were not under this EPR condition. In the N4 knockout mutant (middle), cluster N4 is not present, thus only N7 signals were observed. In the N5 knockout mutant (bottom), both N7 and N4 signals were observed similar to the situation in the wild-type strain. In order to intensify N4 signals, sample temperature was further lowered (4 K) and microwave power was increased to 100 mW (Fig. 2B), The N4 signals were greatly enhanced in the ΔN5 mutant, but it was not seen at all in the ΔN4 mutant. These clear observations strongly indicated that cluster N4 is 4Cys-coordinated [4Fe–4S] cluster (seen as the third Fe/S sequence motif), localized in the NuoG subunit. We do not need to look for cluster N4 signals outside of the NuoG subunit. This conclusion cannot be reached by simply comparing the “gz,y,x =2.07,1.93,1.88” spectrum of cluster N4 observed in the expressed E. coli NuoG subunit with that of cluster N5 signals in the bovine heart complex I.
2.2. The cluster N5 is ligated by (1His+3Cys); it has never been misassigned
2.2.1. From a historical point of view
The EPR signals of the cluster N5 was discovered below 7 K in the pigeon heart mitochondria in 1975 [17]. But the existence of this cluster was not generally accepted for a long time as an intrinsic component of complex I, because its total spin concentration was found to be only 0.25/complex I, although all other iron–sulfur clusters were stoichiometric. At that time, there was a long standing puzzle with a tetranuclear iron–sulfur protein of the Azotobacter vinelandii nitrogenase (originally it was called Fe protein), which showed a regular “g=1.94” type [4Fe–4S] iron–sulfur spectrum, but only 0.3 spin/cluster was detected [28]. From the Mössbauer analysis, these authors reported that this [4Fe–4S] cluster had a mixed S=1/2 and S=3/2 spin ground states. For the detection of the S=3/2 state EPR spectrum in the g~5 region, a much higher enzyme concentration was required than that used for EPR analysis of the S=1/2 spin state. The Fe- only hydrogenase, which is evolutionally closely related to the N-terminal domain of the NuoG subunit of complex I, contains a mixed-ligand (1His+3Cys) [4Fe–4S] cluster whose high resolution X-ray structure is available [29]. Therefore, Ohnishi’s group had pursued the identification of the ligand structure of the cluster N5 [6]. As already described in the Introduction, N5 spin has a very short relaxation time, requiring an extremely low temperature for its EPR detection. Thus, N5 signals were detected only in a limited number of complex I species, and it was characterized only in the bovine heart [2], and Y. lipolytica complex I [14]. In the latter study, the presence of a substoichiometric cluster N5 was also reported.
2.2.2. From our recent experiments
In the most recent study [12], we attempted to identify cluster N5 in the E. coli complex I, where EPR spectrum of N5 has not been detected to date in any laboratory. By introducing site-specific mutations in the chromosomal DNA, Nakamaru-Ogiso constructed the most extended series of mutant strains of the candidate ligand, His 101 of the NuoG subunit; two single mutants (H101C, H101A), one double mutant (H101A/C114A), and the N5 knockout mutant (ΔN5). These genomic mutations considerably affected the stability of complex I, and the NADH dehydrogenase subcomplex (NuoEFG subcomplex) was dissociated from the membrane. However, she successfully obtained these mutant NuoCDEFG subcomplexes, by affinity chromatography with attached His-tag on NuoCD subunit. Fortunately, in these subcomplexes we have no NuoI and NuoB subunits. Therefore, we have no N6a, N6b and N2 clusters in our mutants or in the control subcomplexes. We deliberately selected the W221A mutant strain as a control, because this mutant contains wild-type iron–sulfur clusters, and dissociates from the membrane similar to all mutant complex I subfractions.
All of the partially purified N5 mutant subcomplexes have similar levels of NuoCDEFG subunits based on the protein concentration. We should point out that the EPR spectra of N1b measured by Hirst’s group underwent a considerable spectral alteration from a normal Gaussian-type (a typical EPR signal shape observed in intact complex I; seen in Fig. 4 in [11]) to a Lorentzian-type spectrum (a broad, widely spread spectral shape); seen in the top spectrum in Fig. 2 in [11]). But our subcomplex retained Gaussian-type N1a plus N1b spectrum (Fig. 3A in this paper) much closer to that shown in Fig. 4 in [11], indicating that the integrity of the iron–sulfur clusters in NuoCDEFG subcomplex is considerably better than that in singly overexpressed NuoG subunit [11].
Fig. 3.

EPR spectra of the E. coli NuoCDEFG subcomplex from various cluster N5 mutant strains, W221A (a), H101C (b), H101A (c) and cluster N5 knockout (ΔN5) (d), measured at 40 K (A), 6 K (B), and 3 K (C). Each sample was reduced with 10 mM sodium dithionite in the presence of 5 μM of benzyl viologen and methyl viologen. The signals were normalized to 1 mg/ml protein concentration. EPR spectra were recorded under the following conditions: microwave frequency, 9.45 GHz; microwave power, 5 mW; modulation amplitude, 8.0 G; time constant, 82 ms. Principal g values were indicated. The cluster N5 mutant strains were obtained by introducing point mutation(s) into the genomic DNA with homologous recombination. These genomic mutations drastically affected the stability of complex I, and consequently, NADH dehydrogenase subcomplex (NuoEFG subcomplex) were dissociated from the membrane. However, we successfully obtained these mutant NuoCDEFG subcomplexes by the overexpression of the His-tagged-NuoCD subunit. We deliberately employed the W221A mutant strain as a control to obtain the NuoCDEFG subcomplex carrying wild-type clusters.
Fig. 3A presents EPR spectra of the binuclear iron–sulfur clusters (cluster N1a and N1b) in the control W221A and three N5 mutant systems at 40 K and 5 mW. For double mutant data, see [12]. The relative content of clusters N1a and N1b can be selectively estimated by the peak heights of the well resolved gz = 2.00 and 2.03, respectively. Cluster N1a in all of our N5 mutant subcomplexes had almost the same EPR signal amplitude as in the control W221A mutant (as we expect since cluster N1a is located in the NuoE subunit, while cluster N1b is within the N5-containing NuoG subunit). The N1b content varied considerably among mutants suggesting that the EPR signals of N1b are also sensitive to its microenvironment. However, the important point here is that all mutants contained cluster N1b.
At 6 K and a microwave power of 5 mW (Fig. 3B), EPR signals from 3 [4Fe–4S] clusters (N4, N7 in NuoG and N3 in the NuoF subunit) are expected to be seen, although gz of N3 is very difficult to detect, because of the spectral overlap from other clusters. NuoCDEFG subcomplex does not contain clusters N6a/b in NuoI and N2 in NuoB subunit as seen in Fig. 1. EPR signals from cluster N5, which we were able to detect in our control subcomplex (around 3 K, >5 mW), cannot be detected under the EPR condition which Hirst’s group used (5–40 K, 0.1 mW) because of its extremely fast spin relaxation. Therefore, gz signals, for example, 2.07, 2.05 and 2.02, arise mostly from cluster N4, N7, N3 and N1b. (the gz signal of cluster N3 is hidden between N7 and N1b). Binuclear cluster N1b signals can be detected even at this low temperature, most likely due to the cross-relaxation with nearby tetranuclear clusters, N4 and N3. In Fig. 3B, the protein concentration of each sample is the same. Although the gz signal of N4 is small, it is detected in all mutants if we amplify the gain (see [12]).
Fig. 3C presents EPR spectra of N5 mutants recorded around 3 K and 5 mW. In E. coli complex I, N5 spins seem to have a much faster spin relaxation rate than in complex I from other sources, such as the bovine heart (7 K, 5 mW) [2], Y. lipolytica (5 K, 100 mW, [14]), and P. denitrificans complex I (5 K, 20 mW, [6]). In E. coli complex I, we found that the N5 signals became EPR detectable only around 3 K and >5 mW [12].
In Fig. 3C (spectrum a), the gx =1.90 signal of the cluster N5 signal was clearly detected in the control W221A mutant, but not in any of the cluster N5 mutant subcomplexes. It should be pointed out that N4 signal in H101C and H101A at gx =1.88 is not detected in Fig. 3C (spectra b and c), most likely due to power saturation around 3 K, because in the absence of fast relaxing nearby N5 spins, the spin relaxation of cluster N4 would be slowed down. The spin relaxation profile of N4 in a wide temperature range indicated considerable cross-relaxation phenomena between N5 and N4 spins [12]. This is based upon the facts that these two clusters are separated by an 8.5 Å edge-to-edge distance which is within the magnetically interacting distance [4] (Fig. 1), and that they belong to the iso-potential group. Thus, in the wild-type subunit, both clusters N4 and N5 would be reduced almost simultaneously, and the relaxation of N4 spins is always enhanced by N5 spins. In the N5-deficfient mutants, the spin relaxation of N4 spins are slower, thus readily saturated at very low temperature as 3 K, and the signals disappeared at this low temperature. However, the gz signals of cluster N4 were seen in a higher temperature range, as 6 K (Figs. 3Bb and c). These experimental data strongly support the notion that cluster N5 has a mixed (1His and 3Cys) ligand, and it was not “misassigned”, contrary to the conclusion reached by Hirst’s group.
In our NuoCDEFG subcomplex system, the goal of a mutagenesis study is to obtain qualitative information, such as “whether a cluster exists or not”.
In this system, we did not need to conduct any chemical reconstitution. We detected EPR signals arising from all of the clusters N1a, N1b, N3, N4, and N7 in the NuoCDEFG subcomplexes, although the content ratios of these clusters varied considerably (Fig. 3B). However, we have to emphasize that no N5 signals were detected in any of these mutants as documented in Fig. 3C.
Similar to our N5 mutant data on both E. coli and P. denitrificans complex I [7,8], Waletko et al. reported that the H129A (equivalent to H101A mutant of E. coli) mutation of Y. lipolytica caused complex I destabilization and almost complete destruction of NADH-DBQ reductase activity [15]. However, Waletko et al. reported that EPR spectra of not only N5, but also spectra from all other clusters (N1, N2, N3 and N4) had no alterations at all [15]. Although this information was used by Hirst’s group as one of the strong arguments for their “misassignment” claims for cluster N4 and N5, these data are hard to rationalize. We would like to point out that Waletko et al. reported d-NADH-HAR and d-NADH-DBQ activities using only mitochondrial membranes, while they performed actual EPR measurements for iron–sulfur clusters using isolated complex I.
2.3. Clusters N6a and N6b
2.3.1. From a historical point of view
In 1999, Ohnishi et al. succeeded in the first EPR demonstration of the presence of two [4Fe–4S] clusters in the overexpressed P. denitrificans Nqo9 (= E. coli NuoI) [30].
As presented in Fig. 4 spectrum A, multiple peaks were observed at g=2.08, 2.05, 1.92, 1.89 (at 14 K and 10 mW), suggesting the presence of at least 2 iron–sulfur clusters in the Nqo9 subunit. An outside-pair of gz,x =2.08 and 1.89 showed much faster spin relaxation (P1/2 =342 mW) than the inside-pair of gz,x =2.05 and 1.92 signals (P1/2 =8 mW) at 14 K. Ohnishi’s group suggested the following two possibilities: (i) these two sets of EPR signals arise from 2 distinct species of [4Fe–4S] clusters with two intrinsically different spectral parameters. One is a slow relaxing gz,x =2.05, 1.92 species, and the other a fast relaxing gz,x =2.08, ~1.89, or (ii) two clusters having similar intrinsic EPR spectra gz,x =2.05, ~1.92 with a slow spin relaxation when only one of N6a/b is reduced in the single NuoI subunit. When both clusters in the same subunit are simultaneously reduced, their spin–spin interaction causes a shift of spectra to gz,x =2.08, ~1.89, with enhanced spin relaxation. These two possibilities remain to be examined.
Fig. 4.
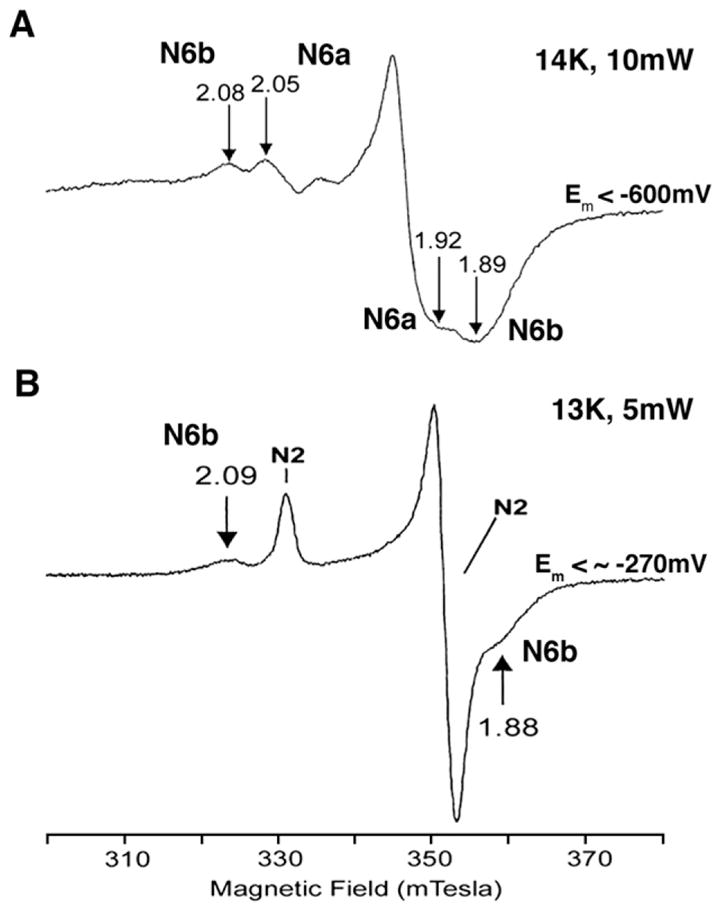
EPR spectra of cluster N6a and N6b of the overexpressed, truncated P. denitrificans Nqo9 (NuoI) subunit (A), which contains only clusters N6a and N6b, cited from [30], and the resolved connecting fragment (composed of Nuo B, C–D, I) of the E. coli complex I (B), which contains clusters N2, N6a, and N6b, cited from [31].
In 2001, EPR signals from the connecting fragment of the E. coli complex I (which consists of NuoCDIB subunits) were shown in Fig. 4 spectrum B [31]. In this case, cluster N2 signals overlapped with above described inside-pair signals as shown in Fig. 4 spectrum A. It should be emphasized that both of these systems do not contain cluster N4. Results reported in these earlier publications are consistent with most recently proposed broad axial-type N6b spectrum (gz,y,x =2.09, ~1.91, 1.89) [16].
The primary sequence of E. coli NuoI displays a marked similarity with the stereotypical motif of the primitive ferredoxin of anaerobic bacteria. Fig. 5 shows the position of 8 highly conserved cysteine residues (E. coli sequence numbers are used; (C60, C63, C66, C70) – (C99, C102, C105, C109)) and their role as ligand residues of the 2 cubane tetranuclear clusters. The 4th cysteine of the first cysteine stereotypical motif (corresponding to C70) participates in the binding to the 2nd Fe/S cubane with 3 remote cysteines, and vice versa (C109 binds the 2nd cubane Fe/S with remote C60, C63, C66), by cross bridging two cubanes, and greatly contributes to the overall protein structure.
Fig. 5.
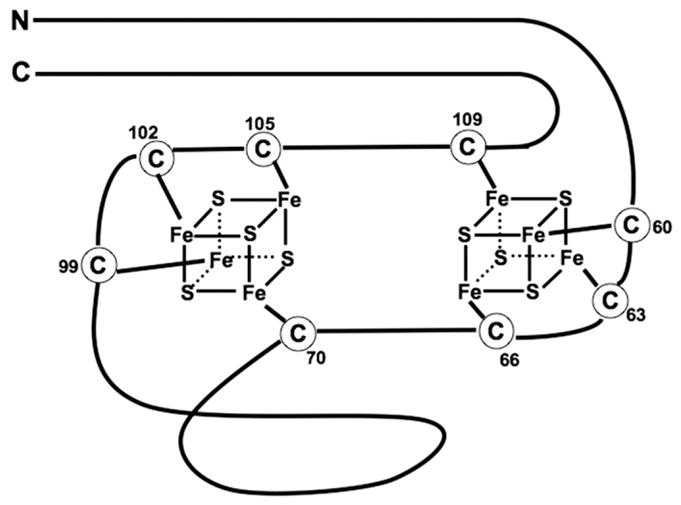
Schematic structure of two Fe/S clusters in the NuoI subunit. The numbering is in accordance with the E. coli sequences. The alignment of eight highly conserved cysteine residues is similar to that of 2×[4Fe–4S] bacterial ferredoxin [32].
Dupuis et al. reported that the C70S mutant was nearly completely depleted of major peripheral subunits, accompanied by the concomitant disappearance of two clusters (N6a and N6b) in complex I. In the cases of C63S [32] and C102S [27] mutants, the complex I activity and all EPR active Fe/S clusters, including cluster N4, remained.
Recently, Rasmussen et al. reported that 8 iron ferredoxin-type clusters (such as an E. coli connecting fragment, a peripheral arm of the N. crassa complex I, its whole complex I and Ech hydrogenase carrying two tetranuclear motifs) have unique UV-visible spectra with a negative peaks around 320 and 425 nm [31]. However, we never find such an optical absorption in a NuoG subunit. These observations indicate that two iron–sulfur clusters N6a and N6b will function together.
Individual [4Fe–4S] clusters of 8-Fe ferredoxin from Clostridium pasteurianum exhibit a simple spinach ferredoxin-type EPR spectrum, but when both clusters are simultaneously reduced, at low temperature it exhibits much more complicated spectrum caused by strong spin–spin interactions [33]. The gz peak is replaced by two satellite peaks centered approximately at this gz position when the spectrum was recorded by Q-band (35 GHz) EPR spectroscopy. However, in this ferredoxin, Em values of two clusters did not show any redox interactions [34]. We still do not know whether clusters N6a/b in the NuoI subunit behave like 8-Fe ferredoxin or not. Although the g values of both clusters N4 and N6a/b in complex I are almost identical, cluster N4 resides in the NuoG subunit and clusters N6a/b are located in the NuoI subunit. As we explained earlier, we used a NuoCDEFG sub-complex in which the NuoI subunit is not present. Hirst’s group thought that we “misassigned” cluster N6b spectrum as that of cluster N4. They assumed that N4 would be in the NuoI because spectra of both N4 and N6b are almost the same. However, our CDEFG subcomplex does not contain the NuoI subunit, and yet, our subcomplex revealed N4 signals. Therefore, we could not have misassigned N6b as N4. Clusters N6a/b are likely to function together as 8-Fe ferredoxin (Fig. 5).
A broad axial-type spectrum (gz,y,x =2.09, 1.91, 1.89) was proposed to arise from the cluster N6b based on the R274A mutant study of E. coli NuoCD subunit [16]. However, it is still not known whether this EPR spectrum arises from only one or both clusters N6a and N6b in the NuoI subunit.
We still have very limited information about clusters N6a and N6b at this moment. Since the g values of cluster N4 and N6b in the whole complex I are very similar, discrimination between these two clusters is difficult if one uses only EPR techniques. We have to incorporate new information obtained by independent spectroscopic methods, such as optical measurements [31], multi-frequency EPR, REFINE (Relaxation Filtered Hyperfine Spectroscopy) technique [35,36], IR [37] or Resonance Raman spectroscopy [36] and protein-film voltammetry [23]. We may not be able to apply these techniques directly to whole complex I. We may have to use a complex I subfraction containing normal and/or a mutant system. These studies will be very important and helpful for the deeper understanding of currently available complex I data, and for the future progress of the complex I research field.
3. Conclusions
By analyzing all of our EPR data on cluster N4 [4Fe(G)C], and by performing experiments using E. coli N5 [4Fe(G)H] mutants, we came to the conclusion that there were no “misassignments” of Fe/S clusters in our previous studies. We would like to point out that (i) Hirst’s group overlooked the fact that the signal shape and g values of cluster N4 are particularly sensitive to the changes of the environment around N4; (ii) these authors assumed that the E. coli cluster N4 signals arose from cluster N5. However, since the cluster N5 signals of E. coli cannot be detected under any of their EPR conditions (0.1 mWand 5–40 K, used in their PNAS paper), these signals do not belong to E. coli cluster N5; and (iii) they based their arguments only on EPR spectral profiles. They should have taken all possible information, including that from site-directed mutagenesis studies of bacterial complex I, into consideration.
Addendum
So far we discussed only E. coli complex I in the bacterial system. Recently interesting EPR studies of the complex I from two different thermophilic Gram negative bacteria, namely, Thermus thermophilus HB8 [39] and Rhodothermus marinus cells [40] were reported. The former complex I was purified to the crystalline form, and the EPR properties of its Fe/S clusters were found to be the same as those present in the membrane in situ and in partially purified enzyme [41,42]. At least two binuclear (similar to cluster N1a and N1b) and 3 tetranuclear clusters (temporarily assigned to Fe/S clusters N2, N3, and N4 counterparts based on the spin relaxation rate and gz values relative to those in the bovine heart complex I. However, this cross-assignment may not generally be applicable.). EPR spectra are very hard to resolve in this bacterial case because of the spectral overlap. All Fe/S clusters have Em values lower than −270 mV, with no N2-type high potential cluster. It may be related to the fact that a low potential menaquinone (Em7.0 = −75 mV) rather than higher potential ubiquinone (Em7.0 =+90 mV) is involved as the final electron acceptor in this bacterial complex I. Since X-ray crystallographic structure is known only on the hydrophilic part of this complex I to date, further detailed characterization of individual Fe/S clusters may contribute to a better understanding of the electron and proton transfer mechanism in the first energy coupling site of the respiratory chain.
The latter Rhodothermus marinus complex I also contains at least two EPR detectable binuclear and four tetranuclear Fe/S clusters. EPR profile of iron–sulfur clusters of this thermophile complex I is more analogous to the counterparts of bovine heart C.I. than the T. thermophilus case. Different Fe/S clusters were cross-assigned also by the relative spin relaxation rate and gz values, and designated the cluster’s name. The N2 equivalent cluster is lowest Em (−450 mV) component, while all other clusters have Em of −240 mV. N7 cluster is absent in this complex I. Both of these thermophilic complex I species are more robust than all other complex I species so far studied, thus may remain as useful material for the future structure/function study of complex I.
Acknowledgments
We are extremely grateful to Dr. Judy Hirst and her colleagues for their courageous challenge to many ambiguous and unsolved questions concerning our previous EPR identification of clusters N4, N5 and N6b. Their challenge gave us a great opportunity to reexamine our over three decades of work. We reflect on ourselves that we have not emphasized frequently enough about the instability of cluster N4 in our previous publications. The authors thank Drs. Takao and Akemi Yagi who supported our mutagenesis study. We also thank Drs. Shinya Yoshikawa and Kyoko Shinzawa-Itoh at the Hyogo University, Japan for providing us highly purified bovine heart complex I, and Dr. S. Tsuyoshi Ohnishi for his stimulating discussions. This work was supported in part by the NIH grants GM030736 to T.O.
References
- 1.Walker JE. The NADH:ubiquinone oxidoreductase (complex I) of respiratory chains. Q Rev Biophys. 1992;25:253–324. doi: 10.1017/s003358350000425x. [DOI] [PubMed] [Google Scholar]
- 2.Ohnishi T. Iron–sulfur clusters/semiquinones in Complex I. Biochim Biophys Acta. 1998;1364:186–206. doi: 10.1016/s0005-2728(98)00027-9. [DOI] [PubMed] [Google Scholar]
- 3.Yagi T, Matsuno-Yagi A. The proton-translocating NADH-quinone oxidoreductase in the respiratory chain: the secret unlocked. Biochemistry. 2003;42:2266–2274. doi: 10.1021/bi027158b. [DOI] [PubMed] [Google Scholar]
- 4.Sazanov LA, Hinchliffe P. Structure of the hydrophilic domain of respiratory complex I from Thernus thermophilus. Science. 2006;311:1430–1436. doi: 10.1126/science.1123809. [DOI] [PubMed] [Google Scholar]
- 5.Sazanov LA. Respiratory complex I: mechanistic and structural insights provided by the crystal structure of the hydrophilic domain. Biochemistry. 2007;46:2275–2288. doi: 10.1021/bi602508x. [DOI] [PubMed] [Google Scholar]
- 6.Yano T, Sklar J, Nakamaru-Ogiso E, Takahashi Y, Yagi T, Ohnishi T. Characterization of cluster N5 as a fast-relaxing [4Fe–4S] cluster in the Nqo3 subunit of the proton-translocating NADH-ubiquinone oxidoreductase from Paracoccus denitrificans. J Biol Chem. 2003;278:15514–15522. doi: 10.1074/jbc.M212275200. [DOI] [PubMed] [Google Scholar]
- 7.Nakamaru-Ogiso E, Yano T, Ohnishi T, Yagi T. Characterization of the iron–sulfur cluster coordinated by a cysteine cluster motif (CXXCXXXCX27C) in the Nqo3 subunit in the proton-translocating NADH-quinone oxidoreductase (NDH-1) of Thermus thermophilus HB-8. J Biol Chem. 2002;277:1680–1688. doi: 10.1074/jbc.M108796200. [DOI] [PubMed] [Google Scholar]
- 8.Nakamaru-Ogiso E, Yano T, Yagi T, Ohnishi T. Characterization of the iron–sulfur cluster N7 (N1c) in the subunit NuoG of the proton-translocating NADH-quinone oxidoreductase from Escherichia coli. J Biol Chem. 2005;280:301–307. doi: 10.1074/jbc.M410377200. [DOI] [PubMed] [Google Scholar]
- 9.Yano T, Dunham WR, Ohnishi T. Characterization of the ΔμH+-sensitive ubisemiquinone species (SQNf) and the interaction with cluster N2: new insight into the energy-coupled electron transfer in complex I. Biochemistry. 2005;44:1744–1754. doi: 10.1021/bi048132i. [DOI] [PubMed] [Google Scholar]
- 10.Ohnishi T, Salerno JC. Conformation-driven and semiquinone-gated proton-pump mechanism in the NADH-ubiquinone oxidoreductase. FEBS Lett. 2005;579:45–55. doi: 10.1016/j.febslet.2005.06.086. [DOI] [PubMed] [Google Scholar]
- 11.Yakovlev G, Reda T, Hirst J. Reevaluating the relationship between EPR spectra and enzyme structure for the iron–sulfur clusters in NADH:quinone oxidoreductase. Proc Natl Acad Sci U S A. 2007;104:12720–12725. doi: 10.1073/pnas.0705593104. [DOI] [PMC free article] [PubMed] [Google Scholar]
- 12.Nakamaru-Ogiso E, Matsuno-Yagi A, Yoshikawa S, Yagi T, Ohnishi T. Iron–sulfur cluster N5 is coordinated by a HxxxCxxCxxxxxC motif in the NuoG subunit of E. coli Complex I. (submitted for publication) doi: 10.1074/jbc.M804015200. [DOI] [PMC free article] [PubMed] [Google Scholar]
- 13.Leif H, Sled VD, Ohnishi T, Weiss H, Friedrich T. Isolation and characterization of the proton-translocating NADH: ubiquinone oxidoreductase from Escherichia coli. Eur J Biochem. 1995;230:538–548. doi: 10.1111/j.1432-1033.1995.tb20594.x. [DOI] [PubMed] [Google Scholar]
- 14.Djafarzadeh R, Kerscher S, Zwicker K, Radermacher M, Lindahl M, Schagger H, Brandt U. Biophysical and structural characterization of proton-translocating NADH-dehydrogenase (complex I) from the strictly aerobic yeast Yarrowia lipolytica. Biochim Biophys Acta. 2000;1459:230–238. doi: 10.1016/s0005-2728(00)00154-7. [DOI] [PubMed] [Google Scholar]
- 15.Waletko A, Zwicker K, Abdrakhmanova A, Zickerman V, Brandt U, Kerscher S. Histidine 129 in the 75-kDa subunit of mitochondrial complex I from Yarrowia lipolytica is not a ligand for [Fe4S4] cluster N5 but is required for catalytic activity. J Biol Chem. 2005;280:5622–5625. doi: 10.1074/jbc.M411488200. [DOI] [PubMed] [Google Scholar]
- 16.Belevich G, Euro L, Wikström M, Verkhovskaya M. Role of the conserved arginine 274 and histidine 224 and 228 residues in the NuoCD subunit of complex I from Escherichia coli. Biochemistry. 2007;46:526–533. doi: 10.1021/bi062062t. [DOI] [PubMed] [Google Scholar]
- 17.Ohnishi T. Thermodynamic and EPR characterization of iron–sulfur centers in the NADH-ubiquinone segment of the mitochondrial respiratory chain in pigeon heart. Biochim Biophys Acta. 1975;387:475–490. doi: 10.1016/0005-2728(75)90087-0. [DOI] [PubMed] [Google Scholar]
- 18.Wang DC, Meinhardt SW, Sackmann U, Weiss H, Ohnishi T. The iron–sulfur clusters in the two related forms of mitochondrial NADH:ubiquinone oxidoreductase made by Neurospora crassa. Eur J Biochem. 1991;197:257–264. doi: 10.1111/j.1432-1033.1991.tb15906.x. [DOI] [PubMed] [Google Scholar]
- 19.Ohnishi T, Blum H, Galante YM, Hatefi Y. Iron–sulfur N-1 clusters studied in NADH-ubiquinone oxidoreductase and in soluble NADH dehydrogenase. J Biol Chem. 1981;256:9216–9220. [PubMed] [Google Scholar]
- 20.Blumberg WE, Peisach J. On the interpretation of electron paramagnetic resonance spectra of binuclear iron–sulfur proteins. Arch Biochem Biophys. 1974;162:502–512. doi: 10.1016/0003-9861(74)90210-0. [DOI] [PubMed] [Google Scholar]
- 21.Uhlmann M, Friedrich T. EPR signals assigned to Fe/S cluster N1c of the Escherichia coli NADH:ubiquinone oxidoreductase (complex I) derive from cluster N1a. Biochemistry. 2005;44:1653–1658. doi: 10.1021/bi048136n. [DOI] [PubMed] [Google Scholar]
- 22.Ragan CI, Galante YM, Hatefi Y, Ohnishi T. Resolution of mitochondrial NADH dehydrogenase and isolation of two iron–sulfur proteins. Biochemistry. 1982;21:590–594. doi: 10.1021/bi00532a027. [DOI] [PubMed] [Google Scholar]
- 23.Yano T, Sled VD, Ohnishi T, Yagi T. Expression of the 25 Kilodalton iron-sulfur subunit of the energy-transducing NADH-ubiquinone oxidoreductase of Paracoccus denitrificans. Biochemistry. 1994;33:494–499. doi: 10.1021/bi00168a014. [DOI] [PubMed] [Google Scholar]
- 24.Zu Y, Di Bernardo S, Yagi T, Hirst J. Redox properties of the [2Fe–2S] center in the 24 kDa (Nqo2) subunit of NADH:ubiquinone oxidoreductase (complex I) Biochemistry. 2002;41:10056–10069. doi: 10.1021/bi026026f. [DOI] [PubMed] [Google Scholar]
- 25.Yano T, Yagi T, Sled’ VD, Ohnishi T. Expression and characterization of the 66-Kilodalton (Nqo3) iron–sulfur subunit of the proton-translocating NADH-quinone oxidoreductase of Paracoccus denitrificans. J Biol Chem. 1995;270:18264–18270. doi: 10.1074/jbc.270.31.18264. [DOI] [PubMed] [Google Scholar]
- 26.Meinhardt SW, Kula T, Yagi T, Lillich T, Ohnishi T. EPR characterization of the iron–sulfur clusters in the NADH:ubiquinone oxidoreductase segment of the respiratory chain in Paracoccus denitrificans. J Biol Chem. 1987;262:9147–9153. [PubMed] [Google Scholar]
- 27.Pohl T, Uhlmann M, Kaufenstein M, Friedrich T. Lambda Red-mediated mutagenesis and efficient large scale affinity purification of the Escherichia coli NADH:ubiquinone oxidoreductase (complex I) Biochemistry. 2007;46:10694–10702. doi: 10.1021/bi701057t. [DOI] [PubMed] [Google Scholar]
- 28.Lindahl PA, Day EP, Kent TA, Orme-Johnson WH, Munck Mössbauer E. EPR, and magnetization studies of the Azotobacter vinelandii Fe protein. Evidence for a [4Fe–4S]1+ cluster with spin S = 3/2. J Biol Chem. 1985;260:11160–11173. [PubMed] [Google Scholar]
- 29.Peters JW, Lanzilotta WN, Lemon BJ, Seefeldt LC. X-ray crystal structure of the Fe-only hydrogenase (CpI) from Clostridium pasteurianum to 1.8 angstrom resolution. Science. 1998;282:1853–1858. doi: 10.1126/science.282.5395.1853. [DOI] [PubMed] [Google Scholar]
- 30.Yano T, Magnitsky S, Sled’ VD, Ohnishi T, Yagi T. Characterization of the putative 2x[4Fe–4S] binding Nqo9 subunit of the proton translocating NADH-quinone oxidoreductase (NDH-1) of Paracoccus denitrificans: expression, reconstitution, and EPR characterization. J Biol Chem. 1999;274:28598–28605. doi: 10.1074/jbc.274.40.28598. [DOI] [PubMed] [Google Scholar]
- 31.Rasmussen T, Scheide D, Brors B, Kintscher L, Weiss H, Friedrich T. Identification of two tetranuclear FeS clusters on the ferredoxin-type subunit of NADH:ubiquinone oxidoreductase (complex I) Biochemistry. 2001;40:6124–6131. doi: 10.1021/bi0026977. [DOI] [PubMed] [Google Scholar]
- 32.Dupuis A, Chevallet M, Darrouzet E, Duborjal H, Lunardi J, Issartel JP. The Complex I from Rhodobacter capsulatus. Biochim Biophys Acta. 1998;1364:147–165. doi: 10.1016/s0005-2728(98)00025-5. [DOI] [PubMed] [Google Scholar]
- 33.Mathews R, Charlton S, Sands RH, Palmer G. On the nature of the spin coupling between the iron–sulfur clusters in the eight-iron ferredoxins. J Biol Chem. 1974;249:4326–4328. [PubMed] [Google Scholar]
- 34.Prince RC, Adams MW. Oxidation-reduction properties of the two Fe4S4 clusters in Clostridium pasteurianum ferredoxin. J Biol Chem. 1987;262:5125–5128. [PubMed] [Google Scholar]
- 35.Maly T, McMillan F, Zwicker K, Kashani-Poor N, Brandt U, Prisner TF. Relaxation filtered hyperfine (REFINE) spectroscopy: a novel tool for studying overlapping biological electron paramagnetic resonance signals applied to mitochondrial complex I. Biochemistry. 2004;43:3969–3978. doi: 10.1021/bi035865e. [DOI] [PubMed] [Google Scholar]
- 36.Prisner TF, Rohrer M, MacMillan F. Pulsed EPR spectroscopy: biological applications. Ann Rev Phys chem. 2001;52:279–313. doi: 10.1146/annurev.physchem.52.1.279. [DOI] [PubMed] [Google Scholar]
- 37.Hellwig P, Scheide D, Bungert S, Mantele W, Friedrich T. FT-IR spectroscopic characterization of NADH:ubiquinone oxidoreductase (complex I) from Escherichia coli: oxidation of FeS cluster N2 is coupled with the protonation of an aspartate or glutamate side chain. Biochemistry. 2000;39:10884–10891. doi: 10.1021/bi000842a. [DOI] [PubMed] [Google Scholar]
- 38.Sugiyama H, Nakatsubo R, Yamaguchi S, Ogura T, Shinzawa-Itoh K, Yoshikawa S. Resonance Raman spectra of the FMN of the bovine heart NADH: ubiquinone oxidoreductase, the largest membrane protein in the mitochondrial respiratory system. J Bioenerg Biomembr. 2007;39:145–148. doi: 10.1007/s10863-007-9072-3. [DOI] [PubMed] [Google Scholar]
- 39.Hinchliffe P, Carroll J, Sazanov LA. Identification of a novel subunit of respiratory complex I from Thermus thermophilus. Biochemistry. 2006;45:4413–4420. doi: 10.1021/bi0600998. [DOI] [PubMed] [Google Scholar]
- 40.Fernandes AS, Sousa FL, Teixeira M, Pereira MM. Electron paramagnetic resonance studies of the iron–sulfur centers from complex I of Rhodothermus marinus. Biochemistry. 2006;45:1002–1008. doi: 10.1021/bi0519452. [DOI] [PubMed] [Google Scholar]
- 41.Meinhardt SW, Wang D-C, Hon-nami K, Yagi T, Oshima T, Ohnishi T. Studies on the NADH-Q oxidoreductase segment of the respiratory chain in Thermus thermophilus HB-8. J Biol Chem. 1990;265:1360–1368. [PubMed] [Google Scholar]
- 42.Sled’ VD, Friedrich T, Leif H, Weiss H, Meinhardt SW, Fukumori Y, Calhoun MW, Gennis RB, Ohnishi T. Bacterial NADH-quinone oxidoreductases: iron–sulfur clusters and related problems. J Bioenerg Biomembr. 1993;25:347–356. doi: 10.1007/BF00762460. [DOI] [PubMed] [Google Scholar]