

Abstract
Water plays a critical role in the structure and function of proteins, although the experimental properties of water around protein structures are not well understood. The water can be classified by the separation from the protein surface into bulk water and hydration water. Hydration water interacts closely with the protein and contributes to protein folding, stability and dynamics, as well as interacting with the bulk water. Water potential functions are often parameterized to fit bulk water properties because of the limited experimental data for hydration water. Therefore, the structural and energetic properties of the hydration water were assessed for 105 atomic resolution (≤1.0 Å) protein crystal structures with a high level of hydration water by calculating the experimental water-protein radial distribution function or surface distribution function (SDF) and water radial distribution function (RDF). Two maxima are observed in SDF: the first maximum at a radius of 2.75 Å reflects first shell and hydrogen bond interactions between protein and water, the second maximum at 3.65 Å reflects second shell and van der Waals interactions between water and non-polar atoms of protein forming clathrate-hydrate-like structures. Thus, the two shells do not overlap. The RDF showed the features of liquid water rather than solid ice. The first and second maxima of RDF at 2.75 and 4.5 Å, respectively, are the same as for bulk water, but the peaks are sharper indicating hydration water is more stable than bulk water. Both distribution functions are inversely correlated with the distribution of B factors (atomic thermal factors) for the waters, suggesting that the maxima reflect stable positions. Therefore, the average water structure near the protein surface has experimentally observable differences from bulk water. This analysis will help improve the accuracy for models of water on the protein surface by providing rigorous data for the effects of the apparent chemical potential of the water near a protein surface.
Introduction
Water is essential to the structure and function of proteins. Generally, water around proteins can be divided into three categories 1: 1) bulk water that surrounds the protein molecule at a separation of greater than van der Waals contact, 2) individually bound water that forms hydrogen bonds with charged or polar protein atoms in cavities inside the protein2, and 3) hydration water at the protein surface with direct interactions with the protein 3, 4. The three categories have different functions. Bulk water is free to move, it assists in protein diffusion relative to the other interacting molecules by random movement in solution. Hydration water forms water networks around the protein surface to keep protein in solution. Individually bound water has multiple contacts that stabilize the protein structure. For example, individually bound water stabilizes cavities in thrombin and trypsin 5, 6, and mediates contacts between proteins and their ligands 7. The presence of individually bound water depends on the local structure of the protein, and is often conserved among related proteins. However, a water molecule can share the properties of both individually bound water and hydration water if it has multiple contacts with protein and contributes to a hydration water network. Both individually bound water and hydration water are also known as protein-bound water and form strong interactions with proteins. Bound water is visible in protein crystal structures, but bulk water is not observed because there is no stable location for the water molecules.
Hydration water is a major form of protein-bound water that contributes to many properties of proteins such as protein folding, solubility, drug docking, and oligomer formation as reviewed in 8. Hydration water directly interacts with the protein surface and affects the local protein structure. Protein enzymes without a hydration layer will lose their catalytic abilities 9. Direct observation of hydration water in proteins is difficult, except for visualization in atomic resolution (~1.0 Å) crystal structures of proteins where analysis of neutron and X-ray crystal structures of three proteins showed differences from bulk water 10. Elegant calorimetric experiments on hydrated collagen show that there is a specific binding energy or chemical potential associated with hydration 11. Terahertz spectroscopy has shown that the effects of the hydration environment can extend to 10Å from the surface of a protein 12. Neutron scattering of dipeptide solutions showed small differences between bulk and hydration water 13, but the deffects may be different with proteins due to their larger size. X-ray scattering has been used with myglobin to study hydration water 14.
Although hydration water is very important for protein structure and function, there are no specific parameters for the potential of hydration water in simulations such as molecular dynamics simulations (MD). The water potential function is defined by a set of parameters in simulations that represent the potential energy of water. The water potentials currently used in MD programs are based on water models such as TIP3P 15, TIP4P 16, TIP5P 17 and SPC 18 that are parameterized to reproduce the experimental data of bulk water. Recently, neutron scattering data on dipeptides were used as a basis for generating water potentials 13. The potentials derived from bulk water may not accurately represent the properties of hydration water. For example, when TIP3P was used with CSFF19 and GLYCAM-2000a20, the new versions of CHARMM 21 and AMBER 22 force fields, respectively, the modeled carbohydrate-water interactions on the surface of disaccharides were less structured than in experimental data 23. Theoretical calculations using TIP potentials have been decomposed into polar, apolar and charged interactions 24 in order to fit compressibility data. Moreover, although the compressibility data were well reproduced in 24 the radial distribution curves show less detail than is seen experimentally. Since incomplete sampling of phase space may be an issue in theoretical calculations, solution thermodynamics of proteins and amino acids have been analyzed by Fourier integral methods in statistical mechanics, as implemented in 3D-RISM 25-27 and DYNAMA 28. These methods may resolve sampling issues to produce a better structural agreement between theory and experiment for the same potentials. Hence, the differences between the properties of hydration water and bulk water need to be better defined in order to improve the water potentials and especially to reproduce the critical interactions between water and proteins or other soluble macromolecules.
The structural and energetic factors of hydration water can be studied using the water protein radial distribution function or surface distribution function (SDF) and water radial distribution function (RDF). The SDF describes the density of water as a function of the distance from the protein surface (the closest non-hydrogen atom). The RDF describes the density of water as a function of the distance from a particular water molecule. The RDF is determined by averaging over the many different local structures formed in liquid water 29-31. Local structures include neutral (uncharged) water structures, and two-water-molecule structures with one proton attached (H5+O2) 30. Water molecules also form higher order clusters, such as ten-molecule tetrahedral clusters 29 and 280-molecule expanded icosahedral water clusters comprising 14-molecule tetrahedral units 31.
Previous studies on the hydration water were highly dependent on computational simulations due to the difficulty of direct measurements. Direct measurements of visible hydration water became possible when the atomic resolution crystal structures of proteins became available in significant numbers. Moreover, an average over a number of crystal structures will reduce the deviation caused by the differences in crystallization conditions and other sources of experimental variation.
This study examined 105 crystal structures from the Protein Data Bank32 solved with X-ray data at resolutions better than 1.0 Å. The SDFs and RDFs were calculated and averaged. Two density maxima representing two shells are observed in SDF, the water molecules in the first shell are much denser than those in the second shell. The maxima of RDF are higher than those of bulk water and the minima are lower. In both SDF and RDF, the higher density of water corresponds to the lower B-factor value of water, confirming that water molecules are stable in each maximum.
Methods and Algorithms
The water-protein distance
The ideal model of a protein is a sphere surrounded by first and second water shells (Fig 1a). The positions and densities of the two shells are determined by the interactions between water and the protein. In practice, the protein-water distance is defined as the distance between the water oxygen and the closest non-hydrogen atom in the protein molecule.
Fig 1.


a. The ideal model of water distributed around a protein molecule.
b. Representation of terms. The RDF is the density of water as a function of distance from a particular water molecule w. The actual density of water in the orange shell (UDV) is the number of waters (w1, w2 and w3 represent three of the water molecules) divided by the volume of the UDV. The small cells (e1, e2, e3 etc) are expected to have different water density because they have different distances from the protein surface. The observed density of water in the UDV is the average of the expected density of each small cell.
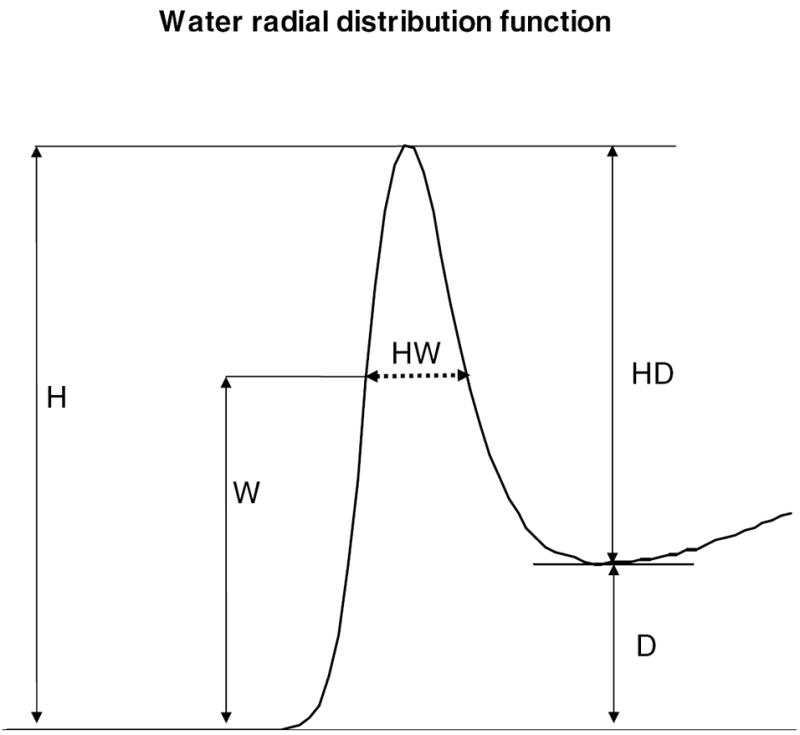
c. The first maximum of an RDF. The sharpness of a maximum of an RDF is defined as HD/HW, where HD=H-D, HW (dashed line) is the width of the peak at height W and W= HD/2 + D.
The water-protein radial distribution
In protein crystal structures, the average density of water around protein (ρ) within any water-protein distance h is
Where, n is the number of water molecules with water-protein distance less than h, Rp is the radius of the protein molecule p.
The bulk water is invisible in protein crystal structures because it is not bound to protein. The density of “visible” water (mostly hydration water) around the protein decreases sharply with distance from the protein surface. The SDF is the water density as a function of the water-protein distance (h) and termed gwp
| (1) |
Water radial distribution
The RDF in the protein crystal structure must be adjusted due to the presence of protein molecules, unlike the RDF in bulk water where only water-water interactions are considered. In the presence of protein atoms, the volume over which the water can be observed is restricted and thus the manner in which the density is normalized must be modified. The raw counts of water molecules within each radial shell are converted into an expected value for the RDF based on the restriction of the shell due to interactions between water and protein molecules. This process is shown in Fig 1b where the thin orange shell represents a volume shell at a distance rw from the water w. The thin orange shell illustrates the unimpeded differential volume element (UDV). The water density at any point within the area surrounded by the orange shell is not only related to the distance to water w, but also related to the distance to protein surface. Steric interactions between the protein and water prevent or impede water from binding in all of the positions in the UDV, thus the area surrounded by the orange shell defines the available differential volume element (ADV). Thus, two water densities can be calculated within ADV: the water density (ρww) which is related to the distance from the water w and caused by water-water the interaction and the water density (ρwp) which is related to the distance from the protein surface and caused by the water-protein interaction.
Where, nww is the actual total number of water molecules within ADV, vw is the volume of ADV, rw is the distance from UDV to water w, nwp is the number of water molecules within ADV evaluated by SDF (gwp), hwrøθ is the distance from each point within ADV to the protein surface.
Thus, the raw RDF (graw) and the water density distribution for normalization (gnor) can be calculated as
d(ρww) is the water density in the UDV calculated from the actual number of waters (w1, w2 and w3 indicate the three water molecules in figure 1b) divided by the volume of the UDV. d(ρwp) is the average of the water density of each small cell in the UDV (e1, e2, e3 ….etc), which is determined by its water-protein distance (hwrøθ). drw is the thickness of the UDV.
Thus, the averaged raw RDF (〈graw〉) and the averaged water density for normalization (〈gnor〉) over all sampled crystal structures can be expressed as
| (2) |
| (3) |
Where P is the total number of protein structures in our sample, Wp is the total number of water molecules in protein p, rwp is the distance from the UDV to water w in protein p.
Therefore, in crystal structures the normalized RDF (gnmlzed) can be expressed as
| (4) |
The number of water molecules
Every water molecule has a refined occupancy in the PDB (Protein Data Bank) file. The majority of water has an occupancy value of 1.0 indicating the presence of this water in all protein molecules forming the crystal. Some waters have occupancies of less than 1.0 indicating the water is not present in all protein molecules in the crystal. In this study, the sum of the occupancy of each water molecule was used instead of the actual number of waters.
The sharpness of a RDF
A numerical measure based on the width at half height was defined in order to describe the sharpness of the features of the RDF. The peaks in the RDF are asymmetric, especially the first peak, which makes the standard symmetric half height measure difficult to apply. Because of this asymmetry, the measure was defined as the amplitude between a maximum and its next minimum (HD) divided by the width of the maximum at the half value of HD (fig 1c). This corresponds to the width at the smaller of the two peak heights.
The water- protein radial distribution of B-factors
The surface (or water-protein radial) distribution function of B-factors (SDFB) is the averaged B-factor of water as a function of water-protein distance (h) which can be calculated from
Where W is the total number of water molecules in the sphere with distance (<h) from protein p, bw is B-factor of each water oxygen in the sphere, ow is the occupancy of each water molecule in the sphere. Thus, the averaged SDFB over all sampled crystal structures can be expressed as
| (5) |
Where P is the total number of protein structures in our samples, Wp is the total number of water molecules in protein p, hp is the distance from the surface of the sphere to the closest atom in protein p.
The water radial distribution of B-factor
The water radial distribution of B-factor is the averaged B-factor of water as a function of water-water distance. At any distance from water w (rw), the radial distribution function of water B-factor (RDFB) can be calculated as
Where W is the number of water and partial water molecules in the ADV with radial (<rw) from water w (Fig 1b), bw is B-factor of each water in the ADV, ow is the occupancy of each water in the ADV. Thus, the averaged RDFB over all sample crystal structures can be expressed as
| (6) |
Where P is the total number of protein structures, Wp is the total number of water molecules in protein p, rwp is the distance from the UDV to water w in protein p.
The above calculations are performed with PDBAnalyzer, a JAVA program developed in-house, and using Microsoft SQL Server 2000 as the database engine. The data for each water molecule such as occupancy, B factor, PDB file name, atom number, distance to the closest atom in protein, and the polarity of this atom in protein were input to a database table as one record. Then, SQL scripts were used to extract data for SDF from more than ten thousands records. Similarly, the data for each pair of water molecules with separation less than 10.5 Ǻ were input into a database table as one record, along with both occupancies, B factors, PDB file names, atom numbers and distances to protein surface. The SQL scripts were used to extract data for RDF from over one million records. Hydrogen atoms can rarely be seen due to the presence of a single electron, even in sub-atomic resolution crystal structures of proteins. Therefore, the position of the water molecule was defined by the position of the oxygen atom, and the RDF is the O-O distribution. The water-protein distance is also calculated as the distance from the O to the non hydrogen atom of the protein.
Results
One hundred and five protein crystal structures refined with water molecules and diffraction data at resolutions ≤ 1.0 Å were analyzed (the structures are listed in the Appendix). These structures contain a total of 33376 water molecules, including 9026 partially occupied waters. The variable crystallization conditions such as temperature, ion concentration and pH value, and differences in crystallographic methodology are assumed to have little or no effect on the calculated radial distributions.
Water-protein radial distribution
The calculated SDF showed two maxima, representing two water shells around proteins, at radial distances of 2.75 Å and 3.65 Å (Fig 2a). The first maximum of 0.19 atoms/Å3 is twice the average density of bulk water at 267K temperature 33. The second maximum of 0.024 atoms/Å3 is much lower. The SDF (blue) is the sum of the water-polar atom radial distribution (SDFpol, red) and the water-non polar atom radial distribution (SDFnon, green), since the protein surface consists of polar atoms (or charged atoms, mostly oxygen and nitrogen) and non-polar atoms (mostly carbon). SDF overlaps with SDFpol almost perfectly between 2.25~3.25 Å, indicating that the first shell consists of water molecules with hydrogen bonds to the polar (or charged) atoms of the protein. The second maximum between 3.2-4.2 Å has a larger contribution from SDFnon, indicating the importance of van der Waals interactions between water molecules and protein. Thus, the first shell is formed around polar atoms and the second shell is formed around the non-polar atoms of the protein, and the two shells are distinct (Fig 2b). The first shell is much denser than the second shell, because polar and charged atoms predominate on the solvent accessible surface of proteins.
Fig 2.


a. The SDF (blue), water-polar atom radial distribution function (SDFpol, red), and water-non polar atom radial distribution function (SDFnon, green). The number of waters is averaged over 105 crystal structures. The plots are calculated from equation (1). The inset shows the enlarged second shell.
b. The model of the first and second water shells on the protein surface. Red and blue beads indicate the polar (or charged) and non-polar atoms on protein surface, respectively. The red and blue arcs represent the first and second shell, respectively. The two shells do not overlap.
The water-water interactions for each water molecule were calculated from all samples. More than 98% of water molecules in the second shell, compared to 82% of all waters, have hydrogen bond interactions with at least one additional water molecule (with average 1.7), indicating further stabilization of these waters by formation of networks. According to Petrenko and Whitworth 1999 34, water molecules interact to form small cage-like structures called clathrate hydrates around methane, ethane, (CH2)2O and other hydrophobic molecules. Similar cages around methyl groups are observed in a protein crystal structure 35. Thus, the majority of water molecules in the second shell of SDF form clathrate-hydrate-like structures.
The Water Radial Distribution Function
The equation (2) used to calculate the actual RDF was developed for calculation of RDF in a system of bulk water where the expected density of water is constant. The observed density of water as a function of water-water distance in proteins is not constant (Fig 3a. dashed pink) which causes the uncorrected or observed RDF to decrease rather than remaining constant with increasing distance from the protein surface (Fig 3a. blue). To eliminate this bias, the normalized RDF (gnmlzed) (Fig 3b. red) is used as calculated from equation (4). The normalized RDF is compared to the RDF of bulk water from ALS x-ray scattering and neutron diffraction at 298K 36, 37 (Fig 3b). The normalized RDF in crystal structures fluctuates more sharply than in bulk water, although the positions of the maxima and minima are the same. The amplitude of each maximum or minimum in the normalized RDF is larger than in the RDF of pure bulk water (fig 3b) and the peaks are sharper. This suggests that steric hindrance and specific interactions between the protein surface and the water lead to a more ordered water structure in the vicinity of the protein surface. Unlike bulk water where three peaks are seen in the RDF 37, these surface effects extend to a (weak) fourth peak at about 8.5 Å distance (fig 3b, table 1) and evidence is seen of ordering at 10 Å.
Fig 3.


a. The raw RDF (blue) from equation (2) and the water density distribution for normalization (pink) from equation (3) among 105 crystal structures.
b. The normalized RDF (red) of water in crystal structures and the RDF of pure bulk water at 298K (green dashed line) 37.
Table 1.
Comparison of Maxima and Minima in RDF calculated for protein structures and pure bulk water
| Proteins1 | Hydration Water in Proteins2 | Pure bulk water3 | |||||||
|---|---|---|---|---|---|---|---|---|---|
| Position | Height | Sharpness | Position | Height | Sharpness | Position | Height | Sharpness | |
| First maximum | 2.76 | 2.92 | 10.08 | 2.76 | 4.04 | 16.95 | 2.73 | 2.75 | 6.35 |
| First minimum | 3.39 | 0.50 | 3.33 | 0.48 | 3.33 | 0.78 | |||
| Second maximum | 4.47 | 1.29 | 0.84 | 4.47 | 1.48 | 0.99 | 4.53 | 1.16 | 0.27 |
| Second minimum | 5.52 | 0.68 | 5.52 | 0.68 | 5.58 | 0.88 | |||
| Third maximum | 6.90 | 1.15 | N/A | 6.81 | 1.15 | N/A | 6.87 | 1.06 | N/A |
| Forth maximum | 8.85 | 1.05 | N/A | 8.82 | 1.05 | N/A | N/A | 1.0 | N/A |
The affect of individually bound water on the normalized RDF
Individually bound water is a small component of the water observed in protein structures. Some individually bound water molecules are deeply buried inside the protein with no surface accessibility. For example, there is a water molecule deeply embedded in inverting glycosidase (water 513 in PDB entry 1KWF), which is 9.3 Å away from the closest water. Such water molecules can bias the analysis of hydration water because they do not belong to the hydration water network. Methodologically, individually bound water was defined as water with no other water molecules within 3.2 Å (the maximum distance to form a hydrogen bond) in this study. Using this definition, individually bound water formed 18% of our sample. The normalized RDF of “pure” hydration water, after removing the individually bound water molecules, also is sharper than that for bulk water and even more than the normalized RDF (Table 1). Similar results were obtained by changing the water-water distance that defines individually bound water to 3.0 Å or 3.4 Å. However, a discontinuity in the RDF is introduced at the cutoff which is not physically realistic. Therefore, the RDF of “pure” hydration water in the experimental data is sharper than bulk water indicating hydration water is less mobile and more ordered than bulk water.
The relationship between water density and its B-factor
Atoms in molecular structures move due to thermal vibrations. In crystal structures, the atomic B factor or thermal factor is used to describe this motion, as well as the effects of static disorder 28. The distribution of atomic B factors can be used to study protein flexibility 38, thermal stability 39, 40 and protein dynamics 41. The relationship between water density and water thermal factor could shed light on the dynamics of hydration water.
The radial distribution of averaged B factor of water molecules as a function of the water-protein distance (SDFB) is shown in Fig. 4a. The maxima and minima are the inverse of those in the SDF (Fig. 4b). Similarly, the radial distribution of averaged B factor of water molecules as a function of the water-water distance (RDFB) show inversed positions of maxima and minima relative to the RDF. In conclusion, water density and its B-factor are negatively correlated, confirming that the water molecules in the shells of high density have relatively low mobility.
Fig 4.

(a) The normalized RDF (red line) and RDFB (dotted blue line) calculated from equation (5). (b). The SDF (red line) and SDFB (dotted blue line) calculated from equation (6).
Discussion
What is the small maximum in the normalized RDF?
The small maximum in the vicinity of 2.3 Å (Fig 3a, 3b.) has not been reported previously. One possibility is just sodium misassigned as water, because sodium is often abundant in the crystallization solutions and can easily resemble a “water” molecule during the refinement of the crystal structure. Harding42 analyzed the radial distribution of sodium-water in protein crystal structures and found the peak to be between 2.3~2.5 Å. However, the small maximum is very sharp within the narrow range of 2.28~2.3 Å, and distinctly different from the maximum due to the assigned sodium-water distribution. The water molecules with separation of 2.28~2.3 Å were checked manually, and none resembled sodium ions with short interactions with several water molecules or polar atoms of protein as described previously 42-44. Therefore, the small maximum is unlikely to be caused by sodium mistakenly assigned as water.
It is possible the small maximum near 2.3 Å arises from a particular water structure, although known water structures such as ice (Ih) 37 produce a maxima at 2.5 Å and H5+O2 30 has a O…O distance of 2.52Å. Alternatively, 90% of the crystal structures in this sample were refined with SHELX (http://shelx.uni-ac.gwdg.de/SHELX/). SHELX picks the maximum of electron density with a distance cut-off of 2.3 Å by default. In addition, most of the waters in the small maximum were observed to have poorly defined electron density and high B factors. Therefore, the small maximum is possibly caused by the distance cut-off of SHELX, or over-interpretation of the electron density maps. However, the possibility that the small maximum represents protonated or another specific water structure cannot be excluded.
How closely does the hydration water in protein crystals represent water in solvated proteins?
Water and protein structures are affected by many factors such as temperature and ion concentration. Protein crystals are grown from solutions with various buffers, salts and/or organic precipitating agents and additives. Many protein crystals are grown at room temperature and atomic resolution X-ray data recorded at very low temperature (liquid nitrogen). However, these factors were ignored in the calculations of the normalized RDF in protein crystal structures, which raises several questions as discussed below.
Crystals are often grown in high ionic strength solutions which could affect the RDF. The high ion concentration in the hydration water of protein crystals, based on previous studies 45, 46, does not increase the sharpness of RDF maxima. The RDF of 10 M lithium chloride solution has no change relative to the RDF of pure water 46. However, with an 8M NaCl solution the sharpness of the RDF maxima decreased about 30% from that of pure water 45.Salts and buffers tend to reduce the sharpness if they have any affect. The RDF in this study shows an increase in sharpness for RDF maxima (fig 3b red), which strongly suggests that the effects of the salts are not causing the difference between hydration water and bulk water.
One possible explanation for the increase in the order in the RDF is the formation of ice. The ice specific maxima (from RDF of ice (Ih) 37) are not observed in the normalized RDF of water in protein crystals, indicating the hydration water on the protein surface is still liquid-like even at very low temperature. Even though the normalized RDF in protein crystal structures is sharper than in bulk liquid water at 298K or at 275K 47, it is unclear how much the low data temperature of data collection affects the normalized RDF. Experimental studies 48 have shown that the disorder in protein crystal structures is dominated by temperature independent static disorder rather than disorder due to thermal motion. Therefore, the effects of temperature on the sharpness of the RDF for protein crystal structures are difficult to extract from the data and may differ from those of an isolated system. It would be necessary to obtain atomic resolution protein structures with data collected at room temperature to answer this question, which is very difficult for most protein crystals using current technology.
Due to the difficulties of experimental measurement, the current studies on hydration water on the protein surface highly depend on computational simulations. Many simulations use water models such as TIP3P 17, TIP4P, TIP5P 17 and SPC 18 derived from bulk water. This study, with experimental atomic resolution data from 105 protein crystal structures, showed a significant difference in the water structure and water potentials between hydration water and bulk water in protein crystals. The results agree with previous studies on crystals of three proteins 10. The RDF of liquid water in vycor, a kind of porous glass with a hydrophilic surface similar to proteins, has higher first and second maximum and lower first minimum than that of bulk water at 300K 49. The RDF of water around the myoglobin molecule showed that both the depth of the first minimum and the height of the second maximum are larger than those for pure bulk water at 298K 14. Neutron scattering on dipeptide solutions shows smaller but distinct effects (McLain 2008)13, as expected due to the smaller size of the solute. The SDFpol and SDFnon in this study are similar to those seen in computer simulations of trypsin, ribonuclease A, hen egg white lysozyme and α-lactalbumin 24.
Conclusions
There are two layers of hydration water in protein crystals as evidenced by the two maxima observed in SDF calculated for 105 atomic resolution structures. This study expands on the analysis of three protein structures by neutron and X-ray diffraction 10 by using a much larger and more complete sample that allows for better normalization. Similar to the earlier study10 the first significant maximum is sharper than is seen in bulk water, but our analysis showed ordered structure at a larger distance and a correlation between RDF and thermal factors. The first maximum at 2.75 Å represents the center of the inner layer of hydration water formed by hydrogen bonds between water and polar atoms of the protein. The second maximum at 3.65 Å represents the outer layer of hydration water formed by water-water hydrogen bonds and van der Waals interactions between water and non-polar atoms of the protein. The structure of water in the outer layer resembles that of a clathrate-hydrate. The RDF displays the characteristics of liquid water rather than solid ice. The first and second maxima of the RDF are at 2.75 and 4.5 Å, respectively, the same distances as those of bulk water. However, the maxima/minima of the RDF of hydration water are higher/lower than those of bulk water, indicating that hydration water is denser and narrowly defined, likely due to stronger interactions induced by the protein. The observed experimental differences between hydration water and bulk water will serve as a solid foundation for theoretical calculations to analyze the apparent chemical potential (or zeta-potential) of water near protein surfaces.
Acknowledgments
We thank Dr. Long Wang for discussing the equations and Dr. Alan K. Soper for data on bulk water. X.C. was supported in part by the Georgia State University Research Program Enhancement award. I.T.W. and R.H.W. are Georgia Cancer Coalition Distinguished Cancer Scholars. This research was supported in part by the Molecular Basis of Disease Program of Georgia State University, the Georgia Research Alliance, the Georgia Cancer Coalition, and the National Institutes of Health awards GM065762 and GM062920.
Footnotes
SUPPORTING INFORMATION
105 protein crystal structures: 1a6m,1aho,1b0y,1brf,1bxo,1c75,1ceq,1ea7,1eb6,1etl,1etm,1etn,1f94,1f9y,1g66,1gkm,1gwe,1hje,1i1w,1ic6,1iee,1ir0,1iua,1k2a,1k4p,1k6u,1kwf,1m40,1mc2,1mnz,1mxt,1n1p,1n4u,1n4v,1n4w,1n55,1n9b,1ob4,1ob7,1ok0,1ot6,1ot9,1p9g,1pq5,1pwm,1rtq,1s5n,1ssx,1sy3,1tt8,1ucs,1unq,1us0,1v0l,1vb0,1vyr,1w0n,1x8p,2fdn,4lzt,7a3h,8rxn,1byi,1c7k,1cex,1exr,1g4i,1g6x,1gci,1gqv,1hj8,1hj9,1iqz,1j0p,1jfb,1k4i,1k5c,1kcc,1kth,1l9l,1lug,1m1q,1mj5,1muw,1nls,1nwz,1od3,1pjx,1pq7,1q6z,1r6j,1rb9,1s5m,1sy2,1tqg,1ufy, 1ug6,1vl9,1x8q,2bf9,2erl,2pvb,3lzt,3pyp,8a3h
Contributor Information
Xianfeng Chen, Email: xchen5@gsu.edu.
Irene Weber, Email: iweber@gsu.edu.
References
- 1.Purkiss A. The protein-solvent interface: a big splash. Philosophical Transactions of the Royal Society A: Mathematical, Physical and Engineering Sciences. 2001;359(1785):1515–1527. [Google Scholar]
- 2.Roberts BC, Mancera RL. Ligand-Protein Docking with Water Molecules. J Chem Inf Model. 2008 doi: 10.1021/ci700285e. [DOI] [PubMed] [Google Scholar]
- 3.Nakasako M. Large-scale networks of hydration water molecules around bovine beta-trypsin revealed by cryogenic X-ray crystal structure analysis. J Mol Biol. 1999;289(3):547–64. doi: 10.1006/jmbi.1999.2795. [DOI] [PubMed] [Google Scholar]
- 4.Higo J, Nakasako M. Hydration structure of human lysozyme investigated by molecular dynamics simulation and cryogenic X-ray crystal structure analyses: on the correlation between crystal water sites, solvent density, and solvent dipole. J Comput Chem. 2002;23(14):1323–36. doi: 10.1002/jcc.10100. [DOI] [PubMed] [Google Scholar]
- 5.Rashin AA, Iofin M, Honig B. Internal cavities and buried waters in globular proteins. Biochemistry. 1986;25(12):3619–25. doi: 10.1021/bi00360a021. [DOI] [PubMed] [Google Scholar]
- 6.Meyer E. Internal water molecules and H-bonding in biological macromolecules: a review of structural features with functional implications. Protein Sci. 1992;1(12):1543–62. doi: 10.1002/pro.5560011203. [DOI] [PMC free article] [PubMed] [Google Scholar]
- 7.Raymer ML, Sanschagrin PC, Punch WF, Venkataraman S, Goodman ED, Kuhn LA. Predicting conserved water-mediated and polar ligand interactions in proteins using a K-nearest-neighbors genetic algorithm. J Mol Biol. 1997;265(4):445–64. doi: 10.1006/jmbi.1996.0746. [DOI] [PubMed] [Google Scholar]
- 8.Raschke TM. Water structure and interactions with protein surfaces. Curr Opin Struct Biol. 2006;16(2):152–9. doi: 10.1016/j.sbi.2006.03.002. [DOI] [PubMed] [Google Scholar]
- 9.Rupley JA, Careri G. Protein hydration and function. Adv Protein Chem. 1991;41:37–172. doi: 10.1016/s0065-3233(08)60197-7. [DOI] [PubMed] [Google Scholar]
- 10.Svergun DI, Richard S, Koch MH, Sayers Z, Kuprin S, Zaccai G. Protein hydration in solution: experimental observation by x-ray and neutron scattering. Proc Natl Acad Sci U S A. 1998;95(5):2267–72. doi: 10.1073/pnas.95.5.2267. [DOI] [PMC free article] [PubMed] [Google Scholar]
- 11.Cameron IL, Short NJ, Fullerton GD. Verification of simple hydration/dehydration methods to characterize multiple water compartments on tendon type 1 collagen. Cell Biol Int. 2007;31(6):531–9. doi: 10.1016/j.cellbi.2006.11.020. [DOI] [PubMed] [Google Scholar]
- 12.Ebbinghaus S, Kim SJ, Heyden M, Yu X, Heugen U, Gruebele M, Leitner DM, Havenith M. An extended dynamical hydration shell around proteins. Proc Natl Acad Sci U S A. 2007;104(52):20749–52. doi: 10.1073/pnas.0709207104. [DOI] [PMC free article] [PubMed] [Google Scholar]
- 13.McLain SE, Soper AK, Watts A. Water structure around dipeptides in aqueous solutions. Eur Biophys J. 2008 doi: 10.1007/s00249-008-0292-1. Epub. [DOI] [PubMed] [Google Scholar]
- 14.Seki Y, Tomizawa T, Khechinashvili NN, Soda K. Contribution of solvent water to the solution X-ray scattering profile of proteins. Biophys Chem. 2002;95(3):235–52. doi: 10.1016/s0301-4622(01)00260-5. [DOI] [PubMed] [Google Scholar]
- 15.Jorgensen; WL, Chandrasekhar J, Madura JD, Impey RW, Klein ML. Comparison of simple potential functions for simulating liquid water. J Chem Phys. 1983;79:10. [Google Scholar]
- 16.Jorgensen WL, Madura JD. Temperature and size dependence for monte carlo simulations of TIP4P water. Mol Phys. 1985;56:11. [Google Scholar]
- 17.Mahoney MW, Jorgensen WL. A five-site model for liquid water and the reproduction of the density anomaly by rigid, nonpolarizable potential functions. J Chem Phys. 2000:112. [Google Scholar]
- 18.Berendsen HJC, Postma JPM, Gunsteren WFv, Hermans J. Intermolecular Forces. Reidel; Dordrecht: 1981. [Google Scholar]
- 19.Kuttel M, Brady JW, Naidoo KJ. Carbohydrate solution simulations: producing a force field with experimentally consistent primary alcohol rotational frequencies and populations. J Comput Chem. 2002;23(13):1236–43. doi: 10.1002/jcc.10119. [DOI] [PubMed] [Google Scholar]
- 20.Basma M, Sundara S, Calgan D, Vernali T, Woods RJ. Solvated ensemble averaging in the calculation of partial atomic charges. J Comput Chem. 2001;22(11):1125–37. doi: 10.1002/jcc.1072. [DOI] [PMC free article] [PubMed] [Google Scholar]
- 21.Brooks BR, Bruccoleri RE, Olafson BD, States DJ, Swaminathan S, Karplus M. CHARMM: a program for macromolecular energy, minimization, and dynamics calculations. Vol. 4. Wiley; 1983. pp. 187–217. [Google Scholar]
- 22.Cornell WD, Cieplak P, Bayly CI, Gould IR, Merz KM, Ferguson DM, Spellmeyer DC, Fox T, Caldwell JW, Kollman PA. A Second Generation Force Field for the Simulation of Proteins, Nucleic Acids, and Organic Molecules. Vol. 117. American Chemical Society; 1995. pp. 5179–5197. [Google Scholar]
- 23.Corzana F, Motawia MS, Du Penhoat CH, Perez S, Tschampel SM, Woods RJ, Engelsen SB. A hydration study of (1-->4) and (1-->6) linked alpha-glucans by comparative 10 ns molecular dynamics simulations and 500-MHz NMR. J Comput Chem. 2004;25(4):573–86. doi: 10.1002/jcc.10405. [DOI] [PMC free article] [PubMed] [Google Scholar]
- 24.Dadarlat VM, Post CB. Decomposition of protein experimental compressibility into intrinsic and hydration shell contributions. Biophys J. 2006;91(12):4544–54. doi: 10.1529/biophysj.106.087726. [DOI] [PMC free article] [PubMed] [Google Scholar]
- 25.Imai T, Hiraoka R, Kovalenko A, Hirata F. Water molecules in a protein cavity detected by a statistical-mechanical theory. J Am Chem Soc. 2005;127(44):15334–5. doi: 10.1021/ja054434b. [DOI] [PubMed] [Google Scholar]
- 26.Harano Y, Imai T, Kovalenko A, Kinoshita M, Hirata F. Theoretical study for partial molar volume of amino acids and polypeptides by the three-dimensional reference interaction site model. The Journal of Chemical Physics. 2001;114:9506. [Google Scholar]
- 27.Imai T, Kovalenko A, Hirata F. Solvation thermodynamics of protein studied by the 3D-RISM theory. Chemical Physics Letters. 2004;395(13):1–6. [Google Scholar]
- 28.Harrison RW, Kourinov IV, Andrews LC. The Fourier-Green’s function and the rapid evaluation of molecular potentials. Protein Eng. 1994;7(3):359–69. doi: 10.1093/protein/7.3.359. [DOI] [PubMed] [Google Scholar]
- 29.Hajdu F. A model of liquid water Tetragonal clusters: description and determination of parameters. Acta Chim (Budapest) 1977;93:24. [Google Scholar]
- 30.Huang X, Braams BJ, Bowman JM. Ab initio potential energy and dipole moment surfaces of (H2O)2. J Phys Chem A Mol Spectrosc Kinet Environ Gen Theory. 2006;110(2):445–51. doi: 10.1021/jp053583d. [DOI] [PubMed] [Google Scholar]
- 31.Müller A, Bögge H, Diemann E. Structure of a cavity-encapsulated nanodrop of water. Inorg Chem Commun. 2003;6:52. [Google Scholar]
- 32.Berman H, Henrick K, Nakamura H. Announcing the worldwide Protein Data Bank. Nat Struct Biol. 2003;10(12):980. doi: 10.1038/nsb1203-980. [DOI] [PubMed] [Google Scholar]
- 33.Botti A, Bruni F, Isopo A, Ricci MA, Soper AK. Experimental determination of the site–site radial distribution functions of supercooled ultrapure bulk water. Vol. 117. American Institute of Physics; 2002. pp. 6196–6199. [Google Scholar]
- 34.Petrenko VF, Whitworth RW. Physics of Ice. Oxford University Press; Oxford: 1999. [Google Scholar]
- 35.Head-Gordon T. Is water structure around hydrophobic groups clathrate-like? Proc Natl Acad Sci U S A. 1995;92(18):8308–12. doi: 10.1073/pnas.92.18.8308. [DOI] [PMC free article] [PubMed] [Google Scholar]
- 36.Sorenson JM, Hura G, Glaeser RM, Head-Gordon T. What can x-ray scattering tell us about the radial distribution functions of water? 2000;113:9149. [Google Scholar]
- 37.Soper AK, Rossky PJ, editors. Chem Phys. Vol. 258. 2000. Special Issue on Liquid Water and Aqueous Solutions; pp. 121–137. [Google Scholar]
- 38.Vihinen M, Torkkila E, Riikonen P. Accuracy of protein flexibility predictions. Proteins. 1994;19(2):141–9. doi: 10.1002/prot.340190207. [DOI] [PubMed] [Google Scholar]
- 39.Vihinen M. Relationship of protein flexibility to thermostability. Protein Eng. 1987;1(6):477–80. doi: 10.1093/protein/1.6.477. [DOI] [PubMed] [Google Scholar]
- 40.Parthasarathy S, Murthy MR. Protein thermal stability: insights from atomic displacement parameters (B values) Protein Eng. 2000;13(1):9–13. doi: 10.1093/protein/13.1.9. [DOI] [PubMed] [Google Scholar]
- 41.Chen X, Weber IT, Harrison RW. Molecular dynamics simulations of 14 HIV protease mutants in complexes with indinavir. J Mol Model. 2004;10(56):373–81. doi: 10.1007/s00894-004-0205-x. [DOI] [PubMed] [Google Scholar]
- 42.Harding MM. Metal-ligand geometry relevant to proteins and in proteins: sodium and potassium. Acta Crystallogr D Biol Crystallogr. 2002;58(Pt 5):872–4. doi: 10.1107/s0907444902003712. [DOI] [PubMed] [Google Scholar]
- 43.Nayal M, Di Cera E. Valence screening of water in protein crystals reveals potential Na+ binding sites. J Mol Biol. 1996;256(2):228–34. doi: 10.1006/jmbi.1996.0081. [DOI] [PubMed] [Google Scholar]
- 44.Kovalevsky AY, Tie Y, Liu F, Boross PI, Wang YF, Leshchenko S, Ghosh AK, Harrison RW, Weber IT. Effectiveness of nonpeptide clinical inhibitor TMC-114 on HIV-1 protease with highly drug resistant mutations D30N, I50V, and L90M. J Med Chem. 2006;49(4):1379–87. doi: 10.1021/jm050943c. [DOI] [PMC free article] [PubMed] [Google Scholar]
- 45.Sherman DM, Collings MD. Ion association in concentrated NaCl brines from ambient to supercritical conditions: results from classical molecular dynamics simulations. 2002;3:102. doi: 10.1186/1467-4866-3-102. [DOI] [PMC free article] [PubMed] [Google Scholar]
- 46.Tromp RH, Neilson GW, Soper AK. Water structure in concentrated lithium chloride solutions. Vol. 96. AIP; 1992. p. 8460. [Google Scholar]
- 47.Hura G, Russo D, Glaeser RM, Head-Gordon T, Krack M, Parrinello M, Matter S. Water structure as a function of temperature from X-ray scattering experiments and ab initio molecular dynamics. 2003;5:1981–1991. [Google Scholar]
- 48.Kurinov IV, Harrison RW. The influence of temperature on lysozyme crystals. Structure and dynamics of protein and water. Acta Crystallogr D Biol Crystallogr. 1995;51(Pt 1):98–109. doi: 10.1107/S0907444994009261. [DOI] [PubMed] [Google Scholar]
- 49.Puibasset J, Pellenq RJ. Confinement effect on thermodynamic and structural properties of water in hydrophilic mesoporous silica. Eur Phys J E Soft Matter. 2003;12(Suppl 1):67–70. doi: 10.1140/epjed/e2003-01-017-1. [DOI] [PubMed] [Google Scholar]