

Abstract
Purpose
Large variations in results of diagnostic tests for mild to moderate dry eye are widely recognised. The purpose of this study was to assess if there was concordance between common dry eye diagnostic tests.
Methods
A total of 91 subjects were recruited to the study. The tear film and ocular surface were evaluated using the phenol red thread test, tear break up time (TBUT), biomicroscopic examination and impression cytological (IC) assessment of conjunctival goblet cells. Dry eye symptoms were assessed using McMonnies questionnaire and statistical correlations between all tests were assessed.
Results
This study cohort did not include severe aqueous deficient dry eye patients as determined by the phenol red thread test (PRT). A statistically significant difference was noted between PRT results and all other tests (***P ≤ 0.001). Only meibomian gland pathology, McMonnies questionnaire, reduced goblet cell density and TBUT (≤7 seconds) demonstrated correlation determined by McNemar’s test.
Conclusion
A correlation was only found between tests assessing lipid/mucous deficiency (meibomian gland evaluation, goblet cells density, TBUT, and McMonnies questionnaire).
Keywords: correlation dry eye diagnostic tests
INTRODUCTION
The ocular surface functions as a unit and as such can be deleteriously affected by a wide range of pathologies, adversely affecting any of its underlying structures. This can lead to tear film abnormalities, inflammatory changes, neural abnormalities or simply produce symptoms indistinguishable from dry eye disease.1,2 A combination of various subjective and objective measurements are often used to determine the presence and/or severity of dry eye in an individual.2,3 In addition, it has been recognised, particularly in moderate/mild dry eye, that diagnostic tests are prone to disagree and give conflicting results.4–8 Begley et al5 previously reported that ocular surface staining did not always correlate with patient dry eye symptoms while Kallarackal et al8 found a poor correlation between Schirmer’s test and tear break up in dry eye patients.
At present there is no general consensus of the criterion for the diagnosis of dry eye. In the absence of an agreed ‘gold standard’, no set of criteria has been universally adopted which can result in unpredictable variations in test results and diagnosis between studies as per the International Dry Eye Workshop9, 2007. 3,10–13
A dry eye diagnosis is often difficult and complex due to the multifactorial nature of the condition and can be classified based on dry eye etiopathogenesis as aqueous tear deficient dry eye (Sjögren-related and non-Sjögren related syndrome) and evaporative dry eye (including intrinsic and extrinsic causes).2,9
To assess whether lack of correlation shown by previous studies are due to the fact that available tests address different forms of dry eye, we performed in the same patients various dry eye tests, including phenol red thread test (PRT) (for the assessment of aqueous deficiency)4,14–19; Tear film break up (TBUT) (to assess decreased tear film stability)20–23; McMonnies Questionnaire (MQ)12 (for the assessment of patient symptoms), Meibomian gland evaluation (to determine presence of meibomian gland disease)2,24 and conjunctival impression cytology (to observe density of conjunctival goblet cells).25–27
Using statistical methods, this study assessed the degree of concordance between these commonly used dry eye diagnostic tests.
MATERIALS AND METHODS
Participants
The nature of the study and procedures involved were fully explained to all participants and informed consent was obtained prior to recruitment. The use of volunteers followed the tenets of the Declaration of Helsinki and institutional ethics committee approval was obtained.
Study subjects were recruited from three different sources: respondents to study poster adverts including those with dry eye symptoms or those with no symptoms, by personal communications and clinical referrals of patients attending corneal clinic presenting with signs and symptoms of dry eye. The control group consisted of normal volunteers, having no obvious signs or symptoms of dry eye or any previous history of ocular surface abnormalities. Exclusion criteria included pregnancy, those taking oral or topical antibiotics or prescribed eye medication.
Ocular Surface Assessment
Assessment of the tear film and ocular surface was performed by: (1)-biomicroscopic examination of the ocular surface; (2)-conjunctival impression cytology; (3)-PRT and (4)-TBUT using fluorescein. The sequence of testing remained constant for all subjects and one ophthalmologist and one investigator performed all examinations and measurements throughout the study.
Dry eye symptoms
An interview with an ophthalmologist was initially conducted to ascertain the presence, type and frequency of symptoms in each individual and a detailed medication and general health history was documented. All subjects completed a McMonnies dry eye questionnaire,12 consisting of 14 questions and a possible score of 0–45, with a score of ≥14 consistent with a dry eye diagnosis as previously recommended.28–33 The questionnaire includes questions about age, dry eye treatments, environmental factors, medication usage and assesses the presence of 5 dry eye symptoms (soreness, scratchiness, dryness, grittiness and burning).
Meibomian gland and ocular surface grading
A biomicroscopic examination of the meibomian glands, lids, conjunctiva and tear film was performed at a slit lamp to grade the presence/severity of meibomian gland disease (MGD) and assess signs of ocular surface abnormality and inflammation. The grading scale was categorised according to Foulks and Bron (2003).24 (Table 1). For the purpose of statistical analysis, grades 2 or above were regarded as positive for the presence of ocular surface abnormality.
Table 1.
Biomicroscopic grading of meibomian glands, lids, conjunctiva and tear film debris.
| Grading Score | Meibomian Glands | Lid & Lid Margin | Conjunctiva (Palpebral & Bulbar) | Tear Film Debris | ||
|---|---|---|---|---|---|---|
|
| ||||||
| Erythema | Swelling | Erythema/Hyperaemia | Oedema | |||
| None (0) | No glands plugged | Normal | Normal | Normal | Normal | Absence of debris |
| Mild (+1) | 1–2 glands plugged | Redness localised to a small region of the lid(s) margin or skin | Localised to a small region of the lid(s) | Slight localised injection | Slight localised swelling | Presence of debris in inferior tear meniscus |
|
| ||||||
| Moderate (+2) | 1–3 glands plugged | Redness of most or all lid(s) margin or skin | Diffuse, most or all lid(s) but not prominent/protruding | Pink colour, confined to palpebral or bulbar conjunctiva | Moderate/medium localised swelling or mild diffuse | Presence of debris in inferior tear meniscus and in tear film overlying the cornea |
|
| ||||||
| Severe (+3) | All 5 glands plugged | Redness to most or all lid(s) margin and skin | Diffuse, most or all lid(s) and prominent/protruding | Red colour of the palpebral and/or bulbar conjunctiva | Severe diffuse swelling | Presence of debris in inferior tear meniscus and in tear film overlying the cornea. Presence of mucus strands in inferior fornix or on bulbar conjunctiva |
|
| ||||||
| Very Severe (+4) | Marked diffuse redness of both lids(s) margin and skin | Diffuse and prominent/protruding and eversion of lids | Marked dark redness of the palpebral and/or bulbar conjunctiva | Very prominent/protruding diffuse swelling | Presence of debris in inferior tear meniscus and in tear film overlying cornea. Presence of numerous and/or adherent mucus strands in inferior fornix and on bulbar conjunctiva or filamentary keratitis. |
|
PRT
Tear volume was assessed using the Zone-Quick PRT (Menicon, USA). The thread was placed into the lower conjunctival sac of both eyes for 15 seconds and thread wetting measurements recorded immediately subsequent to testing. A value of ≤ 10 mm was used as an indication of dry eye.14
TBUT
Florets sterile paper strips coated with 1mg fluorescein sodium (Chauvin Pharmaceuticals Ltd., UK) were dampened with a drop of sterile saline (Minims, Chauvin Pharmaceuticals Ltd., UK) and shaken gently before being stroked across the inferior cul-de-sac of both eyes. TBUT was determined by measuring the time in seconds between fluorescein delivery by the strip and appearance of the first dry spots on the cornea using a cobalt blue filter of the slit-lamp. Three measurements were taken in succession for each eye and an average value of ≤10 and ≤7 seconds taken as an indication of dry eye.
Conjunctival impression cytology
Conjunctival epithelial and goblet cells were harvested using 5×8 mm strips of 0.22 μm cellulose acetate filter paper (Biopore UK Ltd., UK) by pressing the paper onto the infero-temporal bulbar mucosa for 5 seconds using forceps after instillation of anaesthetic eye drops. Samples were fixed in 95% ethanol, stained with Periodic acid-Schiff (PAS) (Sigma, UK) and flat mounted on a slide. Cell morphology was viewed by light microscopy (NIKON) and images photographed using a Nikon digital capturing camera DSL1 system. Goblet cell density (GCD) was assessed by calculating the number of goblet cells/100 epithelial cells in 4 High Power fields (HPF) (x40) as previously described by Anshu et al (2001).26 An estimation of the nucleo-cytoplasm ratio was noted and cytological grading carried out according to criteria laid down by Saini et al (1990)27 (Table 2). For statistical analyses, subjects with criteria for grades 3–4 were classed as positive.
Table 2.
Cytological grading carried out according to criteria laid down by Saini et al (1990)27
| Grade | Goblet cell No. | Goblet cell shape |
|---|---|---|
| 1 | >30 cells/4HPF | Small round epithelium with nucleocytoplasmic ratio of 1:2 |
| 2 | 15–30 goblet cells/4 HPF | Larger polygonal epithelial cells and nucleocytoplasmic ratio of 1:3 |
| 3 | 5–15 goblet cells/4 HPF | Decreased nucleocytoplasmic ratio |
| 4 | <5 goblet cells/4 HPF | Large epithelial cells with pyknotic nuclei visible |
Statistical Analyses
Ninety-nine percent confidence limits were calculated to compare the means of the individual tests and to determine statistically significant differences in tear break up times between the right and left eyes. The significance level was set at P = 0.05. A McNemar’s test34 was used to compare agreements between tests assumed to have a dependency relationship including the TBUT, phenol red thread test, impression cytology grades, questionnaire scores and biomicroscopy grades. Analyses for the identification of inter-test correlation focused on comparisons of proportions arising from different tests being performed on the same patients on each occasion i.e. matched pairs. The aim of such analyses was to assess the level of association in the diagnosis reported from two or more different tests.
RESULTS
Subject demographics: The mean age of the total 91 subjects recruited was 45 ± 18 years and ranged from 20–80 years. There were 37 males and 54 females with mean age 51±19 years (range 22–80 yrs) and 41±16 years (range 20–79 yrs) respectively. There were no statistically significant differences in the ages within the subgroups of men and women.
Assessment of aqueous deficiency was performed for 78 subjects using the PRT. No subjects were deemed to be aqueous deficient (Fig. 1). All subjects had a PRT wetting measurement of ≥ 10 mm in at least one eye.
Figure 1. PRT wetting data for all subjects tested.
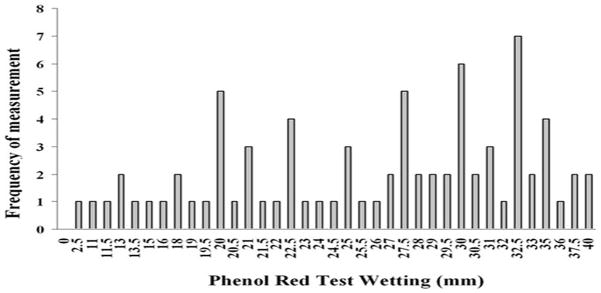
Fig. 1 represents the mean PRT data of both eyes for all subjects assessed (n=78). The overall mean PRT wetting length for the entire group was 23.5 ± 9 mm (range 2.5 to 40 mm) with the most common value being 32.5 mm. No subject was found to have a thread wetting length of ≤10 mm or below in both eyes.
The clinical data for all other diagnostic tests performed for all subjects are shown in Table 3.
Table 3.
Overview of clinical diagnostic data for all subjects.
| Diagnostic Test | n |
|---|---|
| MQ n= 91 | |
| (score ≥ 14) | 38 |
| (score < 14) | 53 |
| Symptoms (n=91) | |
| Burning | 23 |
| Itching | 49 |
| Discomfort/Pain | 33 |
| Blurring | 35 |
| Grittiness | 38 |
| Dryness | 35 |
| Frequency of symptoms (n= 67) | |
| Sometimes | 36 |
| Often | 26 |
| Constantly | 5 |
| Intensity of symptoms (n=67) | |
| Score 1–2 | 17 |
| Score 3–4 | 46 |
| Score 5 | 3 |
| Meibomian gland plugging (n=182 eyes) | |
| Grade 0 (none) | 33 |
| Grade 1 (mild) | 75 |
| Grade 2 (moderate) | 38 |
| Grade 3 (severe) | 31 |
| Grade 4 (very severe) | 5 |
| TBUT (n=81) | |
| Score <7 sec | 60 Range 2–56 s; mean 8 s |
| Goblet cell count (n=41) | |
| Grade 1 | 0 |
| Grade 2 | 13 |
| Grade 3 | 13 |
| Grade 4 | 15 |
Impression cytology samples from 49 subjects were processed with PAS (Fig. 2) and graded accordingly. Subsequent to staining, 8 samples were not included in the results due to poor quality of cell coverage (<50%) deeming the sample void.
Figure 2. Photomicrographs of representative impression cytology specimens stained with PAS.
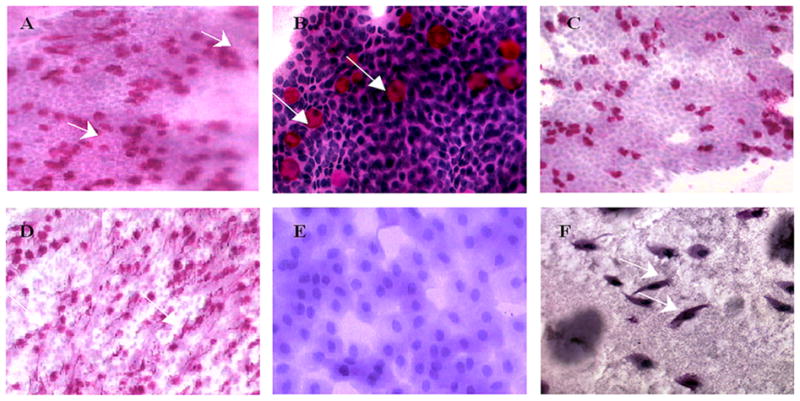
Photomicrographs of representative impression cytology specimens stained with PAS. Cells obtained from impression cytology sampling were stained directly on the nitrocellulose filter paper and photographed. A is a representative of a Grade 2 demonstrating a normal cytological picture with a high number of goblet cells present (indicated by arrows) (mag. × 200). B is representative of a normal cytological specimen post PAS staining: the presence of goblet cells embedded in the epithelial sheet represented by the pink colour against conjunctival epithelia, counterstained purple with haematoxylin with round shaped epithelial cells with dense staining round nuclei and abundant goblet cells stained bright pink (mag × 400). C is a representative of early loss of goblet cells in a subject with mild dry eye. A reduced number of goblet cells were visible post PAS staining (mag × 200). D represents a mild blepharitis with a high density of goblet cell secretions with snake-like strands of mucous secretions often associated with MGD (as indicated by the arrows) (mag × 200). E represents moderate-severe dry eye with distinct squamous metaplasia of the conjunctival epithelium and complete absence of goblet cells (mag × 400). F represents moderate-advanced squamous metaplasia from a subject with dry eye and ocular surface inflammation. The absence of goblet cells can also be noted (mag×200).
Signs of ocular surface inflammation as determined by biomicroscopic examination were performed for both eyes in all 91 subjects (Table 4.)
Table 4.
Frequency of biomicroscopy scores for the assessment of the lids and lid margins, conjunctiva and tear film debris in 91 subjects (n=182 eyes).
| Grade | Lid & Lid margin | Conjunctiva | Tear film debris | ||
|---|---|---|---|---|---|
|
| |||||
| erythema | swelling | erythema/hyperaemia | oedema | ||
| None (0) | 62 | 137 | 38 | 152 | 85 |
| Mild (1) | 88 | 31 | 102 | 26 | 88 |
| Moderate (2) | 28 | 12 | 38 | 4 | 6 |
| Severe (3) | 4 | 2 | 4 | 0 | 3 |
| Very severe (4) | 0 | 0 | 0 | 0 | 0 |
|
| |||||
| Total eyes | 182 | 182 | 182 | 182 | 182 |
The number of subjects deemed to be dry eye within this study cohort varied depending on the test used and whether a diagnosis was made based on a individual test or combination of two tests. (Table 5.)
Table 5.
Comparison of dry eye diagnosis based on individual tests
| Diagnostic Test | Diagnosis | |
|---|---|---|
|
| ||
| Dry Eye (n) | Normal (n) | |
|
|
||
| PRT (n=78) | 0 | 78 |
| MQ (91) | 38 | 53 |
| Biomicroscopy (n=91) | 38 | 53 |
| IC (n=41) | 28 | 13 |
| TBUT (81) | 60 | 21 |
| TBUT & Questionnaire (n=81) | 30 | 51 |
n; number of subjects
TBUT-tear breakup time; PRT - phenol red thread test; MQ - McMonnies Dry Eye Questionnaire; IC -Impression cytology; MG - meibomian gland; R - right; L – left; y-yes, evidence of correlation; n-no evidence of correlation
P ≤ 0.05,
P ≤ 0.01,
P ≤ 0.001;
ns – no significance.
In a study requiring positive results of TBUT and questionnaire scores, 30 subjects would be diagnosed with dry eye while 60 would have a positive diagnosis based solely upon TBUT results. Depending on the method used up to a quarter of the study cohort can change from a dry eye diagnosis to normal.
We evaluated this study cohort by assessing evidence of inter-test correlation using McNemars statistical test. The PRT was performed on 78 subjects and TBUT assessed in 81 subjects. Only results for matched paired subjects (n=76), tested for both TBUT and PRT were analysed when looking for a correlation between these two tests (Table 6.).
Table 6.
Summary of correlations between individual dry eye diagnostic tests performed for all matched pair subjects.
| Diagnostic Test | TBUT | PRT | MQ | IC grade | MG grade | Lid erythema | Lid swelling | Conjunctiva erythema | Conjunctiva oedema | Tear film debris | ||||||||||
|---|---|---|---|---|---|---|---|---|---|---|---|---|---|---|---|---|---|---|---|---|
|
| ||||||||||||||||||||
| R | L | R | L | R | L | R | L | R | L | R | L | R | L | R | L | R | L | R | L | |
|
PRT <10mm |
n*** | n*** | - | - | n*** | n*** | n*** | n*** | n*** | n*** | n*** | n*** | n*** | n*** | n*** | n*** | n*** | n*** | n*** | n*** |
|
TBUT ≤7 sec |
- | - | n*** | n*** | y ns |
n* | y ns |
y ns |
y ns |
n* | n*** | n*** | n*** | n*** | n*** | n*** | n*** | n*** | n*** | n*** |
|
TBUT ≤8 sec |
- | - | n*** | n*** | y ns |
n** | y ns |
ns | n* | n** | n*** | n*** | n*** | n*** | n*** | n*** | n*** | n*** | n*** | n*** |
|
TBUT ≤9 sec |
- | - | n*** | n*** | n* | n** | y ns |
y ns |
n** | n** | n*** | n*** | n*** | n*** | n*** | n*** | n*** | n*** | n*** | n*** |
|
TBUT ≤10 sec |
- | - | n*** | n*** | n*** | n*** | y ns |
y ns |
n** | n*** | n*** | n*** | n*** | n*** | n*** | n*** | n*** | n*** | n*** | |
|
TBUT ≤11 sec |
- | - | n*** | n*** | n*** | n*** | y ns |
y ns |
n** | n*** | n*** | n*** | n*** | n*** | n*** | n*** | n*** | n*** | n*** | n*** |
|
TBUT ≤12 sec |
- | - | n*** | n*** | n*** | n*** | n* | n* | n** | n*** | n*** | n*** | n*** | n*** | n*** | n*** | n*** | n*** | n*** | n*** |
|
MQ ≥13 |
n*** | n*** | n*** | n*** | - | - | n* | y ns |
y ns |
n*** | n*** | n*** | n*** | n** | n*** | n*** | n*** | n*** | n*** | |
|
MQ ≥14 |
n*** | n*** | n*** | n*** | - | - | n* | y ns |
y ns |
n*** | n*** | n*** | n*** | n** | n*** | n*** | n*** | n*** | n*** | |
| IC | y ns |
y ns |
n*** | n*** | n** | - | - | n* | n* | n*** | n*** | n*** | n*** | n*** | n*** | n*** | n*** | n*** | n*** | |
Diagnostic tests which displayed evidence of concordance for all matched paired subjects included: MGD (grades 3 or 4) and McMonnies questionnaire; reduced goblet cell density with decreased TBUT, and reduced TBUT also demonstrated some correlation with MGD (grades 3 or 4) and McMonnies questionnaire. A lack of concordance was found between all the other tests (P ≤ 0.001) as determined by McNemars test (Table 6).
DISCUSSION
In our study, significant correlation was found between certain tests assessing dry eye, in particular meibomian gland evaluation, goblet cells density, TBUT, and the McMonnies questionnaire. No correlation resulted between this group of tests and PRT, assessing aqueous deficiency. Despite the fact that both measure aqueous deficiency, poor correlation was found between PRT and McMonnies questionnaire.
No correlation was noted between lid erythema/swelling, conjunctival erythema/swelling and tear film debris with TBUT, McMonnies questionnaire, goblet cell density or meibomian gland disease. Since our study cohort did not include patients with severe aqueous deficiency potentially though not present in this study a positive correlation might be found between characteristics such as lid erythema/swelling, conjunctival erythema/swelling and tear film debris with aqueous deficient dry eyes, this remains to be tested and proven.
It is well recognised that severe dry eye patients, such as those with Sjögren’s syndrome, will have greatly reduced tear production as evidence by positive Schirmer or PRT tests. 4,35 A normal PRT result however does not mean that a patient does not have dry eye, simply that there is greater tear production and therefore it may be appropriate to use a completely different set of tests in this subset of patients.9 As shown in Fig. 1, no subject tested within this study demonstrated a significantly reduced tear volume as measured by the PRT test, indicating that our study cohort did not fall within the spectrum of aqueous deficiency.
Assessment of patient symptoms is usually considered invaluable as a diagnostic aid for dry eye, often in the form of a questionnaire, in which patients report their pattern of symptoms. Various dry eye questionnaires are now available to characterise and help in the diagnosis of dry eye conditions.13,36–38 This study adhered to the original McMonnies questionnaire (1986)12 often considered to be the most widely used since its inception. However, the accuracy of this method may be affected by the wide range of terms individual subjects use to describe their ocular irritation. Based upon McMonnies questionnaire 38 subjects were deemed dry eye positive with a questionnaire score of 14 or above and 53 were categorised as non dry eye.
MGD potentially has a significant role in destabilising the tear film possibly as a result of alterations in fatty acid composition.39 In this study cohort, 38 subjects would have been deemed ‘dry eye’ based solely on an ocular surface biomicroscopic examination.
Although a trend was noted between dry eye symptomatology and ocular surface inflammation within this study, concurring with this recognised general association, 40–42 this did not reach statistical significance.
The assessment of tear film stability using fluorescein is considered by many to be the most important clinical diagnostic test available,43,44 with previous studies demonstrating tear break up time to be reduced in nearly all forms of dry eye, from KCS to meibomian gland disorders.35,45–46 However, as a clinical tool, TBUT using fluorescein has been criticised due to concerns about its reproducibility and variability between normal subjects on different days.47 In this particular study, the reduction of the TBUT cut-off to 7 seconds, rather than the commonly accepted 10 seconds, may have helped eliminate part of the effects of fluorescein upon the tear film thus improving correlations between dry eye tests. Using this cut-off of <7 seconds, 60 subjects within this study cohort were deemed to have a tear film abnormality indicative of dry eye.
Since the introduction of impression cytology for the analyses of ocular surface cells by the Maurice group in 1977,48 it has been continually developed and is now one of the most preferred techniques in ocular surface sampling in dry eye, keratitis and conjunctivitis.49 Conjunctival impressions enable detailed analysis of conjunctival, epithelial and goblet cells including their shape, type, number and density which provides valuable information concerning the status of the ocular surface.50 Goblet cells are known to secrete soluble mucins into the tear film, playing a major role in the defence and regulation of the ocular surface. Since lack of goblet cells is one of the hallmarks of all dry eye syndromes in particular mucin deficiency, the classical impression cytology approach which allows the calculation of goblet cell density and the staging of squamous metaplasia 25 was used to assess any goblet cell loss within our study cohort as an indication of dry eye.51 Based on the results of the goblet cell analysis alone, 28 of the 41 subjects tested were deemed to be ‘dry eye’ within our study cohort.
As demonstrated from the results to date a number of individual testing methods displayed a different and conflicting diagnosis where one test deemed a particular subject to have dry eye while another test did not. Therefore, the problem arises for the clinician as to which test to use and which result to take as being ‘true’. In the absence of an available diagnostic ‘gold standard’9 we used a statistical approach to determine which tests could be used to differentiate between dry eye and non-dry eye within this particular study, determined by how well they correlated with each other.
Using McNemar’s test we demonstrated that only a few tests correlated with each other as indicators of dry eye including; MGD (grades 3 or 4) with reduced TBUT and McMonnies questionnaire and reduced GCD with decreased TBUT and McMonnies questionnaire. Therefore, we propose that these four diagnostic techniques are potentially the most valuable tests for diagnosing dry eye.
In conclusion, evaporative dry eye can be identified by several tests, which showed correlation in the present study. The assessment of aqueous deficiency is on the contrary more difficult, as shown by the poor correlation found by the present study between symptoms and direct measurement of tear volume.
Acknowledgments
Supported by the Department for Employment and Learning in Northern Ireland.
Footnotes
Licence for Publication
The Corresponding Author has the right to grant on behalf of all authors and does grant on behalf of all authors, an exclusive licence (or non-exclusive for government employees) on a worldwide basis to the BMJ Publishing Group Ltd and its Licensees to permit this article (if accepted) to be published in BJO and any other BMJPGL products to exploit all subsidiary rights, as set out in our licence.
Competing Interests
None declared
Ethical Approval:
Ethical approval for this study was obtained from the Office for Research Ethics Committees (OREC) Northern Ireland.
References
- 1.Eisner G. The non-dry ‘dry eye’ complex. Ophthalmologica. 2006;220:141–146. doi: 10.1159/000091755. [DOI] [PubMed] [Google Scholar]
- 2.The definition and classification of dry eye disease: Report of the definition and classification subcommittee of the International Dry Eye Workshop (2007) The Ocular Surface. 2007;5:75–92. doi: 10.1016/s1542-0124(12)70081-2. [DOI] [PubMed] [Google Scholar]
- 3.Bron AJ. The Doyne Lecture. Reflections on the tears. Eye. 1997;11(Pt 5):583–602. doi: 10.1038/eye.1997.161. [DOI] [PubMed] [Google Scholar]
- 4.Albietz JM. Dry eye: an update on clinical diagnosis, management and promising new treatments. Clin Exp Optom. 2001;84:4–18. doi: 10.1111/j.1444-0938.2001.tb04930.x. [DOI] [PubMed] [Google Scholar]
- 5.Begley CG, Chalmers RL, Abetz L, et al. The relationship between habitual patient-reported symptoms and clinical signs among patients with dry eye of varying severity. Invest Ophthalmol Vis Sci. 2003;44:4753–4761. doi: 10.1167/iovs.03-0270. [DOI] [PubMed] [Google Scholar]
- 6.Goren MB, Goren SB. Diagnostic tests in patients with symptoms of keratoconjunctivitis sicca. Am J Ophthalmol. 1988;106:570–574. doi: 10.1016/0002-9394(88)90587-9. [DOI] [PubMed] [Google Scholar]
- 7.Saleh TA, McDermott B, Bates AK, et al. Phenol red thread test vs Schirmer’s test: a comparative study. Eye. 2006;20:913–915. doi: 10.1038/sj.eye.6702052. [DOI] [PubMed] [Google Scholar]
- 8.Kallarackal GU, Ansari EA, Amos N, et al. A comparative study to assess the clinical use of Fluorescein Meniscus Time (FMT) with tear break up time (TBUT) and Schirmer’s tests (ST) in the diagnosis of dry eyes. Eye. 2002;16:594–600. doi: 10.1038/sj.eye.6700177. [DOI] [PubMed] [Google Scholar]
- 9.Methodologies to Diagnose and Monitor Dry Eye Disease: Report of the diagnostic methodology subcommittee of the International Dry Eye Workshop (2007) The Ocular Surface. 2007;5:108–123. doi: 10.1016/s1542-0124(12)70083-6. [DOI] [PubMed] [Google Scholar]
- 10.Dogru M, Tsubota K. New insights into the diagnosis and treatment of dry eye. The Ocular Surface. 2004;2:59–75. doi: 10.1016/s1542-0124(12)70145-3. [DOI] [PubMed] [Google Scholar]
- 11.Bron AJ. Diagnosis of dry eye. Surv Ophthalmol. 2001;45 (suppl):S221–6. doi: 10.1016/s0039-6257(00)00201-0. [DOI] [PubMed] [Google Scholar]
- 12.McMonnies C. Key questions in a dry eye history. J Am Optom Assoc. 1986;57:512–517. [PubMed] [Google Scholar]
- 13.Begley CG, Caffery B, Chalmers RL, et al. Dry Eye Investigation (DREI) Study Group, Use of the dry eye questionnaire to measure symptoms of ocular irritation in patients with aqueous tear deficient dry eye. Cornea. 2002;21:664–670. doi: 10.1097/00003226-200210000-00007. [DOI] [PubMed] [Google Scholar]
- 14.Hamano H, Hori M, Hamano T, et al. A new method for measuring tears. CLAO. 1983;9:281–289. [PubMed] [Google Scholar]
- 15.Asbell PA, Chiang B, Li K. Phenol-red thread test compared to Schirmer test in normal subjects. Ophthalmology. 1987;94 (suppl):128. [Google Scholar]
- 16.Little SA, Bruce AS. Repeatabiltiy of the phenol red thread and tear thinning time tests for tear function. Clin Exp Optom. 1994;77:64–68. [Google Scholar]
- 17.Tomlinson A, Blades KJ, Pearce EI. What does phenol red thread test actually measure? Optom Vis Sci. 2001;78:142–146. doi: 10.1097/00006324-200103000-00005. [DOI] [PubMed] [Google Scholar]
- 18.Miller WL, Doughty MJ, Narayanan S, et al. A comparison of tear volume (by tear meniscus height and phenol red thread test) and tear fluid osmolality measures in non-lens wearers and in contact lens wearers. Eye Contact Lens. 2004;30:132–137. doi: 10.1097/01.icl.0000138714.96401.2b. [DOI] [PubMed] [Google Scholar]
- 19.Sakamoto R, Bennett ES, Henry VA, et al. The phenol red thread tear test: a cross cultural study. Invest Ophthalmol Vis Sci. 1993;34:3510–3514. [PubMed] [Google Scholar]
- 20.Norn MS. Desiccation of the precorneal film I. Corneal wetting time. Acta Ophthalmol. 1969;47:865–880. doi: 10.1111/j.1755-3768.1969.tb03711.x. [DOI] [PubMed] [Google Scholar]
- 21.Kojima T, Ishida R, Dogru M, et al. A new noninvasive tear stability analysis system for the assessment of dry eyes. Invest Ophthalmol Vis Sci. 2004;45:1369–1374. doi: 10.1167/iovs.03-0712. [DOI] [PubMed] [Google Scholar]
- 22.Cho P, Yap M. Age, gender and Tear break-up time. Optom Vis Sci. 1993;70:828–831. doi: 10.1097/00006324-199310000-00009. [DOI] [PubMed] [Google Scholar]
- 23.Cho P, Cheung P, Leung K, et al. Effect of reading on non-invasive tear break-up time and inter-blink interval. Clin Exp Optom. 1997;80:62–68. [Google Scholar]
- 24.Foulks GN, Bron AJ. Meibomian gland dysfunction: A clinical scheme for decscription, diagnosis, classification and grading. The Ocular Surface. 2003;1:107–126. doi: 10.1016/s1542-0124(12)70139-8. [DOI] [PubMed] [Google Scholar]
- 25.Nelson JD, Wright JC. Conjunctival goblet cell densities in ocular surface disease. Arch Ophthalmol. 1984;102:1049–1051. doi: 10.1001/archopht.1984.01040030851031. [DOI] [PubMed] [Google Scholar]
- 26.Anshu Munshi MM, Sathe V, Ganar A. Conjunctival impression cytology in contact lens wearers. Cytopathology. 2001;12:314–320. doi: 10.1046/j.1365-2303.2001.00349.x. [DOI] [PubMed] [Google Scholar]
- 27.Saini JS, Rajwanshi A, Dhar S. Clinicopathological correlation of hard contact lens related changes in tarsal conjunctiva by impression cytology. Acta Ophthalmol. 1990;68:65–70. doi: 10.1111/j.1755-3768.1990.tb01651.x. [DOI] [PubMed] [Google Scholar]
- 28.Albietz JM, Bruce AS. The conjunctival epithelium in dry eye subtypes: effect of preserved and non-preserved topical treatments. Curr Eye Res. 2001;22:8–18. doi: 10.1076/ceyr.22.1.8.6977. [DOI] [PubMed] [Google Scholar]
- 29.Gullion M, Maissa C. Dry eye symptomatology of soft contact lens wearers and nonwearers. Optom Vis Sci. 2005;82:829–834. doi: 10.1097/01.opx.0000178060.45925.5d. [DOI] [PubMed] [Google Scholar]
- 30.Johnson ME, Murphy PJ. The agreement and repeatability of tear meniscus height measurement methods. Optom Vis Sci. 2005;82:1030–1037. doi: 10.1097/01.opx.0000192352.78935.e0. [DOI] [PubMed] [Google Scholar]
- 31.Puell M, Benitez-del-Castillo JM, Martinez-de-la-Casa J, et al. Contrast sensitivity and disability glare in patients with dry eye. Ophth Scand. 2006;84:527–534. doi: 10.1111/j.1600-0420.2006.00671.x. [DOI] [PubMed] [Google Scholar]
- 32.Snyder C, Fullard RJ. Clinical profiles of non dry eye patients and correlations with tear protein levels. Int Ophthalmol. 1991;15:383–389. doi: 10.1007/BF00137949. [DOI] [PubMed] [Google Scholar]
- 33.Albietz J. Conjunctival histologic findings of dry eye and non-dry eye contact lens wearing subjects. CLAO. 2001;27:35–40. [PubMed] [Google Scholar]
- 34.Lyles RH, Williamson JM, Lin HM, et al. Extending McNemar’s Test: Estimation and Inference When Paired Binary Outcome Data Are Misclassified. Biometrics. 2005;61:287–294. doi: 10.1111/j.0006-341X.2005.040135.x. [DOI] [PubMed] [Google Scholar]
- 35.Pflugfelder SC, Tseng SC, Sanabria O, et al. Evaluation of subjective assessments and objective diagnostic tests for diagnosing tear-film disorders known to cause ocular irritation. Cornea. 1998;17:38–56. doi: 10.1097/00003226-199801000-00007. [DOI] [PubMed] [Google Scholar]
- 36.Cole SR, Beck RW, Moke PS, et al. The National Eye Institute Visual Function Questionnaire: experience of the ONTT. Optic Neuritis Treatment Trial. Invest Ophthalmol Vis Sci. 2000;41:1017–1021. [PubMed] [Google Scholar]
- 37.Schiffman RM, Christianson MD, Jacobsen G, et al. Reliability and validity of the Ocular Surface Disease Index. Arch Ophthalmo. 2000;118:615–621. doi: 10.1001/archopht.118.5.615. [DOI] [PubMed] [Google Scholar]
- 38.Suzukamo Y, Oshika T, Yuzawa M, et al. Psychometric properties of the 25-item National Eye Institute Visual Function Questionnaire (NEI VFQ-25), Japanese version. Health Qual Life Outcomes. 2005;3:65. doi: 10.1186/1477-7525-3-65. [DOI] [PMC free article] [PubMed] [Google Scholar]
- 39.Joffre C, Souchier M, Grégoire S, et al. Differences in meibomian fatty acid composition in patients with meibomian gland dysfunction and aqueous-deficient dry eye. Br J Ophthalmol. 2008;92:116–119. doi: 10.1136/bjo.2007.126144. [DOI] [PubMed] [Google Scholar]
- 40.McCulley JP, Shine WE. Eyelid disorders: the meibomian gland, blepharitis, and contact lenses. Eye Contact Lens. 2003;29(suppl 1):s93–95. doi: 10.1097/00140068-200301001-00026. [DOI] [PubMed] [Google Scholar]
- 41.Rolando M, Zierhut M. The ocular surface and tear film and their dysfunction in dry eye disease. Surv Ophthalmo. 2001;45(suppl 2):s203–210. doi: 10.1016/s0039-6257(00)00203-4. [DOI] [PubMed] [Google Scholar]
- 42.Pflugfelder SC. Antiinflammatory therapy for dry eye. Am J Ophthalmol. 2004;137:337–342. doi: 10.1016/j.ajo.2003.10.036. [DOI] [PubMed] [Google Scholar]
- 43.Paschides CA, Kitsios G, Karakostas KX, et al. Evaluation of tear breakup time, Schirmer’s-I test and rose bengal staining as confirmatory tests for keratoconjunctivitis sicca. Clin Exp Rheumatol. 1989;7:155–157. [PubMed] [Google Scholar]
- 44.Turner AW, Layton CJ, Bron AJ. Survey of eye practitioners’ attitudes towards diagnostic tests and therapies for dry eye disease. Clin experiment ophthalmol. 2005;33:351–355. doi: 10.1111/j.1442-9071.2005.01026.x. [DOI] [PubMed] [Google Scholar]
- 45.McCulley JP, Sciallis GF. Meibomian keratoconjunctivitis. Am J Ophthalmol. 1977;84:788–793. doi: 10.1016/0002-9394(77)90497-4. [DOI] [PubMed] [Google Scholar]
- 46.Zengin N, Tol H, Gunduz K, et al. Meibomian gland dysfunction and tear film abnormalities in rosacea. Cornea. 1995;14:144–146. [PubMed] [Google Scholar]
- 47.Vanley GT, Leopold IH, Gregg TH. 1977, Interpretation of tear film breakup. Arch Ophthalmol. 1977;95:445–448. doi: 10.1001/archopht.1977.04450030087010. [DOI] [PubMed] [Google Scholar]
- 48.Egbert PR, Lauber S, Maurice DM. A simple conjunctival biopsy. Am J Ophthalmol. 1977;84:798–801. doi: 10.1016/0002-9394(77)90499-8. [DOI] [PubMed] [Google Scholar]
- 49.Calonge M, Diebold Y, Saez V, et al. Impression cytology of the ocular surface: a review. Exp Eye Res. 2004;78:457–472. doi: 10.1016/j.exer.2003.09.009. [DOI] [PubMed] [Google Scholar]
- 50.Brignole-Baudouin F, Ott AC, Warnet, et al. Flow cytometry in conjunctival impression cytology: a new tool for exploring ocular surface pathologies 1996. Exp Eye Res. 1996;78:473–481. doi: 10.1016/j.exer.2003.08.005. [DOI] [PubMed] [Google Scholar]
- 51.Prabhasawat P, Tseng SC. Impression cytology study of epithelial phenotype of ocular surface reconstructed by preserved human amniotic membrane. Arch Ophthalmol. 1997;115:1360–1367. doi: 10.1001/archopht.1997.01100160530001. [DOI] [PubMed] [Google Scholar]