

Abstract
Magnetoencephalography (MEG) imaging examined the neural mechanisms that modulate reaction times to visual events while viewing a driving video, with and without a conversation. Twenty-four subjects ages 18–65 were monitored by whole-head MEG. The primary tasks were to monitor a driving video and to depress a foot pedal in response to a small red light presented to the left or below the driving scene at unpredictable times. The behavioral reaction time (RT) to the lights was recorded. The secondary task was a hands-free conversation. The subject pressed a button to answer a ring tone, and then covertly answered pre-recorded non-emotional questions such as “What is your birth date?” RTs for the conversation task (1043ms, SE=65ms) were slightly longer than for the primary task (baseline no conversation (944ms, SE=48ms). During the primary task RTs were inversely related to the amount of brain activity detected by MEG in the right superior parietal lobe (Brodmann’s Area 7). Brain activity was seen in the 200 to 300 ms range after the onset of the red light and in the visual cortex (BA 19) about 85 ms after the red light. Conversation reduced the strengths of these regression relationships and increased mean RT. Conversation may contribute to increased reaction times by (1) damping brain activation in specific regions during specific time windows, or (2) reducing facilitation from attention inputs into those areas. These laboratory findings should not be interpreted as indicative of real-world driving, without on-road validation, and comparison to other in-vehicle tasks.
Keywords: Magnetoencephalography (MEG), Simulated Driving, Conversation, Reaction Time, Attention, Right Superior Parietal region
1. Introduction
Behavioral analysis methods have been established and validated for measuring and predicting on-road driver performance, while performing secondary tasks in a vehicle [1–5]. It is relatively easy to use video recordings to determine whether a driver’s hands are on the wheel and eyes are on the road during secondary tasks. Studies using both a central and peripheral light in on-road and laboratory studies demonstrate that simple light detection tasks, when used with appropriate parameters and conditions, can provide a highly sensitive measure for workload variations induced by traffic, the actual road environment, driving experience, and/or human-vehicle interface complexity [3, 6]. Performance of secondary tasks such as answering a cell-phone or conversing using a hands-free phone system may affect driving performance [7]. However, these laboratory simulations of driving and secondary tasks are not perfectly predictive of on-road performance. Further, behavioral analysis alone does not directly provide information on how a driver’s brain activity is altered by the secondary task while driving.
Fortunately, the development of high resolution brain imaging machines and imaging techniques [Magnetoencephalography (MEG) and Functional Magnetic Resonance Imaging (fMRI)] has made it possible to study the neural pathways and brain dynamics involved in the simultaneous performance of multiple tasks. These imaging techniques can be used to study how the brain alters its performance of a driving task when required to simultaneously attending to a secondary task [8, 9]. Non invasive fMRI imaging has been used to determine brain activity during a driving task [10, 11]. Simulated driving in the fMRI scan found activation of occipital, parietal and sensorimotor cortex as well as cerebellum activation [12] during primary driving. Another fMRI study involving a virtual simulation and a retrospective verbal report found premotor, parietal and cerebellar regions were active [13]. During driving simulations of avoiding and swerving, fMRI detected occipital, parietal, premotor and insular region activations [13]. On the other hand, reduced activation was found in bilateral parietal and superior extrastriate secondary visual areas when engaging simultaneously speech comprehension and lane tracking tasks [14]. fMRI imaging is very useful for determining which brain regions are significantly involved in task related behavior. However, fMRI imaging provides no information about the complex time sequence of transient activations and interactions between active regions of the brain. Typically, these activities occur in less than a half a second and can be measured using EEG (Electroencephalography) or MEG. Evoked responses of the brain have been measured with EEG in a dynamic virtual-reality driving environment [15]. Event related potentials (ERP) were able to differentiate brain region dynamics in relationship to traffic light simulations. Though cortical source localizations were not performed in this analysis a signal space network was constructed.
MEG is a technique for non-invasively measuring the magnetic fields arising from electrical activity within the human brain [16]. Changes in neural activity are measured with millisecond resolution and imaged with a spatial resolution of approximately 5 mm. Calculated localization of the cortically active results are displayed on a subject’s standard anatomical MRI. Thus, MEG provides spatial resolution of cortical brain activity similar to fMRI and significantly better temporal resolution of the sequence of brain activity. In addition, MEG does not utilize electromagnetic radiation and does not involve any risks to the study participants.
In this study we used MEG imaging, with a validated on-road driving protocol for predicting event detection and response timing [17, 18], to determine the neural mechanisms that underlie event detection while viewing a driving scene (Figure 1) during conversation and no-conversation conditions.
Figure 1.

Video display of the driving scene with small red dot stimulus in the lower central viewing area and in the left peripheral area.
2. Results
We analyzed 19 (14 females and 5 males) of the 24 subjects who had MEG data collected. Five subjects could not be analyzed as their shoulder had bumped into the MEG probe when they depressed the brake pedal causing the sensor to oscillate in relation to their brain causing large amounts of noise artifact.
2.1 Behavioral Data
All subject participated in behavioral lab testing prior to the MEG test. A comparison of individual Reaction Time (RT) means across 28 subjects who participated in the behavioral testing found the overt conversation condition increased mean RT by 73 ms compared to no conversation (540 vs. 467 ms, t(27) = 5.15, p = 0.00002). The covert conversation condition increased mean RT by 41 ms compared to no conversation (508 vs. 467 ms, t(27)= 2.41, p = 0.023). The largest effect sizes in the behavioral lab for RTs was for long conversation compared to no conversation, and the trends were similar for the short conversation condition. The RT difference between overt and covert speech was 32ms (540 vs. 508 ms). Though this was statistically significant (t(27) = 2.78, p = 0.0097) both the covert and overt conversation tasks gave rise to a statistically significant increase in RT compared to the no conversation condition. (See the companion paper [19]). The graph in Figure 2 shows the overall averaged RTs for the Conversation condition versus the No conversation condition.
Figure 2.

This Graph displays the reaction times (milliseconds) for the no conversation condition (black) compared to the conversation condition (white) Behavioral lab (467 ± 12 ms v. 508 ± 20ms respectively) and in the MEG lab (945 ms ± 48ms v. 1043 ± 65 ms respectively). Note longer reaction times occur during the conversation condition in both environments.
2.1 MEG data
In the MEG lab testing, the RT during the primary condition alone was 945 ms (Standard Error (SE) = 48 ms) for the nineteen subjects included in this analysis. There were no misses in the MEG study. If the RT was over 1.5 seconds they were excluded from the MEG average. There were only two such events across the entire group of subjects for all trials. This RT was increased by 478 ms compared to their behavior testing results in the lab (RT 467ms SE= 12 ms). The short conversation scenario did not have a significant number of red lights during a conversation to compare to the no conversation condition. Therefore we only performed the analysis on the long conversation condition. The secondary task (long conversation) plus to the primary condition increased the mean RT to 1043 ms (SE = 65 ms) in the MEG. The RT with secondary task increased by 535 ms compared to their behavior testing results in the lab (RT 508ms SE=20ms, covert). The conversation effects increased the RT by 98 ms, in the MEG with no effect on miss rates (t = 3.3962, df = 18, p-value = 0.003219). ANOVA analysis by subject (N=19) means found no statistically significant difference in miss rates between any condition (total miss rate <2%). Even though the RTs in the MEG were longer than those in the lab, the main effect of conversation on the primary driving task was found consistently in both settings: conversation caused increase in RTs by 98ms for the covert condition in the MEG lab and 41ms for the covert and 73 ms for the overt condition in the behavioral lab as seen in Figure 2.
The typical filtered MEG waveforms for one subject are shown in Figure 3. The waveforms display the MEG data for one second after the red light stimulus appeared (t=0). The left side waves are from the no conversation condition and the right at the conversation condition. The four waveforms represent the different RTs that have been divided into separate groups based on the reaction time seen to the left of the waveform. The red line indicates the evoked response that correlated with reaction time and was used for source localization.
Figure 3.

The waveforms display the filtered MEG data for one second after the red light stimulus appeared. (t=0) in both conditions for one subject. The four waveforms represent the different RT. Divided in to separate bins based on reaction time seen as the left of the wave form. Red line indicates the evoked response that correlated with reaction time.
Individual correlation analysis of changes in MEG data with reaction time, of subjects performing only the primary condition, found a high-amplitude MEG signal during the time interval 200 to 300 ms after onset of the red dot (Figure 4). Cortical activation, corresponding to this peak signal, was imaged in the right superior parietal lobe, as well as the corresponding amplitude of right superior parietal activity was inversely related to RT. This was especially prominent in a few subjects. Significant correlation of right parietal brain activity with RT was also observed after averaging the results from all 19 subjects, while performing only the primary task with no conversation (Figure 5) at 220 ms and in the visual cortex, at 85 to 90 ms after red light presentation. In Figure 5 with locations of greatest change with reaction time are colored red. Each line in the MEG waveform plot on the upper right image in Figure 5 corresponds to the average MEG data (across subjects and MEG channels) as calculated from the regression line relationships. The relationship of MEG data RT was analyzed separately for each subject and each condition. For the conversation condition, MEG data corresponding to RT was found to be well modeled by a linear combination of two spatio-temporal components. One of these components corresponded to the average MEG response across all reaction times while the second component was related to reaction time difference. Linear regression analysis established the amount of the RT component that needed to be added to the mean response to obtain MEG data corresponding to a specific reaction time, Figure 4. By using the correct mixture of these two components, MEG data corresponding a short and long reaction time (differing by 500 msec about the mean RT) was created and the brain activity imaged using a combination of MR-FOCUSS and ICA. Change in brain activity associated with reaction time was determined by subtracting the imaged activity corresponding to the long reaction time from the imaged activity corresponding to the short reaction time. The same analysis was applied to the no conversation condition. In the final step, the brain response corresponding to RT for the conversation condition was compared with the no conversation condition after averaging across all subjects. Based on these averaged results, we observed the brain response with RT was significantly different between conversation and no conversation conditions at 90 msec in the visual cortex and 220 msec in the right superior parietal cortex. Compared to the no conversation condition, change in cortical activity with reaction time was significantly lower for the conversation condition at these two locations. Thus, the amplitude of MEG data (and corresponding brain activity) changed significantly at time points characterized by a large vertical spread of the lines. The relative shift in the mean of the lines corresponds to the change in location of brain activation with time as the flow of information starts in the visual cortex in the back of the brain and spreads forward to other specialized processing and integration regions.
Figure 4.

The regression line is fit to the amplitude of MEG data projected on the RT related component. Thus, the vertical scale specifies the amount of the RT component that must be added to the mean MEG data component to obtain MEG data corresponding to a specific reaction (horizontal scale). The RT component shown is MEG data from the conversation condition for one subject (shown on the right). The RT component for the no conversation condition is similar but not identical. Further, both RT and mean response components differ across individuals.
Figure 5.

Neural correlate in Right Parietal Region related to event detection during the primary condition (No Conversation) only. This MEG/MRI image represents the group average of brain activation from 19 subjects. Red Arrow indicates changes taking place in the right partial region. Each line in the Graph in the upper right hand corner represents a different response time. Red line indicates the latency of the MEG/MRI image. Amplitude scale is in percent change.
In contrast, to primary condition results, adding the conversation task significantly increased the mean RT and reduced the amplitude of the 220 ms component of the MEG data of individual subjects (Figure 6). Further, in the averaged results from 19 subjects, reaction time was related to brain activity changes in different brain regions, compared to the primary condition results. RT-related change in brain activity in the right superior parietal (Figure 5) and extrastriate visual regions (Figure 6) were greatly reduced relative to the primary task results. Also modulation of brain activity with RT occurred in language areas. In the left parietal brain, modulation with reaction time for both conditions was apparent, but modulations in the right superior parietal region were significantly reduced when the conversation was added. This was seen in the average across all subjects.
Figure 6.
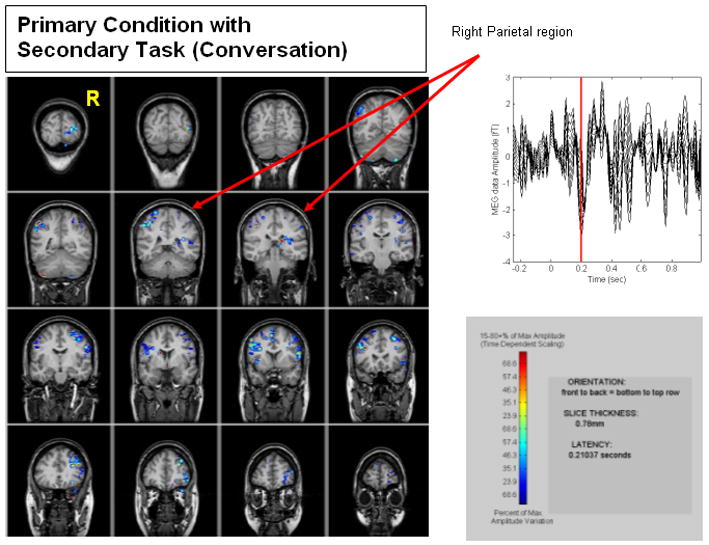
Neural correlate in right parietal region related to event detection during the primary condition plus secondary task (Conversation). This image represents a group average of brain activation from 19 subjects. Red Arrow indicates NO changes are taking place in the right partial region. Red Arrow indicates changes taking place in the right partial region. Each line in the Graph in the upper right hand corner represents a different response time. The red line in this graph marks the time point corresponding to the brain images on the left. Amplitude scale is in percent change.
In contrast to the left parietal cortex, change in cortical activity with RT was reduced or unchanged in the right parietal regions when conversation is added to the driving task. Figures 7 is a side-by-side comparison of the cortical changes occurring in the right parietal cortex averaged across all 19 subjects for the no conversation condition compared to the conversation condition. Figure 8 is also a side-by-side comparison of the brain activation changes in the occipital region across all 19 subjects for the primary condition (no conversation) compared to the primary plus secondary conversation task.
Figure 7.

A) Brain responses at 200ms during primary task (response to lights while viewing driving video). B) Brain responses to primary plus secondary task (conversation) at 200ms. The strength of the regression relationship between the brain activity and reaction time at this particular time interval is decreased in the conversation condition (B), in the right superior parietal lobe.
Figure 8.

A) Average cortical changes in the occipital brain region at 80 ms after onset of red dot during the primary condition (response to lights while viewing driving video). B) Average cortical changes in the occipital brain region during the primary condition plus the secondary tasks of conversation. The strength of the regression relationship between the brain activity and reaction time at this particular time interval is decreased in the conversation condition (B), in the visual occipital cortex.
3. Discussion
The driving-like paradigm used here is similar to that used in static vehicle behavioral studies that have been validated for predicting on-road driver performance data [17, 18]. This work, therefore, has applications for the design of driver interfaces for improved driving performance. However, these laboratory findings should not be interpreted as if real-world conversations are driver distractions, without on-road validation, and comparison to other in-vehicle tasks. The findings in our current study are supported by a real-world driving study by Young et al. [20]. In which, drivers were able to use some strategies to compensate for reaction time delays caused while participating in a hands-free cell phone conversation.
In this MEG study, covert speech was required to minimize artifact. Though analysis of the subject’s reaction time differences between overt and covert speech (compared to no conversation) in our behavioral testing were found to be statistically significant (73 ms vs. 41 ms respectively) the MEG RTs differences for covert speech were 98ms, but overall RTs were 2 times longer in the MEG lab than in the Behavioral lab (467 and 508 vs. 945 and 1043). We used a difference foot pedal for each of these studies. The sensitivity of the foot pedal in the behavioral lab was much better then the pedal used in the MEG lab and this may account for the large differences. Despite difference in these two settings, conversation effect on event detection during simulated driving was found consistently in both MEG and behavioral lab testing.
The locations of cortical brain activity in the fronto-parietal, visual, auditory and motor were seen in the MEG results for individual subjects performing the primary task alone in this driving-like environment. These cortical locations were similar to those found in by fMRI during simulated driving (Hsieh in submission) [13]. There are many areas in the brain that are active during this simulated driving task (as detailed in the companion fMRI paper). This MEG paper only focused on the two brain areas that had change in activity correlated with changes in reaction time and which differed between conversation and no conversation conditions. Based on previous studies, described below, these two areas (right superior parietal lobe and extrastriate visual cortex) are important in the integration of visualization and motor responses. There is increasing evidence that multi tasking uses the parietal cortex. Several studies have shown that the posterior parietal cortex is implicated in the switching of attention between different spatial locales [21–23]. Non-spatial shifting of selective attention between distinct visual attributes of a stimulus (shape versus color) also involves parietal cortex [24]. The involvement of superior posterior parietal cortex in switching between semantic categories (e.g. fruits or cars) and between over learned sequences (days of the week, months of the year or letters of the alphabet) clearly implies a far more multi- or supra-modal role for this region than was hitherto suspected. Attentional shifts do not need to involve visual and/or spatial factors, [22, 25, 26], in order to implicate parietal cortex. These cortical regions are also known to be involved in integration of motor and visual function [27–29]. The neural correlates underlying multi-tasks are spatially coherent between fMRI and MEG results [30]. Our study found an effect of auditory/speech stimuli on visual-motor processing the superior parietal cortex, which is a novel finding to our knowledge and expands the role of this region in multi-sensory and motor processing. Our findings also show that performing multiple tasks may trigger changes in brain activity that can directly correlate with poor performance during a simulated driving task.
Since MEG has high temporal resolution the location of specific brain activity in relationship to long or short RTs were identified. Our results found that activity in the right superior parietal region was highly correlated with RT. This may possibly be due to visual attention related to top down effects. Our results seem to suggest that there might be generalized suppression of activity in this right superior parietal region due to the effects of conversation. Further change in RT with conversation appears to be determined by changes in activity in auditory and language areas. These MEG imaging findings suggest driving-like tasks recruit neural systems known to be involved in visual-motor multimodal processing and integration, and show the dynamics of those neural systems. Further, with the addition of a conversation task, mean reaction time increases and changes in reaction time correlated with alteration of brain activity in auditory and language regions of the brain. It is very possible that our results may have a similar affect as would be seen in a vigilance task with a distracter condition. The importance of this study is in relationship to the changes that occur while performing a simulated driving task and having a conversation. Therefore these results reflect the neural mechanisms that are impacted while performing multi tasks, specifically tasks such as those that include driving and speaking.
The MEG results showed an apparent dampening of activation in the superior parietal area during certain intervals of the time-locked response to the red dot stimuli. The reduction in the time-locked signal between 200–300 ms in the superior parietal area (BA 7) and 70–80 ms in the visual area (BA 19) in the MEG data during the conversation condition might be caused by a suppression of activity in those regions, a possible removal of facilitation, or some other unknown cause. Thus rather than suppressing activity in these regions, conversation instead may simply reduce the synchronicity of the neural response, which would lead to an apparent reduction in a time-locked MEG response. There was variability across the subjects where each individual had difference between the conditions but after averaging all subjects together these differences in the right parietal region became stronger.
This explanation is substantiated by an examination of the standard deviations of the foot reaction times to the light events within each subject in the conversation vs. no conversation conditions. The variability of the response times across events was higher for 18 out of 24 MEG subjects during the conversation condition compared to the no conversation condition. The average within-subject standard deviation across RT events was 280 ms in the MEG long conversation block and 220 msec in the MEG no conversation block. Looking at the period within the conversation block in the MEG lab when the subject was actually engaged in covert conversation (rather than responding to the ring with a button press, or remaining silent between trials), the change in the reaction time standard deviation during conversation was even more pronounced. Within the MEG long conversation block, the standard deviation of the reaction times to the light events across an average of 52 or so light events per subject was 292 ms when the subject was in the conversation period, compared with 220 msec in the MEG no conversation block. Here, 22 out of 24 subjects had more variability in their reaction times when they were actually speaking, then when they were in the no conversation condition. Hence the reduction in the amplitude of the time-locked MEG signal was almost certainly due to an increased variability of the neural conditioned response to the light in the superior parietal and visual areas, and not necessarily to a reduction in the amplitude of the response.
In summary we have successfully recorded changes in brain activity associated with brake response time in a simulated driving environment with and without a conversation task. We found changes in brain activation with reaction time are altered by the conversation task. The greatest differences between the task conditions were in the visual cortex and right parietal region (visual motor integration), where activity decreased due to the conversation task. Cortical regions in the right superior parietal lobe of the brain are engaged in cognitive processing when the response time for detection of the red light is short. This area of the brain is responsible for multitasking and being visual aware of one’s surroundings. These findings (laboratory setting) suggest that conversation may affect event detection in one or more of these ways: 1) By damping the brain activation response in the Visual Cortex, giving rise to longer reaction times; 2) By damping the brain activation response in Right Superior Parietal Region, giving rise to longer reaction times; or 3) By increasing temporal variability of the neural conditioned response to the light in the superior parietal and visual areas, that are associated with a net increase in mean reaction time.
4. Methods
4.1 Subjects
Twenty eight subjects (ages 18–65; with current driver’s licenses) underwent behavioral testing [11 males and 17 females] during performance of a driving task with and without a secondary conversation task while watching a driving scene. These subjects were all right-handed with normal hearing and vision (with correction). All held valid driver’s license and had no previous neurological or psychological history. They also had no metal (braces, pins, plates etc.) in the body which would create distortion on these imaging studies. Of these 28 subjects 24 subjects (7 males and 17 females; age range: 18–61 with a mean age of 36.5 (SD 13.8)) were monitored by MEG while viewing the same driving scene.
A few days prior to the MEG study, the driving and cell phone conversation simulation study was performed in a behavioral testing laboratory where the subject sat in front of a PC computer on a desk (see companion paper Hsieh et al. in submission). During the study the subject was instructed to focus their attention on activities occurring in the driving scene video displayed in front of them on a large flat screen monitor (Figure 1). There were 6 different 7 minute driving scenes. Each was randomly shown with the conversation scripts. The driving scene consisted of secondary road driving and highway driving. A car traveling on a secondary road stopped when the light was red and then continued on. These were videos of real driving made by the General Motors and used in their static driving test laboratory. The video camera captured the images out of the front window of the car from the driver’s seat. They were engaging to the subjects. No pedestrians or crashes occur. The driving scene is an ordinary day of driving in the city and then going on the expressway for a short time. The primary (driving) task was to depress a foot pedal, located under their right foot, in response to a small red dot stimulus presented to the left or below the driving scene. There were 4 separate conversation scripts presented to the participants along with each 7 minute driving scene video. Each conversation script lasted approximately 1 minute. The visual event detections and viewing of the driving video occurred throughout all three experimental conditions. Each experimental session lasted about 7 minutes with 70 visual stimuli events per session. This provided enough trials for good signal to noise ratios after averaging the MEG data. A break of approximately 2–3 minutes occurred in-between the three experimental conditions sessions. In each block, a visual event was presented every 4 to 6 seconds, randomly between the central and peripheral locations. Each visual event lasted a maximum of 3.5 seconds unless terminated earlier by a pedal press. The visual field of view of the driving scene was 30 degrees including the targets. The targets have a diameter of 0.5 inches. The viewing angle for the targets was 2.5 degrees. The subjects did not need to perform a saccade to see the targets. Subjects could detect the stimuli in their peripheral vision. The visual angle of the overall stimuli was small enough that the red dots could be seen in the periphery from any viewing location in the driving scene. Two dots were chosen rather than one, so that subjects could not fixate on one dot. Presentation software was used to display the driving video, red dot stimuli and record the break pedal response. The stimuli turned off when the pedal was pushed or at 3.5 seconds, which ever came first. Two secondary tasks of conversation were added to the primary condition (long and short conversation). During the conversation conditions subjects spoke silently to themselves (covert). We performed an initial practice task where they spoke out loud. The subjects were then instructed to speak covertly and not open their mouths in the MEG scanner. Their answer and end conversation button push responses showed they were engaged in the task. Three different scenarios were tested in the MEG scan and behavioral lab. The behavioral lab also repeated the two conversation scenarios while the subject spoke out loud (overt). The presentation order or these scenarios was counterbalanced across sessions and across subjects. No sessions were intermixed in the MEG data collection. In scenario 1, the subject responded to the presentation of the red dots by pushing the foot pedal, this is the primary (simulated driving) task. In scenario 2, in addition to performing the primary task, the subject was required to respond to a ring tone by depressing the button located under their right hand. Then to answer covertly a sequence of pre-recorded emotionally neutral questions, such as: “What is your birth date?”, “What is your address?” (See Table I for a conversation example). Each question was followed by 10 seconds of no conversation to allow participants to answer questions. Further, each question required only very short answers. During the overt trials in the laboratory before the MEG study, subjects never had difficulty answering before the next question. This simulated cell phone conversation was the secondary task. Scenario 3 was similar to scenario 2 except the subject covertly answered only one question then hung up. The ring tone was heard, followed by the recorded question: “Hi, Can you talk?” Subjects were instructed to covertly respond: “No, I am driving. Good-bye”. A 30–60 second random interval followed each script for the conversation condition. Subjects performed both Scenarios (2 and 3) covertly (with out moving their mouth) and overtly (speaking out loud) in the behavioral testing lab, but only covertly in the MEG scanner. The stimulus locations were chosen to be at two key locations for real driving: the forward center view on or near the roadway (i.e. the red tail lights on the car in front of you), and the left outside driver mirror [17, 18]. The driving scene video, red dot stimulus and foot pedal apparatus were based on the methods used in laboratory studies validated as predictive of on-road driving behavior by Angell et al., 2002 [17, 18] and Young et al., 2005 [17, 18]. The RTs were recorded for the pedal press and analyzed for statistically significant differences during performance of primary and primary plus secondary task conditions.
Table 1.
Conversation example
| Simulated cell phone call: | (Ring). |
| Driving subject: | (Manually press a button to answer the call) |
| Recorded speech: | Hi, could you tell me your birth date? |
| Driving subject: | (Month/day/year) |
| Recorder caller: | Could you tell me your home address? |
| Driving subject: | (street number, street, city, state) |
| Recorder caller: | Could you tell me your home telephone number? |
| Driving subject: | (area code) (xxx-xxxx) |
| Recorder caller: | Thanks, that’s all. Bye. |
| Driving subject: | Bye (and press the same button to hang up the phone). |
4.2 MEG experiment
Cortical magnetic fields were measured using a 148-channel Neuromagnetometer (WH2500 Magnes, 4D Neuroimaging San Diego, CA), a helmet shaped device covering the entire adult head, except the face. The individual sensors were SQUID (super conducting quantum interference device) magnetometers. Measurements were taken inside a magnetically shielded room located in the Neuromagnetism Laboratory at Henry Ford Hospital. All subjects gave written informed consent prior to study. The Institutional Review Board of Henry Ford Hospital approved the protocol.
After demagnetization of dental work (with a commercial videotape eraser), three small electrode coils were taped to the forehead of each subject with two-sided tape, and two additional coils were taped to the preauricular points in front the ear canals. These coils were for localizing the head position with respect to the MEG sensor. The subject then lay comfortably on a bed in the shielded room. Each subject’s head shape was digitized and the locations of the five head position electrode coils with respect to the neuromagnetometer detector coils were registered. The neuromagnetometer helmet containing the 148 channel detector array was placed around the subject’s head in close proximity to the skull surface.
During each study 20 minutes of MEG data were continuously collected and digitally recorded at 508 Hz after band-pass filtering (analog 0.1–100 Hz). The driving scene (fig. 1) was back-projected on a translucent white projection screen. The image was viewed in a mirror placed above the subject’s face (tilted 45°, center of the mirror was 30 cm from subject’s face). The visual viewing angle of the driving scene was 50-degrees. Subjects were given the same instructions as in the behavior testing, except all answers were made covertly. The stimulus sounds were presented binaurally through E-A-RTONE 3A foam insert earphones at a comfortable listening level. The participant was asked to avoid excessive eye blinks and body movements during data collection. Each participant was monitored by video camera and two-way audio speaker system during the time he/she was in the shielded room. In task 1 the subject was asked to respond to the appearance of a red dot below or to the left of the driving scene by pushing the foot pedal which output a 5V signal that was stored as a separate channel with the MEG data and used for calculating reaction time. In task 2 subjects were asked to respond to a ring tone by depressing the button (modified mouse with no moving metal parts) located under their right hand, covertly answer the same questions as give in the behavioral test (Table 1), i.e. engaging in a simulated cell phone conversation, and press the mouse button at the end of the conversation. Three diving video scene tasks (lasting 7 minutes) were viewed in each MEG scan.
To correlate MEG areas of cortical activity with specific anatomical structures, each subject’s head digitization points collected at the beginning of the MEG study were used to coregister MEG coordinates of imaged activity to a single model of the head and brain. This coregistration included the separate determination of x, y, and z mm-per-pixel scaling factors to match digitization points to the head surface [31]. The head and brain model was constructed from the magnetic resonance imaging (MRI) scan of a normal subject, consisting of 124 (256×256) sagittal T1 images, which included the entire skin surface of the head. The model of the brain that was constructed from the MRI images consisted of 3204 sites distributed such that each site represented the same amount of cortical gray matter. The imaging technique, MR-FOCUSS [32] was used to determine the amplitude of x, y, and z oriented dipoles at each of the 3204 brain model sites. MR-FOCUSS utilizes a recursively refined current distribution imaging algorithm to obtain whole-brain images of both focal and extended sources, which may be simultaneously active. Based on the use of a common brain model correspondence between anatomical structures and MEG areas of cortical activation has an average precision of approximately 5 mm [33]. These imaging results were displayed on corresponding MRI images of brain structure, using the MEG imaging and visualization software package, MEG Tools [34].
4.3 MEG data analysis
The MEG data were band-pass filtered, 3–30 Hz prior to extracting a 1.25 second epoch of MEG data for each red dot presentation. Each epoch of data consisted of 0.25 seconds of data prior to onset of the red dot stimulus and 1.0 second of data after the onset of the red dot. Large artifacts were removed using adaptive PCA and ICA filtering techniques. Next, a set of independent brain activations composed of signals synchronized with the light onset were created by a Partial Least-Squares analysis [35] of the completed set of single trial MEG data. Projection of the MEG data onto these set of brain activations eliminated additional noise, artifact, and brain activity not synchronized with light onset. Then, the epochs of MEG data were divided into two groups, those where only the primary driving task (hitting the pedal) was performed and those that included the primary and secondary task (simulated cell phone conversation). The conversation data segments in this MEG study were defined to be solely the period during which the questions were asked and the subject putatively gave the covert responses. The periods in which the phone rang and a button was pressed were not analyzed in the MEG data. Within each group, epochs corresponding to reaction times between 0.3 and 1.5 seconds were subdivided by reaction time into bins with a width of approximately 6 ms then averaged to obtain 7 to 10 MEG data epochs of MEG data corresponding to a reaction times. For each group, separately, a mean MEG activation component across all reaction times and a second component that quantified changes in MEG activation with RT were extracted using multiple linear regression. Thus, the change in MEG data amplitudes with RT is a function of time, as determined by the polarity of the mean activation component relative to the RT component, as well as the amplitude and sign of the regression coefficients. A typical regression line fit to a plot of RT versus the RT component amplitudes of the MEG data are shown in Figure 2. Next, for 11 reaction times centered on the mean RT, using these 2 MEG components, 11 epochs of MEG data were constructed corresponding to primary task performance and separately for performance of the primary plus conversation task. Each of these sets of MEG data were imaged onto the common brain model using a combination of ICA and MR-FOCUSS [36]. Therefore, the change in imaged activity cortical activity with RT is a function of both time and cortical location. In order to combine the imaging results across subjects, change in brain activity amplitude with reaction time was divided by the mean change in brain activity with reaction time to obtain a dimensionless measure of the alteration of brain activity with RT. Finally, these normalized results of all 19 subjects were combined separately for the conversation and no conversation conditions. For viewing, only locations of greatest variation of brain activity with RT (greatest 10% of cortical sites) were considered in the analysis. The result images are scaled as a percentage greater than the average RT sensitivity for the conversation and the no conversation results. Differences in imaged brain activity between conversation and no conversation included differences in mean reaction time as well. In contrast, the change in amplitude with RT is not related to specific reaction time. We used the relationship of brain activity with reaction time, within a condition, as the metric to quantify the ability of the brain to handle fluctuating demands needed for this simulated driving task.
Acknowledgments
We thank Stefan Posse for initial collaboration. We would also like to recognize Roger Hersberger and Gregory Campeau for technical engineering support on this project. We thank GM Photographic Design for videotaping and digitizing the driving scenes. We also thank Linda Angell for her scientific insight and support, and John Sullivan for review of the manuscript. The research was supported by Ford, GM, and Nissan through the Crash Avoidance Metrics Partnership, and NIH/NINDS Grant R01-NS30914 (Tepley).
Footnotes
Publisher's Disclaimer: This is a PDF file of an unedited manuscript that has been accepted for publication. As a service to our customers we are providing this early version of the manuscript. The manuscript will undergo copyediting, typesetting, and review of the resulting proof before it is published in its final citable form. Please note that during the production process errors may be discovered which could affect the content, and all legal disclaimers that apply to the journal pertain.
References
- 1.Underwood G, Chapman P, Brocklehurst N, Underwood J, Crundall D. Visual attention while driving: sequences of eye fixations made by experienced and novice drivers. Ergonomics. 2003;46(6):629–646. doi: 10.1080/0014013031000090116. [DOI] [PubMed] [Google Scholar]
- 2.Young R. Association between embedded cellular phone calls and vehicle crashes involving airbag deployment in First International Symposium on Human Factors in Driver Assessment, Training, and Vehicle Design; Public Policy Center, University of Iowa; 2001. [Google Scholar]
- 3.Angell LS, Young RA, Hankey JM, Dingus TA. Society of Automotive Engineers. Washington, DC, USA: 2002. An evaluation of alternative methods for assessing driver workload in the early development of in-vehicle information systems. [Google Scholar]
- 4.Strayer DL, Johnston WA. Driven to distraction: Dual-task studies of simulated driving and conversing on a cellular phone. Psychological Science. 2001;12:462–466. doi: 10.1111/1467-9280.00386. [DOI] [PubMed] [Google Scholar]
- 5.Rensink RA, O’Regan JK, Clark JJ. To see or not to see: The need for attention to perceive changes in scenes. Psychological Science. 1997;8(5):368–373. [Google Scholar]
- 6.Young RA, Angell LS. The dimensions of driver performance during secondary tasks in Second International Driving Symposium on Human Factors in Driver Assessment, Training and Vehicle Design; Public Policy Center, University of Iowa; 2003. [Google Scholar]
- 7.Patten CJD, Kircher A, Östlund J, Nilsson L. Using mobile telephones: Cognitive workload and attention resource allocation. Accident Analysis and Prevention. 2004;36(3):341–350. doi: 10.1016/S0001-4575(03)00014-9. [DOI] [PubMed] [Google Scholar]
- 8.Stutts JC, Feaganes JR, Rodgman EA, Hamlett C, Meadows T, Reinfurt DW, Gish K, Mercadante M, Staplin L. Distractions in everyday driving. AAA Foundation for Traffic Safety; Washington, DC. 2003. [Google Scholar]
- 9.Stutts JC, Reinfurt DW, Staplin L, Rodgman EA. The role of driver distraction in traffic crashes AAA Foundation. 2001 [PubMed] [Google Scholar]
- 10.Graydon FX, Young RA, Benton MD, Genik RJ, II, Posse S, Hsieh L, Green CC. Visual event detection during simulated driving: Identifying the neural correlates with functional neuroimaging. Transp Res F. 2004;7:271–286. [Google Scholar]
- 11.Calhoun VD, Pekar JJ, McGinty VB, Adali T, Watson TD, Pearlson GD. Different activation dynamics in multiple neural systems during simulated driving. Human Brain Mapping. 2002;16:158–167. doi: 10.1002/hbm.10032. [DOI] [PMC free article] [PubMed] [Google Scholar]
- 12.Walter H, Vetter SC, Grothe J, Wunderlich AP, Hahn S, Spitzer M. The neural correlates of driving. NeuroReport. 2001;12:1763–1767. doi: 10.1097/00001756-200106130-00049. [DOI] [PubMed] [Google Scholar]
- 13.Spiers HJ, Maguire EA. Neural substrates of driving behavior. NeuroImage. 2007;26:245–255. doi: 10.1016/j.neuroimage.2007.02.032. [DOI] [PMC free article] [PubMed] [Google Scholar]
- 14.Just MA, Keller T, Cynkar J. A decrease in brain activation associated with driving when listening to someone speak. Brain Research. 2008;1205:70–80. doi: 10.1016/j.brainres.2007.12.075. [DOI] [PMC free article] [PubMed] [Google Scholar]
- 15.Lin CT, Chung IF, Ko LW, Chen YC, Liang SF, Duann JR. EEG based Assessment of Driver Cognitive responses in a dynamic virtual-Reality Driving Environment. IEEE. 2007;54(7):1349–1352. doi: 10.1109/TBME.2007.891164. [DOI] [PubMed] [Google Scholar]
- 16.Hamalainen M, Hari R. Magnetoencephalographic characterization of dynamic brain activation: Basic principles and methods of data collection and source analysis. In: Toga A, Mazziotta J, editors. Brain Mapping The Methods. Academic press; New York: 2002. pp. 227–254. [Google Scholar]
- 17.Angell LS, Young RA, Hankey JM, Dingus TA. An evaluation of alternative methods for assessing driver workload in the early development of in-vehicle information systems. Society of Automotive Engineering Proceedings; Washington, D. C. 2002. [Google Scholar]
- 18.Young RA, Aryal B, Muresan M, Ding X, Oja S, Simpson S. Validation of the static load paradigm for predicting on-road driving performance while using advanced in-vehicle information and communication devices. 3rd International Driving Symposium on Human Factors in Driver Assessment, Training and Vehicle Design; Rockport, Maine. 2005. [Google Scholar]
- 19.Hsieh L, Young R, Bowyer SM, Moran JE, Genik RJ, II , Green CC, Chiang YR, Yu YJ, Liao CC, Seaman S. Conversation Effects on Neural Mechanisms Underlying Reaction Time to Visual Events while Viewing a Driving Scene: fMRI Analysis and Asynchrony Model. Brain Res. 2008 doi: 10.1016/j.brainres.2008.10.002. In submission. [DOI] [PubMed] [Google Scholar]
- 20.Young R, Schreiner C. Real-world personal conversations using a hands-free embedded wireless device while driving: Effect on airbag-deployment crash rates. Risk Analysis. 2008 doi: 10.1111/j.1539-6924.2008.01146.x. In Press. [DOI] [PubMed] [Google Scholar]
- 21.Posner MI, Petersen SE. The attention system of the human brain. Annual review Neuroscience. 1990;13:25–42. doi: 10.1146/annurev.ne.13.030190.000325. [DOI] [PubMed] [Google Scholar]
- 22.Corbetta M, Shulman GL, Miezin FM, Petersen SE. Superior parietal cortex activation during spatial attention shifts and visual feature conjunction. Science. 1995;270:8702–805. doi: 10.1126/science.270.5237.802. [DOI] [PubMed] [Google Scholar]
- 23.Vandenberghe R, Gitelman DR, Parrish TB, Mesulam MM. Functional specificity of superior parietal mediation of spatial shifting. Neuroimage. 2001;14:661–673. doi: 10.1006/nimg.2001.0860. [DOI] [PubMed] [Google Scholar]
- 24.Le TH, Pardo JV, Hu X. 4 T-fMRI study of nonspatial shifting of selective attention: cerebellar and parietal contributions. J Neurophysiology. 1998;79:1535–48. doi: 10.1152/jn.1998.79.3.1535. [DOI] [PubMed] [Google Scholar]
- 25.Fink GR, Marshall JC, Halligan PW, Frith CD, Driver J, Frackowiak RS, Dolan RJ. The neural consequences of conflict between intention and the senses. Brain. 1999;122:497–512. doi: 10.1093/brain/122.3.497. [DOI] [PubMed] [Google Scholar]
- 26.Jäncke L, Himmelbach M, Shah NJ, Zilles K. The effect of switching between sequential and repetitive movements on cortical activation. Neuroimage. 2000;12:528–537. doi: 10.1006/nimg.2000.0626. [DOI] [PubMed] [Google Scholar]
- 27.Corbetta M. Frontoparietal cortical networks for directing attention and the eye to visual locations: Identical, independent, or overlapping neural systems? Proc Natl Acad Sci. 1998;95:831–838. doi: 10.1073/pnas.95.3.831. [DOI] [PMC free article] [PubMed] [Google Scholar]
- 28.Bueti D, Welsh V, Frith C, Rees G. Different brain circuits underlie motor and perceptual representations of temporal intervals. J Cogn Neurosci. 2008;20(2):204–14. doi: 10.1162/jocn.2008.20017. [DOI] [PubMed] [Google Scholar]
- 29.Gurd JM, Amunts K, Weiss PH, Zafiris O, Zilles K, Marshall JC, Fink GR. Posterior parietal cortex is implicated in continuous switching between verbal fluency tasks: an fMRI study with clinical implications. Brain. 2002;125(5):1024–1038. doi: 10.1093/brain/awf093. [DOI] [PubMed] [Google Scholar]
- 30.Brunetti M, DellaPenna S, Ferretti A, Del Gratta C, Cianflone F, Belardinelli P, Caulo M, Pizzella V, Olivetti Belardinelli M, Romani GL. A frontoparietal network for spatial attention reorienting in the auditory domain: a human fMRI/MEG study of functional and temporal dynamics. Cereb Cortex. 2008;18(5):1139–47. doi: 10.1093/cercor/bhm145. [DOI] [PubMed] [Google Scholar]
- 31.Bowyer SM, Mason KM, Tepley N, Smith BJ, Barkley GL. MEG Validation Parameters for Clinical Evaluation of Interictal Epileptic Activity. Journal of Clinical Neurophysiology. 2003;20(2):87–93. doi: 10.1097/00004691-200304000-00001. [DOI] [PubMed] [Google Scholar]
- 32.Moran JE, Bowyer S, Tepley N. Multi-Resolution FOCUSS: A source imaging technique applied to MEG data. Brain Topography. 2005;18(1):1–17. doi: 10.1007/s10548-005-7896-x. [DOI] [PubMed] [Google Scholar]
- 33.Holliday IE, Barnes GR, Hillebrand A, Singh KD. Accuracy and Applications of Group MEG Studies Using Cortical Source Locations Estimated From Participants’ Scalp Surfaces. Human Brain Mapping. 2003;20:142–147. doi: 10.1002/hbm.10133. [DOI] [PMC free article] [PubMed] [Google Scholar]
- 34.www.megimaging.com.
- 35.McIntosh AR, Lobaugh NJ. Partial least squares analysis of neuroimaging data: applications and advances. NeuroImage. 2004;23:S250–S263. doi: 10.1016/j.neuroimage.2004.07.020. [DOI] [PubMed] [Google Scholar]
- 36.Moran JE, Drake C, Tepley N. ICA Methods for MEG Imaging. Neurology and Clinical Neurophysiology. 2004;72:1–6. [PubMed] [Google Scholar]