Abstract
Rheological properties of adherent cells are essential for their physiological functions, and microrheological measurements on living cells have shown that their viscoelastic responses follow a weak power-law over a wide range of timescales. This power-law is also influenced by mechanical prestress borne by the cytoskeleton, suggesting that cytoskeletal prestress determines the cell’s viscoelasticity, but the biophysical origins of this behavior are largely unknown. We have recently developed a stochastic two-dimensional model of an elastically joined chain that links the power-law rheology to the prestress. Here we use a similar approach to study the creep response of a prestressed three-dimensional elastically jointed chain as a viscoelastic model of semiflexible polymers that comprise the prestressed cytoskeletal lattice. Using a Monte-Carlo-based algorithm, we show that numerical simulations of the chain’s creep behavior closely correspond to the behavior observed experimentally in living cells. The power-law creep behavior results from a finite-speed propagation of free energy from the chain’s end points towards the center of the chain in response to externally applied stretching force. The property that links the power-law to the prestress is the chain’s stiffening with increasing prestress that originates from entropic and enthalpic contributions. These results indicate that the essential features of cellular rheology can be explained by viscoelastic behaviors of individual semiflexible polymers of the cytoskeleton.
Introduction
An outstanding problem of cellular mechanics is to delineate the mechanisms responsible for the rheological properties of the cytoskeleton (CSK), an intracellular network of semi-flexible biopolymers including actin filaments, microtubules and intermediate filaments. This is important since the rheological properties of the CSK are essential for many integrated cellular functions including migration, spreading, division, invasion, contraction, mechanotransduction and intracellular transport. Rheological measurements on various types of living adherent cells have shown that their dynamic modulus and creep compliance scale respectively with frequency (f) and time (t) according to a weak power-law, ~fα and ~tα when analyzed using oscillatory (10 −2-103 Hz) and creep (10 −2-102 s) measurements. The scaling exponent α is between 0.05 and 0.35. It was also found that cell stiffness systematically increases, while α systematically decreases with increasing levels of mechanical distending stress (or prestress) carried by the CSK [1-8]. Since α is indicative of cell transition from elastic solid-like (α = 0) to viscous fluid-like (α = 1) behavior, these findings suggest that cytoskeletal prestress influences viscoelastic properties of living cells. At higher frequencies (from 102 to103 Hz), this power-law behavior crosses over to another power-law with α ≈ 0.75 [8, 9] which is indicative of the entropic dynamics of semiflexible polymer networks [10-13]. However, these high frequencies are of little relevance for cellular physiological functions, whereas at physiological frequencies mechanisms that drive the power-law behavior are not well understood.
Soft glass rheology (SGR) – a semi-empirical theory from soft matter physics [14] – has recently gained interest in cell biology as a framework for interpreting various dynamic behaviors of the CSK, including the rheological behavior [1, 2, 7, 15-17]. According to this theory, the CSK is a soft glassy system that slowly deforms under applied mechanical stress such that its viscoelastic response follows a weak power-law [1, 2, 6]. However, physical origins of glass dynamics within living cells still remain unclear. Moreover, SGR cannot link the power-law rheology to the prestress [17].
The cellular tensegrity model [cf. 18] offers a natural framework for explaining various prestress-dependent behaviors of living cells [cf. 19]. This model depicts the CSK as a prestressed network of opposed tension-supporting and compression-supporting molecular components. The hallmark property of prestressed networks is that they stiffen with increasing level of the prestress. However, tensegrity structures do not naturally predict the power-law behavior.
In contrast to the tensegrity picture that requires a network, an alternative explanation for the cell stiffening with increasing prestress is that it represents a stress-hardening behavior of the CSK due to intrinsic material nonlinearity of individual components of the CSK; e.g., due to nonlinear bending properties of cytoskeletal actin filaments [20] or due to elastic nonlinearity of cytoskeletal crosslinking proteins [21]. However, stress-hardening per se does not explain why the power-law exponent decreases with increasing prestress.
Recently, Kroy’s group [22, 23] and we [24] proposed new models that link the power-law rheology to prestress. A key premise of those models is that mechanical tension carried by semiflexible polymers within a prestressed cytoskeletal lattice influences their molecular dynamics and thereby affects the power-law rheology of the whole CSK. Both studies evoked the wormlike chain (WLC) model, which is as a minimal model of a semiflexible polymer [cf. 25]. The model proposed by Kroy and colleagues describes the viscoelastic response of a continuous glassy WLC under tension. This is accomplished by exponential stretching of the relaxation time spectrum of the standard WLC [22, 23]. While the model predictions compare favorably with experimental data from purified actin gels, they are less successful when compared to the experimental data from living cells [23]. The model that we proposed considered a two-dimensional (2D) version of a discrete WLC, known as the elastically-jointed chain, comprised of nonlinearly elastic line segments connected by linear torsional springs [24]. Assuming that the chain’s dynamics is thermally driven, the model could simulate a power-law creep response such that the power-law exponent decreases with increasing level of prestress, consistent with the observed behavior of living cells. The model shows that enthalpic contributions to the prestress dependence of the exponent, which result from nonlinear elasticity of bonds, are essential for linking the power-law to the prestress, while entropic contributions associated with chain’s conformational changes are minor.
In this study, we expand our discrete 2D elastic-jointed chain model to a more realistic three-dimensional (3D) model. Since the number of conformational possibilities in the 3D model is greater than in the 2D, the 3D model can provide a better insight into the relative contributions of entropic vs. enthalpic chain dynamics to the overall creep response than the 2D model. We use a Monte-Carlo-based algorithm to simulate the creep behavior of single chains at different levels of prestress. We find that the behavior of the 3D model is generally consistent with that of the 2D model, but that there are also important differences that provide additional insight into the dynamics of the chain and its applicability to the rheology of living cells and actin gels.
Model
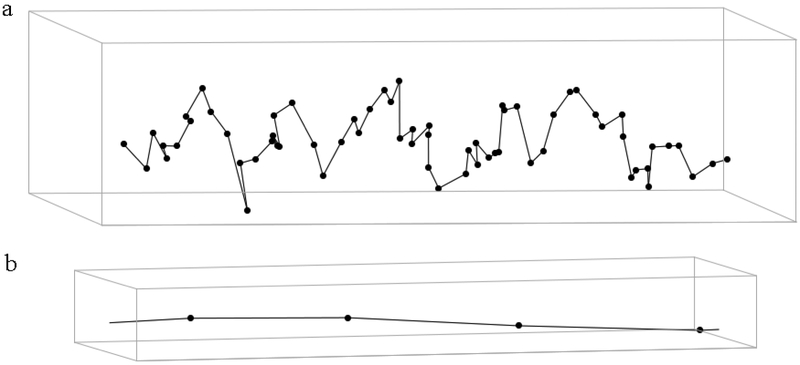
We model a WLC as a 3D elastic-jointed chain comprised of nonlinear elastic springs (bonds), connected by linear torsional springs. Since the movement of a single polymer chain within a polymer network is confined to a tube-like region bounded by its neighboring chains [cf. 25], our chain model is constrained to move inside a long straight tube of a uniform cross-section (Fig. 1). The dynamics of the chain is driven by the motion of its joints as they thermally seek an energetically favorable position in a fixed neighborhood. The chain is stretched by a series of step forces in the direction parallel with the tube’s axis and its creep response is calculated as follows.
Fig. 1.
Schematic of a 3D elastically-jointed chain model of N = 64 bonds confined inside a rectangular tube at steady state, for F0 ≈ 0. The dots represent joints and the connecting lines are bonds. a) For visualization of the whole chain, lateral dimensions of the tube are exaggerated. b) A segment of the same chain with the axial and lateral dimensions in scale shows that the bond angles are close to 180°.
The elastic energy (U) stored in the chain is given by
| (1) |
where N is the total number of bonds in the chain, K1 and K2 are the linear and nonlinear bond stiffnesses, respectively, Kθ is the angular joint stiffness, Δb is the change in bond length from an initial length b0 and θ0 is the change in bond angle from an initial bond angle θ0; it is assumed that b0 and θ0 are uniform throughout the chain. Kθ is needed for the chain to be semi-flexible, whereas K1 and K2 are from the first two terms in the expansion (about b0 of the segment energy with extension. We showed previously in the 2D chain model that the K2 term has a major effect on the relationship between the power law creep and the prestress [24].
The chain is first allowed to thermodynamically equilibrate using a Monte-Carlo energy minimization procedure [26, 27] as follows. A joint is selected at random and then moved to M random positions within a given region (R) inside the tube and the corresponding changes in the elastic energy (ΔU) of the chain with respect to the original configuration are calculated according to Eq. (1). The configuration with the lowest ΔU is selected from these attempts. If ΔU corresponding to the selected configuration is negative, it is accepted as the new configuration of the chain. If ΔU is positive, the probability of accepting this configuration is given by Π = exp(−ΔU/kBT), where kB is the Boltzmann constant and T is absolute temperature. This entire procedure is applied to each internal joint of the chain in a random order which defines one Monte-Carlo time step [26] that, in turn, represents a time unit in our model. Since the chain is confined in a tube-like region, motions of all joints in the transverse direction are constrained to be less than some constant d indicative of the tube’s lateral dimensions. Throughout the procedure, T is maintained constant.
Numerical Simulations
To simulate the creep response, the chain is stretched along the tube’s axis by a pair of forces (F) applied at the endpoints. F is increased in successive steps (δF) and at each step we define the prestressing force (F0) upon which δF is supperimposed as F0 = F – δF. To avoid an instantaneous equilibration of the chain’s end bonds after application of δF, we add a dashpot in parallel and a lumped mass (m) in series to both end bonds. The damping coefficient of the dashpot is chosen to be equal to . The damping coefficient was chosen such that the end bonds were critically damped when stretched from their initial unstretched state. This allows for the quickest equilibration, while avoiding the instabilities associated with instantaneous equilibration.
We perform a dynamic force balance of the lumped mass in the direction of δF determine the positions of the chain’s ends, which is followed by a single Monte-Carlo step to obtain a new chain configuration while the chain’s ends are held fixed. The force balance is then recalculated to obtain the new end-to-end length of the chain. This entire procedure is repeated in order to obtain the creep behavior by tracking the change (δL) in the chain’s end-to-end length in the direction parallel with F, as a function of Monte-Carlo time (t). Once δL reaches a steady state, the force is incremented by δF and the creep response of the chain is recalculated.
All calculations are carried out for the chain inside a tube of a square cross-section with side lengths equal to d = 1.25b0 and of the axial length much greater than Nb0, for N ranging from 24 to 27, M = 10 and R = 1.5b0×0.75b0×0.75b0. We choose a square-shaped tube to simplify numerical calculations. Following initial simulations, final calculations are carried out using the following arbitrary chosen non-dimensional parameter values b0 = 1, θ0 = 3π/4, K1 = 160, K2 = 512, Kθ = 3, m = 1,000, for non-dimensional δF = 20. These parameter values were not entirely physically based. Similar parameter values were used in the 2D chain model since they provided a stable numerical procedure [24]. In order to compare results between the 3D and 2D simulations, we use here the same parameter values. We have also shown previously in the 2D model that varying M and R has a little effect on the creep curves [24]. At each δF the creep behavior is simulated over sufficient number of Monte-Carlo steps (106) for the chain to reach a steady state regime. For the case of an unstretched chain, which does not equilibrate within 106 Monte-Carlo steps, we shorten the equilibration process by applying a unit force (δF = 1) to the unstretched chain. Once the chain reaches the steady state, we increase the force by δF = 19. From there on, all subsequent forces are incremented at δF = 20. Final calculations are carried out for nine force steps, i.e., for F0 ranging from 1 to160. Since F0 corresponding to δF = 1 equals unity, which is much smaller than the subsequent steps, we approximate the initial F0 ≈ 0. Calculations are carried out assuming that kBT equals unity. In order to smooth out numerical noise, creep simulations for a single chain are repeated n times, where n generally depends on the chain length (i.e., on N), and the average creep curve is obtained.
Results
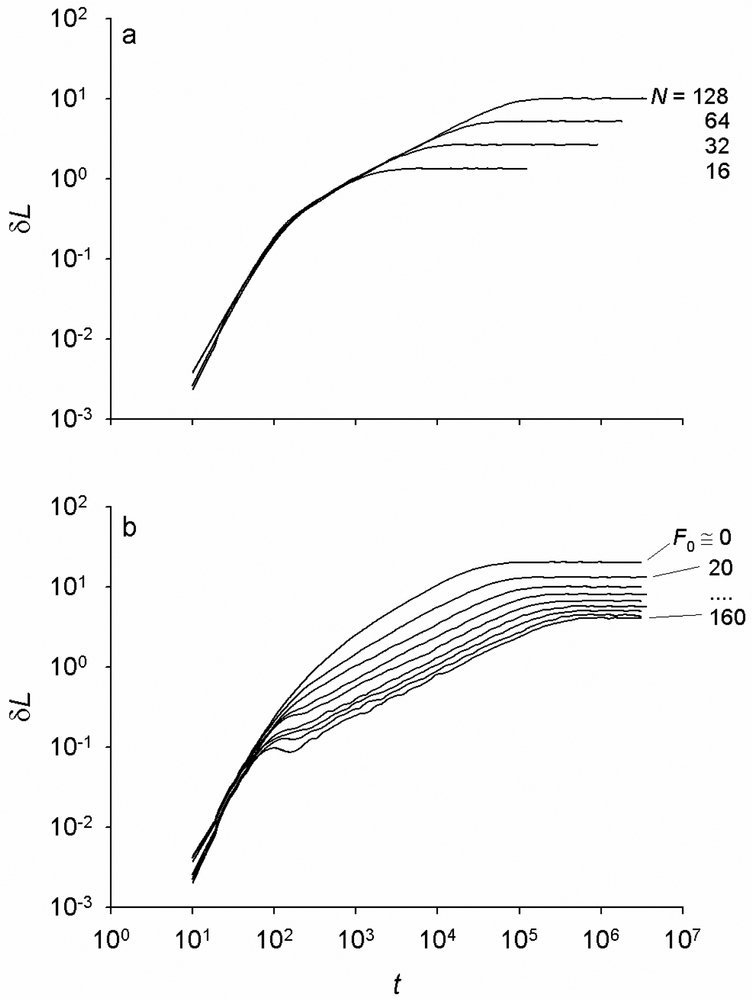
For a given F0, the simulated creep curves of the chain are characterized by three distinct regimes: an initial fast creep, followed by a slow power-law regime ~tα, which crosses over to a steady state (Fig. 2a). This behavior is the same for chains of different N (i.e., different initial contour lengths), only the duration of the power-law creep increases with increasing N. For a given N, the three creep regimens change with increasing F0 as follows. The initial creep response changes little for F0 ≤ 80, but for F0 > 80 one can observe small oscillations (“ringing” effect) near the end of the initial creep regime (Fig. 2b), indicating that the lumped mass at the end bonds is no longer critically damped (see next section for explanation). The power-law creep rate decreases with increasing F0 such that the creep curves exhibit a splay, while the duration of the power-law creep increases with increasing F0 (Fig. 2b). At the steady-state, the value of δL decreases with increasing F0 (Fig. 2b).
Fig. 2.
a) The creep response of single chains of increasing number (N) of bonds. The creep curves are given as the average change in end-to-end length δL as a function of time (t), where δL corresponds to the length change relative to the previous step, and are calculated for N = 24 -27 and prestress F0 = 20. The creep is characterized by three distinct time regimes: an initial fast response, a power-law intermediate-time response, and a steady state. The duration of the power-law creep regime increases with increasing N, whereas the short time response is not affected. b) The average creep responses, ⟨δL⟩ vs. t, of internal segments of a chain of N = 128 bonds for F0 of 1, 20, 40, 60,…160. The rate of creep slows down with increasing F0 such that the curves exhibit splay with increasing F0. Curves are means from n = 400, 200, 100 and 50 simulations for N = 16, 32, 64, and 128, respectively.
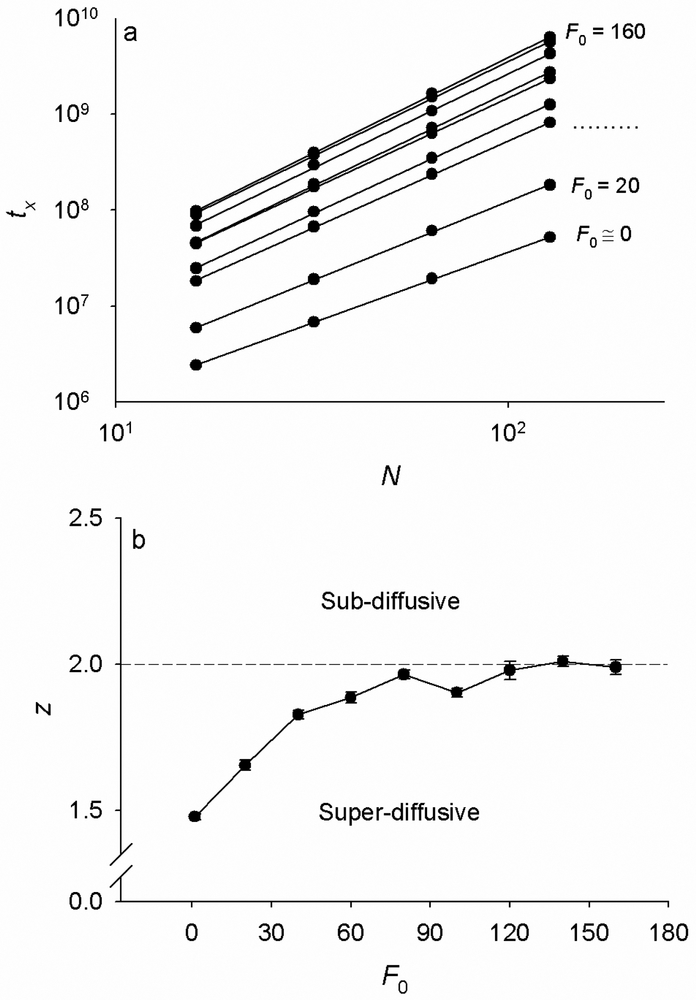
To quantify the duration of the power-law creep regime, we calculate the crossover times (tx) between the power-law and the steady-state regimes as follows. For a given F0, the exponent α is first estimated by fitting the power-law portion of the creep curve of the longest chain with a function Atα, where A is a constant. This power-law regime is common to the creep curves corresponding different chain lengths (i.e. different N) at the same F0 (Fig. 2a). For each N, the steady-state value of the chain’s extension δLx(N), is then estimated by fitting the steady-state portion of the δL vs. t relationship. The cross over time tx is then estimated as the time at which , for each N = 24…27 and each F0 = 0…160. We find that tx increases with increasing N as a power law, tx ∝ Nz (Fig. 3a), with a scaling exponent z that increases with increasing F0 from z ≈ 1.5 at F0 = 1, and saturates at z ≈ 2 for F0 ≥ 120 (Fig. 3b). This exponent is indicative of the dynamics of the chain’s thermal fluctuations at thermodynamic equilibrium; when z = 1 the dynamics is wave propagation-dominated and when z = 2 it is diffusion-dominated [28].
Fig. 3.
a) The crossover time (tx) between the creep regime and the steady state regime for curves of N = 24 -27 and F0 = 1, 20, 40,…160. tx increases with N according to a power law tx ~ Nz. Dots are averages from n = 400, 200, 100 and 50 simulations for N = 16, 32, 64, and 128, respectively and lines are best fits. b) Exponents z increases with increasing F0 and saturates at the z = 2. The dashed line at z = 2 separates superdiffusive from subdiffusive dynamics. SD bars are fitting errors for the z-exponent from Fig. 3a.
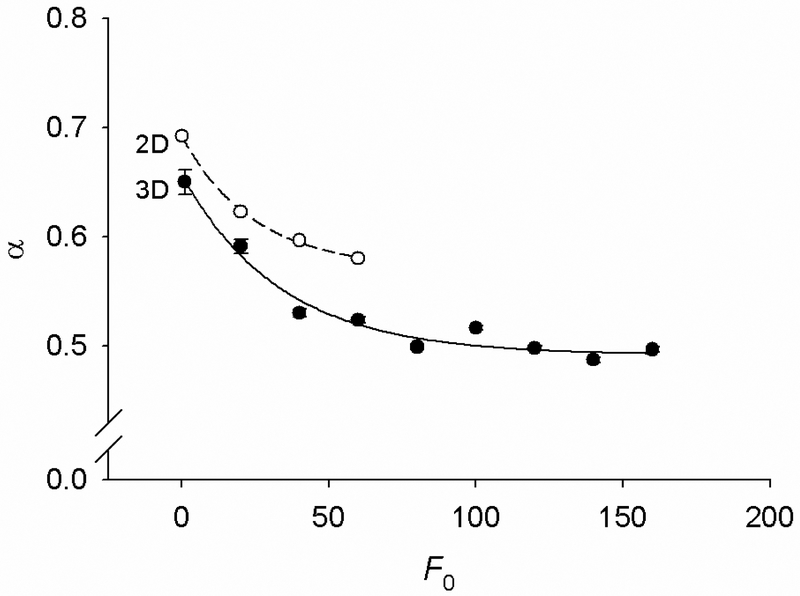
The log-log slopes (i.e., α) of the power-law creep curves decrease with increasing F0 (Fig. 2b). To quantify this dependence, we obtain α as a function of F0 from fitting the power-law portions of the creep curves as described above. We find that α decreases nearly hyperbolically with increasing F0 (Fig. 4). This is qualitatively consistent with the decrease in the power-law exponent with increasing prestress as observed in living cells [5]. A similar dependence was also obtained with the 2D model [24], although the values of α for the 2D model are somewhat higher and the rate of decrease of α with increasing F0 is somewhat lower than those for the 3D model over the same range of F0 (Fig. 4). Quantitatively, the values of α obtained from both models are at least a factor of two greater than the values obtained from experiments on living cells [1-8]. A possible reason for this discrepancy is that values of α from the model depend on the choice of model parameters. For example, if we hold all parameters fixed and only vary kBT, α can be brought into the range of experimentally observed values by lowering kBT. On the other hand, values of α in Fig. 4 are consistent with values obtained from in vitro measurements on crosslinked, myosin-activated purified actin networks [29]. Those data show that with increasing tension in actin filaments due to myosin activation, α of the network decreases within the range of values bounded by 0.75 (no tension) and 0.5 (high tension). This, in turn suggests that the chain model also can describe rheology of actin networks in vitro.
Fig. 4.
The power-law creep exponent (α) decreases with increasing F0; solid symbols correspond to the dimensional (3D) chain model and open symbols to the two-dimensional (2D) chain model. The values of α are obtained by fitting the power-law regime of creep curves by Atα. Ford the 3D chain dots are averages from n = 50 runs for N = 128; SD bars are fitting errors of α. For the 2D chain, n = 5 and N = 350 bonds.
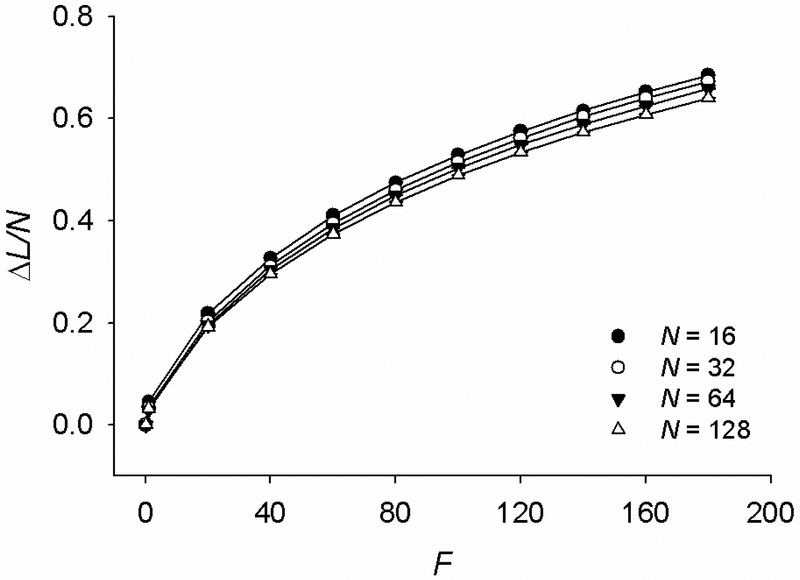
Using the data from the steady-state regime (Fig. 1b), we calculate the extension (ΔL) vs. applied force (F) relationships for chains of N = 24-27 bonds, where ΔL is the end-to-end length change in the direction of F from its unstretched value. By scaling ΔL with N, we obtain ΔL/N vs. F curves that show a stiffening behavior (Fig. 5). Importantly, these curves exhibit little dependence on N, indicating that the stiffening is only mildly dependent on the chain’s initial contour length.
Fig. 5.
At steady state, the chain exhibits stiffening behavior with increasing stretching force (F) which is little dependent on the number of bonds N. ΔL is change in the end-to-end length in the direction of F from the unstretched end-to-end length. Data are means ±SD from n = 400, 200, 100 and 50 simulations for N = 16, 32, 64, and 128, respectively.
Physical Interpretations of the Numerical Results
Origins of the Creep Response
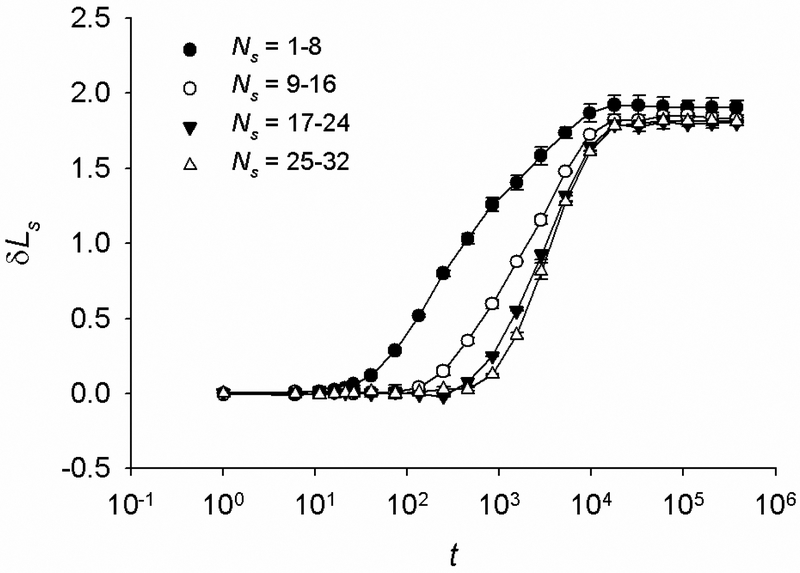
The initial creep regime is determined by the viscoelastic properties of the chain’s end bonds, which are a spring-dashpot-lumped mass system. Thus, the initial creep response is the same for all chains, regardless of their contour lengths (i.e., regardless of the number of bonds N) (Fig. 2a). The power-law creep regime, however, includes contributions from all bonds in the chain and thus it depends on N. The power-law creep is possible only when T > 0. If T → 0, the probability Π → 0 and the chain would oppose δF only by elastic forces arising instantaneously from the deformation of its bonds and joints, i.e., there will be no creep except in the end-bonds due to the presence of the dashpots. If, however, T > 0, then Π > 0 and the chain will develop elastic forces over a finite time interval since the disturbance caused by δF would travel with a finite speed from the chain’s end points towards the center of the chain. The speed of this disturbance would fluctuate along the chain due to the continuous thermal bombardment of the joints, which makes their movement probabilistic. Segments of the chain closer to the center should have longer delays of the onset of creep than those at the ends. To examine this, we calculate the creep response of chain’s internal segments of an equal number (Ns) of bonds. We find that the outer segments begin to creep earlier than the segments closer to the center of the chain (Fig. 6). We quantify the creep of the internal chain’s segments by fitting the segmental creep curves with the following function in the semi-log domain using a least squares method
| (2) |
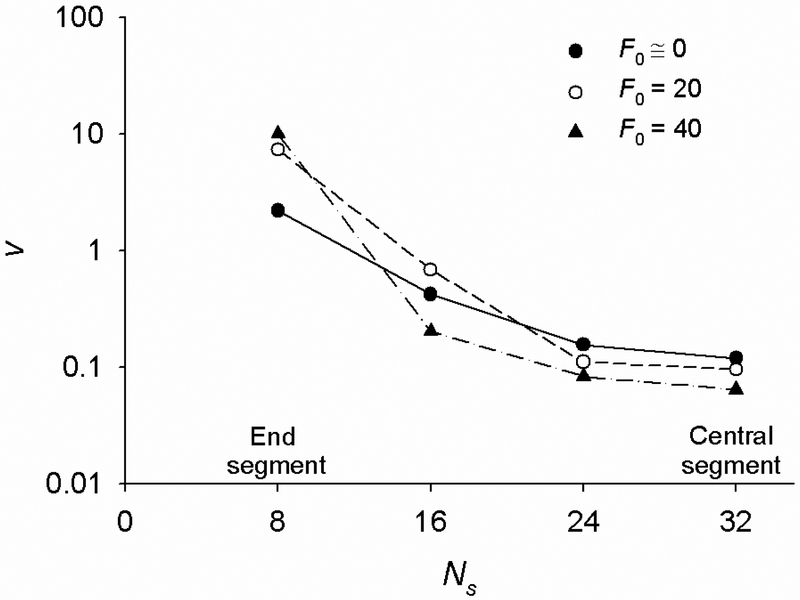
where δLs is a change in the segment’s end-to-end length and h, β and τ are free parameters. With the obtained values of h, β and τ, we calculate the delayed onset of creep (td) defined as the time that corresponds to δLs equal to 1% of its steady state value. From the contour length of the segments and td we then calculate the mean speed (v) of propagation of the disturbance along the chain as the ratio of the two. We find that v decreases from the end segments towards the central segment of the chain, indicative of slowing down the propagation of the disturbance along the chain (Fig. 7). A possible explanation for this slowing down is as follows. When an external force δF is applied to the chain’s end-points, elastic forces do not simultaneously develop in all bonds. Instead, due to the damping effect of the thermal bombardment of the joints the elastic forces first develop in the end segments, then in the next pair of segments and so on, until they finally develop in the central segments. This creates a force gradient in each segment and this gradient decreases from the end bonds towards the center of the chain. As a result, the propagation speed of the disturbance decreases.
Fig. 6.
Average creep curves (δLs vs. t) of internal segments of a chain (N = 64), starting from end bonds towards center of the chain for F0 = 0. The chain contains 8 bonds; Ns denotes the range of bond numbers for a given segment; Ns = 1 and 64 of the two end bonds Ns = 32 and 33 are the bonds at the center of the chain. Because of symmetry, results are shown only for half of the chain. The onset of creep is delayed in the segments closer to the center of the chain. Points are average values ± SD from n = 200 simulations; lines are best fit of Eq. (2).
Fig. 7.
The mean propagation speed (v) of a mechanical disturbance decreases from the endpoints towards the center of the chain. v is calculated from the data in Fig. 6. Results are shown only for half of the chain where Ns = 8 corresponds to the outer segment and Ns = 32 is segment at the center of the chain. Increasing tension (F0) causes v to increase in the outer segment and to decrease in the internal segments.
Superposition of these delayed creep responses of the chain’s internal segments leads to the global power-law behavior of the chain. This global creep response reaches a new steady state when the chain’s central segment reaches the steady state. In the new steady state, the chain is characterized by lower entropy, higher internal energy, and hence increased free energy, compared to the previous steady state. Thus, the creep is associated with the gradual propagation of the free energy from the end-bonds toward the center of the chain.
Effects of the Prestress
Our numerical simulations show that all three creep regimens: the initial creep, the power-law creep and the steady state are influenced by F0. Potential mechanisms for these influences are discussed below.
The “ringing” effect in the initial creep response (Fig. 2b) is explained as follows. An increase in F0 causes an increase in the effective bond stiffness due to the bond’s nonlinear elasticity. On the other hand, increasing F0 does not affect the coefficient of viscous damping of the dashpot in the end bonds that remains constant and equal to , which is equivalent to the critical damping of a linear spring of stiffness K1. Since the apparent stiffness of the end bonds increases while their damping coefficient does not change with increasing F0, the end bonds become under damped, which produces the observed ringing.
The splay in the power-law creep curves (Fig. 2b) is explained as follows. Since the chain exhibits stiffening at the steady state (Fig. 5), this implies that in response to increasing F0 in equal step increments δF, the corresponding steady-state values δLx systematically decrease. Since the initial creep response exhibits little dependence on F0, this decrease in δLx with increasing F0 causes the power-law creep curves to splay and the creep-rate and α to decrease. Thus, the nonlinear stiffening behavior of the chain is essential for the decrease of α with increasing F0 (Fig. 4).
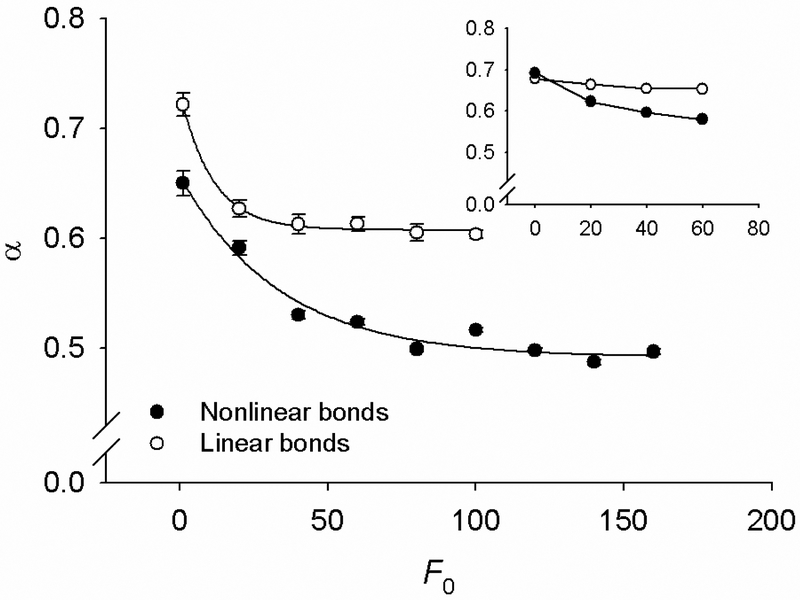
To understand the relative contributions of the entropic changes versus nonlinear bond elasticity to the creep behavior, we calculate creep curves for chains with nonlinearly elastic and linearly elastic bonds (i.e., K2 = 0), while keeping all other model parameters unchanged. Since the bond stiffness is constant in the chain with linearly elastic bonds, the global chain stiffening should only reflect the decreasing entropy of the chain during stretching. We find that in the chain with linearly elastic bonds α still decreases with increasing F0 but to an extent much less than in the equivalent chain with nonlinearly elastic bonds (Fig. 8). We attribute this difference to the contribution of nonlinear elasticity of the bonds. Importantly, in a 2D model with linearly elastic bonds α exhibits very little dependence on F0 (Fig. 8, inset). This suggests that the entropic effects in the 2D model are less important for the α vs. F0 relationship than in the 3D model. A possible reason for this difference is that at a given F0, the number of conformational possibilities in the 2D chain is much smaller than in the 3D chain.
Fig. 8.
Comparison of the α vs. F0 relationship for the chain with nonlinearly elastic bonds (solid symbols) and the equivalent chain with linearly elastic bonds (open symbols). Dots are averages from n = 50 chains of N = 128 bonds; SD bars are fitting errors of α. Inset: Data for 2D chain (n = 5, N = 350).
An increase in F0 causes the disturbance propagation speed v to increase in the end segments and to decreases in the internal segments (Fig. 7). This indicates that in a more tensed chain a disturbance that travels along the chain reaches the central segment with a greater delay than in a less tensed chain, which explains why the crossover time tx increases with increasing tension (see Fig. 3a). This is different than in the 2D model, where v increases with increasing F0 over the entire chain length such that tx remains virtually independent on F0. We interpreted this increase in v in the 2D model as a wave-propagation phenomenon; since increasing F0 causes the chain to stiffen, then a wave-propagating disturbance should travel faster along a stiffer chain than along a less stiff chain [24]. However, the disturbance propagation dynamics in the 3D chain is more complex than in the 2D chain as described below.
Our simulations show that the exponent z, indicative of chain’s steady-state dynamics, increases with increasing F0 and reaches a saturating value of z = 2 (Fig. 3b). Thus, the chain dynamics is driven by faster than diffusive processes at low F0 and diffusive processes at high F0 (Fig. 3b) and that with increasing F0 the chain dynamics switches from the wave propagation-dominated (z = 1) to the diffusion-dominated (z = 2) behavior. This is different from what was observed in the 2D model where z < 2 and independent of F0, indicating that the chain dynamics was wave propagation-dominated [24]. Since z reflects dynamics of the chain’s thermal fluctuations at equilibrium, it must satisfy the generalized Stokes-Einstein relationship, i.e., z = 1/α [cf. 30]. Indeed, our results for the 3D chain show that this relationship holds for different levels of F0 (Fig. 9).
Fig. 9.
Exponents z and α are reciprocal indicating that the chain dynamics conforms to the generalized Stokes-Einstein equation. The data are obtained from the crossplot of z vs. F0 (Fig. 3b) and α vs. F0 (Fig. 4) relationships. The solid line is z = 1/α given for comparison.
Seifert et al. [31] and Obermayer et al. [32] studied the effect of prestress on the dynamics of semiflexible chains using inextensible deterministic chain models. They found that the propagation speed of the disturbance caused by chain stretching decreases from the endpoints towards the central region of the chain and that this decrease is faster in prestressed than in unprestressed chains, which is consistent with our results (Fig. 7). They also found that with increasing prestress the propagation speed of the disturbance changes from subdiffusive to diffusive, whereas our results show that increasing prestress leads to transition from superdiffusive to diffusive behavior (Fig. 3b). Since with increasing prestress our chain model stiffens (Fig. 5), it becomes less extensible and therefore its behavior is close to that of the inextensible chain models. However, at low prestress, in our model the propagation speed is determined by both stretching and bending mechanisms, whereas in the inextensible continuum models it is determined only by bending. Furthermore, our model takes into account the effect of thermal fluctuations during disturbance propagation whereas in the inextensible chain models this contribution is ignored. Taken together, these differences between the two models are the likely cause of the different dynamic behaviors at low prestress.
Application to Cytoskeletal Mechanics
We show that our chain model can describe the power-law creep response and its dependence on the prestress in a manner that is consistent with the observed behaviors of living cells. Whether these results are quantitatively consistent with timescales at which the power-law is observed in cells and with lengthscales of the cytoskeletal ultrastructure remains to be addressed. We first consider our results in light of previously reported data for creep behavior of an individual actin filament pulled by magnetic tweezers from an actin gel [33]. It was found that the creep behavior of the pulled filament exhibits two regimes: an initial fast creep (0-1 s), followed by a slow creep (~1-3 s). However, due to the short duration of the experiments (~3 s) it is not possible to establish whether or not the slow creep regime follows a power-law, and hence we are unable to compare it with the power-law regime of our model. Instead, we compare the duration of the initial creep regime from the experiments (0-1 s) with the duration of the initial creep regime of the 3D chain model (~100 Monte Carlo time units). From this comparison, we calculate a time scaling factor that we use to estimate the duration of the power-law creep of the model. We obtain that for a chain of N = 60 bonds, the power-law creep lasts ~10 s, which is consistent with the power-law timescale in creep observed in living cells [6, 34]. However, this estimate should be taken with caution since the experimental creep data include combined contributions of viscoelasticity of the pulled actin filament and of the gel from which the filament was pulled. The latter is not included in our model.
Experiments on living cells also show that over longer timescales, the power-law creep regime changes to another, stronger time-dependent power-law regime and that these two regimes are often separated by a plateau region [34-36], indicating that the creep behavior of cells is timescale dependent. While our chain model exhibits a power-law creep over a finite time interval, whose length depends on the chain’s length (Fig.1a), it cannot explain the emergence of the second power-law creep regime. It is possible that in living cells the two separate power-law regimes correspond to two different cytoskeletal polymer structures (e.g., actin and intermediate filament networks) which contribute to the overall rheological behaviors at different timescales.
Our choice of N = 60 bonds in the above calculations is based on the fact that the bond length of actin polymers is 5-10 nm [37, 38] and therefore 60 bonds would correspond to the chain’s contour length of ~300-600 nm, which is approximately the length of cytoskeletal actin filaments [39]. However, this length is much smaller than the persistence length of actin filaments, (~17 μm) [40], suggesting that conformational changes of cytoskeletal actin filaments have a minor effect on the rheological properties of the cell. Furthermore, tensile tests on isolated actin filaments show that in the physiological range of forces filaments whose lengths are close to their cytoskeletal length exhibit a linear elastic (i.e. constant stiffness) behavior, whereas longer filaments exhibit stiffening behavior that precedes the linear regime as a result of entropic effects [41]. Thus, the length of cytoskeletal actin filaments is too short for the individual filaments to exhibit stiffening behavior which, according to our model, is essential for linking the power-law exponent to the prestress. Importantly, data from in vitro rheological measurements on crosslinked purified actin gels, where actin filaments were shortened close to their length within the CSK, show that their power-law exponent α is quantitatively similar to the values obtained for living cells [42]. On the other hand, data from actin gels where filament lengths are close to their persistence length have higher values of α, similar to those predicted by our model [29]. Taken together, those findings suggest that only in actin networks where filament lengths are on the order of their persistence length the rheological response of the network is primarily determined by the rheological responses of individual filaments. In actin networks where filament lengths are shorter than their persistence length and close to the length they have within the CSK of living cells, the rheological response of the network appears to be determined by the deformability of the whole network, not of individual filaments. Thus, future work should incorporate our chain model into a network in order to obtain better insight into relative contributions of conformational changes of individual chains to the network rheological behaviors.
Other important cytoskeletal semiflexible filamentous biopolymers are intermediate filaments. Unlike actin filaments, their persistence length (<1 μm) is substantially smaller than their typical length in living cells (~15 μm), and they exhibit elastic stiffening behavior in the physiological range of tension [43]. Thus, they are likely to contribute to the cell’s viscoelasticity via their conformational changes and their nonlinear elasticity in a manner described by our model. However, experimental evidence for this contribution is currently lacking.
Measurements of spontaneous motions of CSK-bound cell-surface tracer particles in living cells show that that over short time scales (<1 s) cytoskeletal dynamics is subdiffusive and that over longer timescales (>1 s), it is to superdiffusive [16]. The dynamics of the chain’s steady-state fluctuations exhibit superdiffusive to diffusive behaviors over timescales which coincide with the power-law creep (>100 Monte Carlo time units which corresponds to >1 s). Experiments also show that over short timescales (<1 s) cytoskeletal dynamics is consistent with the generalized Stokes-Einstein relationship, whereas over longer timescales (>1 s) this relationship breaks down in living cells, indicating that fluctuations in the CSK are driven by non-thermal, possibly ATP-related energy [16, 44]. This long-time behavior is inconsistent with our model’s prediction that the generalized Stokes-Einstein relationship holds for all timescales (Fig. 9). The reason for this discrepancy is the model assumption that the chain dynamics is driven only by thermal agitations and not by other energetic processes (e.g., ATP related processes, polymerization and depolymerization, interaction with other cytoskeletal molecules, etc.) which are present in living cells.
Concluding Remarks
Our discrete WLC model of a semiflexible polymer provides a link between the power-law rheology and mechanical prestress. It shows that for this relationship it is critical that under tension the chain at the steady-state exhibits a stiffening behavior, which originates from both entropic and enthalpic contributions. The model also reveals that the power-law creep is a result of gradual stretching-induced propagation of the free energy from the ends to the center of the chain. Based on qualitative similarities between model simulations and experimental data from living cells and actin gels, it is conceivable that the mechanisms embodied in our model may also be key determinants of the overall viscoelastic properties of the CSK and of actin gels.
Acknowledgements
This study is supported by NIH Grants HL-33009, HL-059215, Coulter Foundation Grant and a grant from FAPESP (Brazil).
References
- 1.Fabry B, Maksym GN, Butler JP, Glogauer M, Navajas D, and Fredberg JJ, Phys. Rev. Lett 87, 148102 (2001). [DOI] [PubMed] [Google Scholar]
- 2.Fabry B, Maksym GN, Butler JP, Glogauer M, Navajas D, Taback NA, Millet EJ, and Fredberg JJ, Phys. Rev. E 68, 041914, (2003). [DOI] [PubMed] [Google Scholar]
- 3.Rosenblatt N, Hu S, Chen J, Wang N, and Stamenović D, Biochem. Biophys. Res. Commun 321, 617 (2004). [DOI] [PubMed] [Google Scholar]
- 4.Trepat X, Grabulosa M, Puig F, Maksym GN, Navajas D, and Farré R, Am. J. Physiol. Lung Cell Mol. Physiol 287, L1025 (2004). [DOI] [PubMed] [Google Scholar]
- 5.Stamenović D, Suki B, Fabry B, Wang N, and Fredberg JJ, J. Appl. Physiol. 96, 1600 (2004). [DOI] [PubMed] [Google Scholar]
- 6.Lenormand G, Millet E, Fabry B, Butler JP, and Fredberg JJ, J. R. Soc. Lond. Interface 1, 91 (2004). [DOI] [PMC free article] [PubMed] [Google Scholar]
- 7.Smith BA, Tolloczko B, Martin JG, and Grütter P, Biophys. J 88, 2994 (2005). [DOI] [PMC free article] [PubMed] [Google Scholar]
- 8.Deng L, Trepat X, Butler JP, Millet E, Morgan KG, Weitz DA, and Fredberg JJ, Nature Mater. 5, 636 (2006). [DOI] [PubMed] [Google Scholar]
- 9.Hoffman BD, Massiera G, Van Citters KM, and Crocker JC, Proc. Natl. Acad. Sci. USA 103, 10259(2006). [DOI] [PMC free article] [PubMed] [Google Scholar]
- 10.MacKintosh FC, Käs J, and Janmey PA, Phys. Rev. Lett 75, 4425 (1995). [DOI] [PubMed] [Google Scholar]
- 11.MacKintosh FC, and Janmey P, Curr. Opin. Solid State Mater. Sci 2, 350 (1997). [Google Scholar]
- 12.Gittes F, and MacKintosh FC, Phys. Rev. E 58, R1241 (1998). [Google Scholar]
- 13.Morse DC, Macromolecules 31, 7044 (1998). [Google Scholar]
- 14.Sollich P, Phys. Rev. E 58, 738, (1998). [Google Scholar]
- 15.Gunst SJ, and Fredberg JJ, J. Appl. Physiol 95, 413 (2003) [DOI] [PubMed] [Google Scholar]
- 16.Bursae P, Lenormand G, Fabry B, Oliver M, Weitz DA, Viasnoff V, Butler JP, and Fredberg JJ, Nature Mater. 4, 557 (2005). [DOI] [PubMed] [Google Scholar]
- 17.Trepat X, Deng L, An SS, Navajas D, Tschumperlin DJ, Gerthoffer W, Butler JP, and J Fredberg J, Nature 441, 592 (2007). [DOI] [PMC free article] [PubMed] [Google Scholar]
- 18.Ingber DE, J. Cell Sci 116, 1157 (2003). [DOI] [PubMed] [Google Scholar]
- 19.Stamenović D, Acta Biomater 1, 255 (2005). [DOI] [PubMed] [Google Scholar]
- 20.Fernández P, Pullarkat PA, and Ott A, Biophys. J 90, 3796 (2006). [DOI] [PMC free article] [PubMed] [Google Scholar]
- 21.Gardel ML, Nakamura F, Hartwig JH, Crocker JC, Stossel TP, and Weitz DA, Proc. Natl. Acad. Sci. USA 103, 1761 (2006). [DOI] [PMC free article] [PubMed] [Google Scholar]
- 22.Kroy K, and Glaser J, New J. Phys 9, 416 (2007) [Google Scholar]
- 23.Semmrich C, Storz T, Glaser J, Merkel R, Bausch AR, and Kroy K, Proc. Natl. Acad. Sci. USA 104, 20199 (2007). [DOI] [PMC free article] [PubMed] [Google Scholar]
- 24.Rosenblatt N, Alencar AM, Majumdar A, Suki B, and Stamenović D, Phys. Rev. Lett 97, 168101, (2006). [DOI] [PubMed] [Google Scholar]
- 25.Doi M, and Edwards SF, The Theory of Polymer Dynamics (Clarendon Press, Oxford, UK, 1986). [Google Scholar]
- 26.Metropolis N, and Ulam S, J. Am. Stat. Assoc 44, 335 (1949). [DOI] [PubMed] [Google Scholar]
- 27.Alencar AM, Wolfe E, and Buldyrev SV, Phys. Rev. E 74, 026311 (2006). [DOI] [PubMed] [Google Scholar]
- 28.Bouchaud J-P, and Georges A, Phys. Rep 195, 127, (1990) [Google Scholar]
- 29.Mizuno D, Tardin C, Schmidt CF, and MacKintosh FC, Science 315, 370 (2007). [DOI] [PubMed] [Google Scholar]
- 30.Chaikin PM, and Lubensky TC, T. C. (1995) Principles of Condensed Matter Physics (Cambridge University Press, New York, 1995). [Google Scholar]
- 31.Seifert U, Wintz W, and Nelson P, Phys. Rev. Lett 77, 5389 (1996). [DOI] [PubMed] [Google Scholar]
- 32.Obermayer B, Hallatschek O, Frey E, and Kroy K, Eur. Phys. J 23, 375 (2007). [DOI] [PubMed] [Google Scholar]
- 33.Dichtl MA, and Sackmann E, Proc. Natl. Acad. Sci. USA 99, 6533 (2002). [DOI] [PMC free article] [PubMed] [Google Scholar]
- 34.Overby DR, Matthews BD, Alsberg E, and Ingber DE, Acta Biomater 1, 295 (2005). [DOI] [PubMed] [Google Scholar]
- 35.Desprat N, Richert A, Simeon J, and Asnacios A, Biophys. J 88, 2224 (2005). [DOI] [PMC free article] [PubMed] [Google Scholar]
- 36.Stamenović D, Rosenblatt N, Montoya-Zavala M, Matthews BD, Hu S, Suki B, Wang N, and Ingber DE, Biophys. J 93, L39 (2007). [DOI] [PMC free article] [PubMed] [Google Scholar]
- 37.Kierfeld J, Niamploy O, Sa-yakanit V, and Lipowsky R, Eur. Phys. J. E 14, 17 (2004). [DOI] [PubMed] [Google Scholar]
- 38.Livadaru L, Netz RR, and Kreuzer HJ, Macromolecules 36, 3732 (2004). [Google Scholar]
- 39.Medalia O, Weber I, Frangakis AS, Nicastro D, Gerisch G, and Baumeister W, Science 298, 1209 (2002). [DOI] [PubMed] [Google Scholar]
- 40.Gittes F, Mickey B, Nettleton J, and Howard J, J. Cell Biol 120, 923 (1993). [DOI] [PMC free article] [PubMed] [Google Scholar]
- 41.Liu X, and Pollack GH, Biophys. J 83, 2705–2715(2002). [DOI] [PMC free article] [PubMed] [Google Scholar]
- 42.Gardel ML, Nakamura F, Hartwig J, Crocker JC, Stossel TP, and Weitz DA, Phys. Rev. Lett 96, 088102 (2006). [DOI] [PubMed] [Google Scholar]
- 43.Fudge DS, Gardner KH, Forsyth VT, Riekel C, and Gosline JM, Biophys. J 85, 2015 (2003). [DOI] [PMC free article] [PubMed] [Google Scholar]
- 44.Lau AWC, Hoffman BD, Davies A, Crocker JC, and Lubensky TC, Phys. Rev. Lett 91, 198101 (2003). [DOI] [PubMed] [Google Scholar]


