

Abstract
Background
Although it has been postulated for many years that depression is associated with loss of synapses, primarily in the hippocampus, and that antidepressants facilitate synapse growth, we still lack ultrastructural evidence that changes in depressive behavior are indeed correlated with structural synaptic modifications.
Methods
We analyzed hippocampal spine synapses of male rats (n=127) with electron microscopic stereology in association with performance in the learned helplessness paradigm.
Results
Inescapable footshock (IES) caused an acute and persistent loss of spine synapses in each of CA1, CA3, and dentate gyrus, which was associated with a severe escape deficit in learned helplessness. On the other hand, IES elicited no significant synaptic alterations in motor cortex. A single injection of corticosterone reproduced both the hippocampal synaptic changes and the behavioral responses induced by IES. Treatment of IES-exposed animals for six days with desipramine reversed both the hippocampal spine synapse loss and the escape deficit in learned helplessness. We noted, however, that desipramine failed to restore the number of CA1 spine synapses to nonstressed levels, which was associated with a minor escape deficit compared to nonstressed controls. Shorter, one-day or three-day desipramine treatments, however, had neither synaptic nor behavioral effects.
Conclusions
These results indicate that changes in depressive behavior are associated with remarkable remodeling of hippocampal spine synapses at the ultrastructural level. Because spine synapse loss contributes to hippocampal dysfunction, this cellular mechanism may be an important component in the neurobiology of stress-related disorders such as depression.
Keywords: corticosterone, desipramine, synaptic plasticity, electron microscopic stereology, depression, stress
Introduction
Depression is a devastating illness with an estimated lifetime prevalence of 17% in the United States (1). It is a leading cause of disability worldwide, bringing about considerable loss of life by suicide (2), as well as being a risk factor for cardiovascular disease (3) and a multitude of neurological disorders, including dementia (4; 5). Despite intensive research on the neurobiology of depression and mechanisms of antidepressant action, current clinical management of the disease remains limited (6).
Evidence for hippocampal atrophy in depressed patients (7-9), as well as derailment of many hippocampus-related functions in depression (10-12) indicates that the hippocampus is critically involved in the disease (13). It has been postulated for many years that hippocampal dysfunction in depression is related to loss of dendritic spine synapses of principal cells (14-16). The spine synapse is the most abundant and a highly plastic form of synapses in the hippocampus; it is considered a unit of information processing and represents a point of connectivity between principal neurons (17). Previous studies have confirmed that hippocampal spine synapse remodeling indeed occurs in response to stress and depression (18; 19). However, there are many conflicting reports regarding the nature, hippocampal distribution, and functional significance of these synaptic changes, which may be explained by the fact that most of the earlier studies have used indirect, light-microscopic approaches to analyze synaptic plasticity.
To address these issues, here we use electron microscopy, a technique that provides sufficient resolution to visualize synaptic specializations, to investigate hippocampal spine synapses in association with behavioral changes in the rat learned helplessness (LH) model of depression and antidepressant response.
Materials and methods
Adult male Sprague-Dawley rats (n=127, 200-250 g; Charles River Laboratories, Wilmington, MA) were kept under standard laboratory conditions. The animals were group housed, maintained on a 12/12-h light/dark cycle, with tap water and regular rodent chow available ad libitum. All animal protocols used in this study were approved by the Institutional Animal Care and Use Committee of Yale University School of Medicine.
Learned helplessness
A standard LH paradigm was used as we published previously (20; 21). In this paradigm, an initial exposure to uncontrollable stress rapidly and profoundly disrupts the ability to acquire escape responses when animals are later placed in a situation in which stress is escapable. The behavioral dysfunction usually reaches a level where stressed animals do not even make an effort to escape the shock. In the case of rats, this escape deficit is reduced by subchronic (5-7 days) (21), but not acute, treatment with conventional antidepressants, such as fluoxetine or desipramine. Without treatment, however, the escape deficit may last up to several weeks. Testing was conducted in commercial shuttle boxes (Med Associates, St. Albans, VT) divided into two equal compartments by a central barrier. A computer-operated guillotine door built into the central barrier provided passage between compartments. Scrambled shocks were delivered to the grid floor consisting of stainless-steel rods (5 mm in diameter) placed 1.7 cm apart center-to-center. Inescapable footshock (IES) was administered in one side of shuttle boxes with the guillotine door closed (60 scrambled footshocks, 0.85 mA intensity, 15 s average duration, 60 s average inter-shock interval). This number and severity of IES presentation has been shown to be effective in inducing helpless behavior in rats (20; 21). Nonstressed control animals were exposed to the chambers but did not receive footshock (NS treatment). Helpless behavior was evaluated by analyzing performance in an active escape paradigm. Active escape testing consisted of 30 trials of escapable footshock (0.65 mA intensity, 35 s maximum duration, 90 s average inter-trial interval), with the guillotine door being opened at the time of shock onset. An initial five fixed ratio 1 trials, during which one shuttle crossing terminated the shock, was followed by 25 trials, when animals had to cross from one side of the shuttle box to the other, and then return, to terminate shock (fixed ratio 2 trials). Shock was terminated automatically if the response requirement was not met within 35 s. Escape latencies were recorded automatically for each trial by a computer. Escape latency represented the time it took for animals to escape shock; while in the case of escape failures, escape latency was set at 35 s. IES administration and active escape testing was done in a dimly lit room between 1000-1600 h.
Electron microscopic stereology
The number of spine synapses in CA1 stratum radiatum (CA1sr), CA3 stratum lucidum and radiatum (CA3sl/sr), dentate gyrus stratum moleculare (DGsm), as well as in layer II/III of motor cortex (MII/III) was calculated as published previously (22). Animals were perfusion fixed through the ascending aorta with a mixture of 4% paraformaldehyde and 0.1% glutaraldehyde dissolved in phosphate buffer (0.1M, pH 7.4). Brains were dissected out and postfixed overnight in the same fixative without glutaraldehyde. Throughout both the hippocampus and the motor cortex, 100-μm thick serial sections were cut in the coronal plane using a vibratome and systematically sorted into ten groups. Because there is a considerable overlap between the two structures, we analyzed the right-sided hippocampus together with the left-sided motor cortex and vice versa, the selection being randomized within each treatment group. One randomly selected group of sections from both structures was postfixed in 1% osmium tetroxide (40 min), dehydrated in ethanol (the 70% ethanol contained 1% uranyl acetate, 40 min), and flat embedded in Durcupan (Electron Microscopy Sciences, Fort Washington, PA) between slides and coverslips. Using these embedded sections, the volume of the sampling areas (CA1sr, CA3sl/sr, DGsm, and MII/III) was estimated utilizing the Cavalieri Estimator module of the Stereo Investigator® system (MicroBrightField, Villiston, VT) mounted on a Zeiss Axioplan 2 light microscope.
Thereafter, 20 sampling sites for electron microscopic analysis were localized in each sampling area using a systematic-random approach, as modified from MacLusky et al. (22) and illustrated in Figure 1. Blocks were assembled for ultracutting, trimmed, and approximately four 75 nm thick consecutive ultrasections were cut at each identified sampling site using a Reichert Ultracut E ultrotome. At each sampling site, digitized electron micrographs (Figure 2) were taken for the physical disector in a Tecnai-12 transmission electron microscope (FEI Company, Hillsboro, OR) furnished with a Hamamatsu HR/HR-B CCD camera system (Hamamatsu Photonics, Hamamatsu, Japan), at a final magnification of 11,000x. The disector technique requires picture pairs depicting identical regions in adjacent ultrasections, these identical regions being identified by landmarks, such as myelinated fibers, which do not change significantly between adjacent ultrasections due to their size. Prior to synapse counting, the pictures were coded for blind analysis. This sampling technique provided 20 disectors for each of CA1sr, CA3sl/sr, DGsm, and MII/III, i.e., 80 disectors per brain altogether.
Figure 1.

Schematic drawing illustrating our sampling scheme for electron microscopic stereology. We used a two-dimensional coordinate system with length (L) and height (H) axes. Using the same group of sections that underwent volume estimation previously, the length of CA1 stratum pyramidale was measured in each section and combined to create the L axis. Then, the L axis was divided by the number of desired sampling sites (L/20); and a random number (N) between 0 and L/20 was selected. The coordinate of the first sampling site on the L axis (L1) was localized at N μm, and the subsequent coordinates at L/20 μm apart (L2-L3, etc.), going along the L axis (the CA1 stratum pyramidale) in the direction of CA3 > subiculum and from rostral to caudal (dotted arrows). Subsequently, the height of CA1 stratum radiatum (CA1sr) was measured at each L axis sampling coordinate, along lines drawn perpendicular to stratum pyramidale (bold arrows). These 20 height measurements were then combined to create the H axis. Sampling sites along the H axis (H1-H3, etc.) were localized using the same method as described for the L axis above, going along the height measurement lines in the direction of stratum pyramidale > stratum lacunosum-moleculare and from rostral to caudal (dashed arrows). Shaded trapezoids demonstrate the approximate locations of tissue samples. This technique was repeated to localize sampling sites in the remaining sampling areas. CA3 stratum pyramidale, dentate gyrus stratum granulosum, and the brain surface represented L axes for CA3, dentate gyrus (DG), and motor cortex, respectively.
Figure 2.

High power representative electron micrograph depicting the CA1 stratum radiatum of a stressed desipramine-treated rat. Arrowheads point to examples of spine synapses. Abbreviations: s, spines; b, boutons; d, dendritic shafts. Scale bar, 500 nm.
Asymmetric spine synapses were counted according to the rules of the disector technique (23) within an unbiased counting frame superimposed onto each electron micrograph. Synapsing spines were identified by the presence of postsynaptic densities, as well as by the absence of mitochondria, microtubules, and synaptic vesicles. The average volumetric density (synapse/μm3) of spine synapses within each sampling area was then determined by dividing the sum of spine synapses counted in all samples taken from that particular sampling area by the disector volume. The disector volume was calculated by multiplying the area of the unbiased counting frame (79 μm2) by ultrasection thickness (average 75 nm) and by the number of disectors (20). Thus, the average disector volume, uniformly for each sampling area, was 237.6 μm3. Finally, the volumetric density of spine synapses was multiplied by the volume of the sampling area, determined earlier, to arrive at the total estimated number of spine synapses. The number of spine synapses was calculated independently by at least two different investigators (TH, AP, and CL); and the results were cross-checked to preclude systematic analytical errors.
Treatment group sizes for synapse counting
Because electron microscopic stereology is a time-consuming and labor-intensive method, we performed careful statistical power calculations to minimize the number of animals to be analyzed. In our earlier studies, standard deviation for spine synapse counts has been consistently in the range of 5-10% of the mean. Thus, assuming 8% standard deviation and n=3 animals per group in the experimental designs described below, ANOVA can detect about 25% change in the number of spine synapses with the desired 80% power at α=0.05. Because our initial observations (24) suggested that modifications in the number of spine synapses will potentially be larger than 25%, we set initial treatment group sizes at n=3.
Serum corticosterone measurements
Blood was collected and kept on ice. Samples were allowed to clot and then centrifuged to separate the serum that was stored at -20 °C until assayed. Serum total corticosterone (CS) concentration was measured using a Corticosterone EIA kit (Assay Designs, Ann Arbor, MI), according to manufacturer instructions.
Experimental design
Three different experiments were performed with treatment and testing schedules detailed in Table 1. Experiment 1 analyzed the effects of stress and antidepressant treatment on helpless behavior and remodeling of hippocampal spine synapses; Experiment 2 examined the temporal characteristics of the behavioral and the synaptic effects of desipramine (DMI); while Experiment 3 elucidated that CS reproduces both the behavioral and the synaptic responses to stress. We administered a 40 mg/kg dose of CS, mainly because many earlier studies investigating hippocampal morphological responses to stress hormones have also applied this particular dose (25-27). It is important to note that spine synapses and serum CS levels were analyzed at a time point that represents the beginning of active escape testing. Data from individual animals were used to determine group means (± S.E.M. for escape latency and ± S.D. for spine synapses and CS concentration). Escape latency, spine synapse, and CS measurements were analyzed by two-way ANOVAs (treatment × time effects for escape latency and CS concentration, and treatment × sampling area effects for spine synapses). Hippocampal spine synapse measurements in Experiment 3 were examined by three-way ANOVA (treatment × time × sampling area effects); and cortical spine synapses were evaluated by one-way ANOVA. We used the conservative Tukey post-hoc test for individual comparison of spine synapse and CS data. However, because behavioral measurements naturally show greater variability, the less conservative Student-Newman-Keuls post-hoc test was applied in LH experiments. A criterion for statistical confidence of p<0.05 was adopted.
Table 1.
Treatment and testing schedule of experiments. Abbreviations: CS, corticosterone; DMI, desipramine; IES, inescapable footshock; VEH, distilled water vehicle in Experiments 1 and 2, and propylene glycol vehicle in Experiment 3.
| Experiment 1: | |||
|---|---|---|---|
| Treatment Group | Day 1 | Days 2-7 | Day 8 |
| NS | No Stress | VEH, i.p. | Perfusion (n=3) |
| 1 ml/kg, 2x daily | Active Escape (n=10) | ||
| IES | IES | VEH, i.p. | Perfusion (n=3) |
| 1 ml/kg, 2x daily | Active Escape (n=10) | ||
| IES/DMI | IES | DMI, i.p. | Perfusion (n=3) |
| 10 mg/kg, 2x daily | Active Escape (n=11) | ||
| Experiment 2: | |||||
|---|---|---|---|---|---|
| Treatment Group | Day 1 | Day 2 | Day 3 | Day 4 | Day 5 |
| IES | IES | VEH, i.p. | VEH | VEH | Perfusion (n=3) |
| 1 ml/kg, 2x daily | Active Escape (n=8) | ||||
| IES/DMI-1d | IES | DMI, i.p. | Perfusion (n=3) | ||
| 10 mg/kg, 2x daily | Active Escape (n=8) | ||||
| IES/DMI-3d | IES | DMI, i.p. | DMI | DMI | Perfusion (n=3) |
| 10 mg/kg, 2x daily | Active Escape (n=8) | ||||
| Experiment 3: | |||
|---|---|---|---|
| Treatment Groups | Day 1 | Day 2 | Day 8 |
| NS-1d | No Stress + | Blood Sample (n=5) | |
| VEH, s.c, 2 ml/kg | Perfusion (n=3) | ||
| Active Escape (n=8) | |||
| NS-7d | No Stress + | Blood Sample (n=5) | |
| VEH, s.c, 2 ml/kg | Perfusion (n=3) | ||
| IES-1d | IES | Blood Sample (n=5) | |
| VEH, s.c, 2 ml/kg | Perfusion (n=3) | ||
| Active Escape (n=8) | |||
| IES-7d | IES + | Blood Sample (n=5) | |
| VEH, s.c, 2 ml/kg | Perfusion (n=3) | ||
| CS-1d | No Stress + | Blood Sample (n=5) | |
| CS, s.c, 40 mg/kg | Perfusion (n=3) | ||
| Active Escape (n=8) | |||
| CS-7d | No Stress + | Blood Sample (n=5) | |
| CS, s.c, 40 mg/kg | Perfusion (n=3) | ||
Results
Experiment 1: The effects of stress and antidepressant treatment on helpless behavior and remodeling of hippocampal spine synapses
Two-way ANOVA revealed a significant treatment effect on escape latencies (F2,165=30.376, p<0.001), but the treatment × time interaction effect was not significant (F10,165=0.541, p=0.859). Seven days following exposure to stress, escape latencies in IES animals increased severely, indicating the development of helpless behavior, compared to nonhelpless NS controls. IES/DMI animals showed a significantly improved escape performance compared to IES rats, but they still had a minor but significant escape deficit relative to NS controls (Figure 3, upper panel).
Figure 3.

Effects of inescapable footshock (IES) and desipramine (DMI) treatment on escape latencies in learned helplessness (upper panel) and on the number of hippocampal spine synapses (lower panel). Abbreviations: CA1sr, CA1 stratum radiatum; CA3sl/sr, CA3 stratum lucidum and radiatum; DGsm, dentate gyrus stratum moleculare; IES/DMI, treatment group consisting of stressed desipramine-treated animals; IES, treatment group containing stressed vehicle-treated rats; and NS, treatment group consisting of nonstressed vehicle-treated controls. Upper panel: This chart traces the change of escape latencies during active escape testing. Each tracing point represents the average escape latency in seconds from bins of five consecutive trials. When compared to NS controls, stress significantly increased mean escape latency by 45.0% in IES animals (Student-Newman-Keuls test, p<0.001). IES/DMI rats performed significantly better than the IES group (p<0.001 for IES vs. IES/DMI), but their mean escape latency was still 13.1% worse than that of NS controls (p=0.024 for NS vs. IES/DMI). Lower panel: Asterisks indicate that in terms of spine synapse numbers, the IES group is significantly different from the other two groups in all analyzed hippocampal areas (Tukey test, NS vs. IES, p<0.001 for all areas; IES vs. IES/DMI, p<0.001 for all areas). The pound sign denotes that the number of CA1sr spine synapses in the IES/DMI group is significantly higher than that of IES animals (p<0.001), but it is still significantly lower than that in NS controls (p=0.016). In the cases of CA3sl/sr and DGsm, spine synapse numbers were not significantly different between NS and IES/DMI rats (p=0.208 for CA3sl/sr and p=0.911 for DGsm).
Our electron microscopic analysis revealed no qualitative alterations in the ultrastructure of any examined areas following stress exposure. In line with the behavioral findings, however, two-way ANOVA found a significant treatment effect on hippocampal spine synapses (F2,18=78.267, p<0.001) with a significant treatment × sampling area interaction effect (F4,18=3.895, p=0.019), indicating that the three analyzed hippocampal areas responded differently to stress. When compared to NS controls, stress significantly decreased the number of spine synapses in IES rats, the loss being most pronounced in CA1sr and DGsm (54.2% and 46.8%, respectively), and less severe in CA3sl/sr (34.3%). On the other hand, treatment of stressed animals with desipramine for six days restored the number of spine synapses to levels seen in NS controls in both CA3sl/sr and DGsm of the IES/DMI group. In the case of CA1sr of IES/DMI animals, however, the restoration of spine synapses to nonstressed levels remained incomplete. The number of CA1sr spine synapses in IES/DMI rats was increased by 70.6% compared to IES animals, but this level was still 21.9% lower than that of NS controls (Figure 3, lower panel).
Experiment 2: Temporal characteristics of the behavioral and the synaptic effects of desipramine
Two-way ANOVA found no significant treatment effect on escape latencies (F2,126=0.727, p=0.486) among IES, IES/DMI-1d, and IES/DMI-3d animals. In line with the behavioral findings, two-way ANOVA also failed to reveal a significant treatment effect on hippocampal spine synapses (F2,18=0.019, p=0.982). For details, see Figure 4. It has to be noted that differences exist between experiments in the escape performance of similarly treated animals. This is due to the high variability of most behavioral tests, which, in our case, was amplified by the fact that we performed our individual behavioral tests many months apart, because of the time-consuming nature of electron microscopic stereology.
Figure 4.
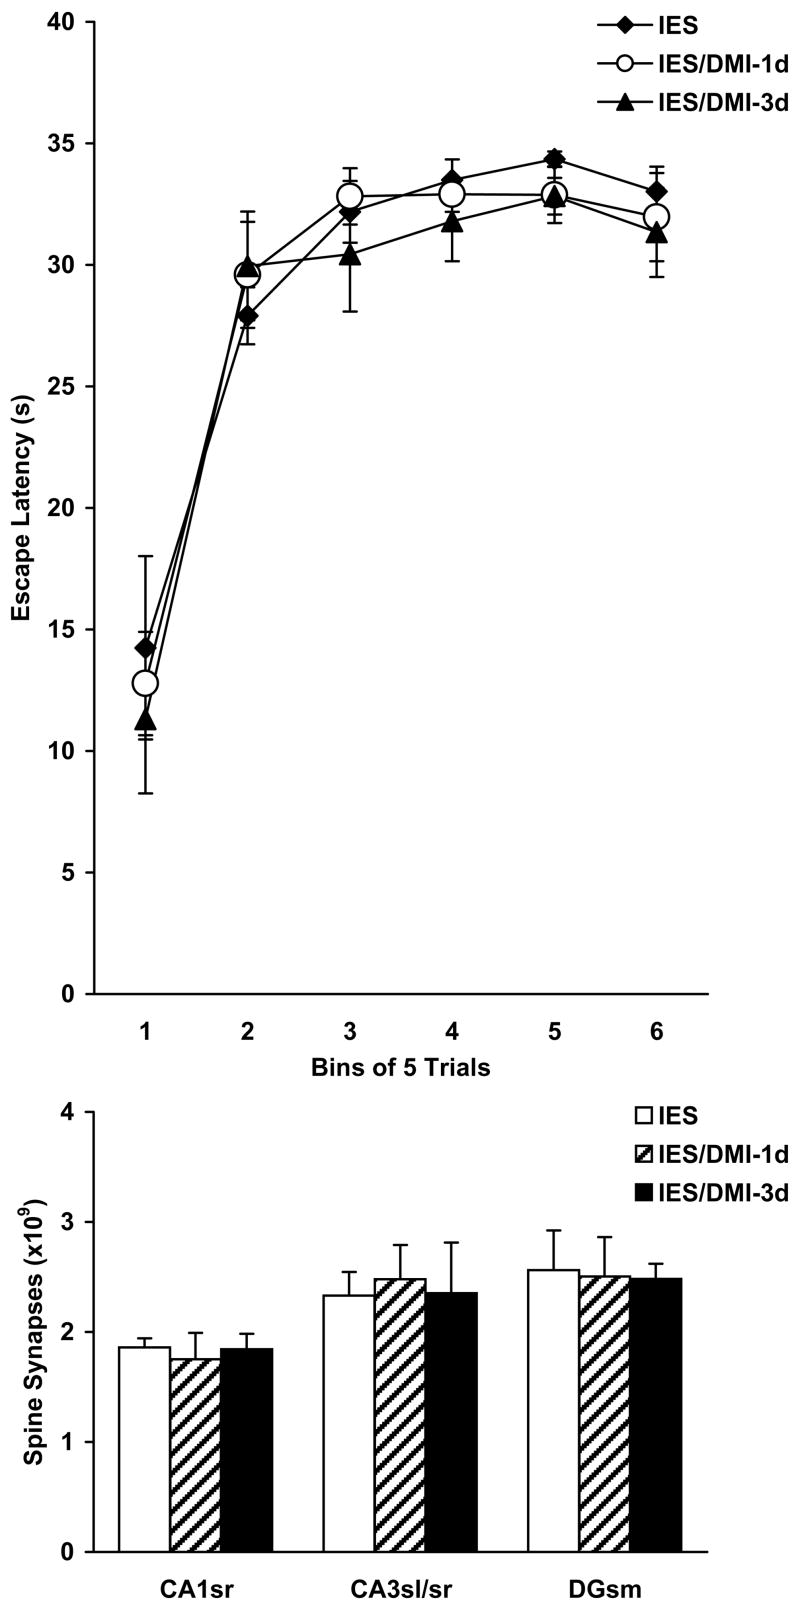
Effects of shorter-term desipramine (DMI) treatments following inescapable footshock (IES) on escape latencies in learned helplessness (upper panel) and on the number of hippocampal spine synapses (lower panel). Abbreviations: CA1sr, CA1 stratum radiatum; CA3sl/sr, CA3 stratum lucidum and radiatum; DGsm, dentate gyrus stratum moleculare; IES, treatment group containing stressed vehicle-treated rats; IES/DMI-1d and IES/DMI-3d, treatment groups consisting of stressed animals that were treated with DMI for one day and three days, respectively. Upper panel: The Student-Newman-Keuls test did not find significant differences between individual treatment groups in terms of their mean escape latencies (p>0.05). Lower panel: In each analyzed hippocampal sampling area, the number of spine synapses was statistically indistinguishable between individual treatment groups (Tukey test, p>0.05).
Experiment 3: Corticosterone reproduces both the behavioral and the synaptic responses to stress
Two-way ANOVA found a significant treatment effect on escape latencies (F2,126=40.662, p<0.001). Twenty-four hours following exposure to stress or CS, both the IES-1d and the CS-1d group developed a significant escape deficit compared to NS-1d controls. On the other hand, mean escape latencies in the IES-1d and the CS-1d groups were not significantly different, and as the chart in Figure 5a demonstrates, escape performance of CS-1d animals almost perfectly matched that of IES-1d rats.
Figure 5.

Effects of inescapable footshock (IES) and a single injection of 40 mg/kg corticosterone (CS) on escape latencies in learned helplessness and on the number of hippocampal spine synapses, observed 24 h (panels a, b) and a week (panel c) following exposure to treatment. Abbreviations: CA1sr, CA1 stratum radiatum; CA3sl/sr, CA3 stratum lucidum and radiatum; DGsm, dentate gyrus stratum moleculare; CS-1d and CS-7d, treatment groups consisting of animals analyzed 24 h and 7 days, respectively, after CS treatment; IES-1d and IES-7d, treatment groups containing rats examined 24 h and 7 days, respectively, following exposure to stress; NS-1d and NS-7d, treatment groups consisting of males evaluated 24 h and 7 days, respectively, after a nonstress exposure to shuttle boxes. Panel a: When compared to NS-1d controls, both stress and CS treatment significantly increased mean escape latency by 58.5% and 56.1%, respectively (Student-Newman-Keuls test, p<0.001 for both NS-1d vs. IES-1d and NS-1d vs. CS-1d), while the behavioral performance of the IES-1d and the CS-1d groups were not significantly different from each other (p=0.749). Panel b: Asterisks indicate that in terms of spine synapse numbers, the NS-1d group is significantly different from the other two groups in all analyzed hippocampal areas (Tukey test, NS-1d vs. IES-1d, p<0.001 for CA1sr and DGsm, and p=0.003 for CA3sl/sr; NS-1d vs. CS-1d, p<0.001 for all areas), while IES-1d and CS-1d animals were not significantly different (p=0.960 for CA1sr, p=0.945 for CA3sl/sr and p=0.825 for DGsm). Panel c: Hippocampal spine synapse changes a week after exposure to treatment were similar to those observed at the 24-h post-treatment time point as shown in panel b. Tukey test results: NS-7d vs. IES-7d, the decrease in spine synapse numbers was 56.3% in CA1sr (p<0.001), 26.1% in CA3sl/sr (p=0.010), and 41.6% in DGsm (p<0.001); NS-7d vs. CS-7d, 54.9% decrease in CA1sr, 37.0% in CA3sl/sr, and 40.1% in DGsm (p<0.001 for all areas); IES-7d vs. CS-7d, p=1.000 for CA1sr and DGsm, and p=0.659 for CA3sl/sr.
Three-way ANOVA revealed significant treatment (F2,36=202.814, p<0.001) and treatment × sampling area interaction effects (F4,36=7.993, p<0.001) on the number of hippocampal spine synapses. In association with the observed escape deficit, the number of spine synapses in the IES-1d group was significantly decreased by 51.6% in CA1sr, 28.0% in CA3sl/sr, and 48.6% in DGsm. CS administration reproduced the synaptic effects of stress, because there were no significant differences between IES-1d and CS-1d rats in terms of hippocampal spine synapse numbers. When compared to NS-1d controls, reductions in the number of spine synapses in the CS-1d group were 56.7% in CA1sr, 34.0% in CA3sl/sr, and 42.2% in DGsm (Figure 5b). As Figure 5c demonstrates, animals examined a week after exposure to stress or CS showed morphological defects similar to those observed at the 24-h post-treatment time point (Figure 5b vs. 5c). Indeed, three-way ANOVA identified no significant time effect on hippocampal spine synapses (F1,36=0.661, p=0.421).
Two-way ANOVA identified significant treatment (F2,24=148.827, p<0.001), time (F1,24=180.016, p<0.001), and treatment × time interaction effects (F2,24=146.267, p<0.001) on serum total CS levels. Compared to untreated controls, serum CS concentrations were significantly elevated in IES-1d and CS-1d animals, but they were at control levels in IES-7d and CS-7d rats (Figure 6).
Figure 6.

Effects of inescapable footshock (IES) and a single injection of 40 mg/kg corticosterone (CS) on serum total corticosterone levels. The asterisk indicates that compared to nonstressed controls (NS), serum CS concentration is significantly higher 24 h following IES (Tukey test, p=0.008). The pound sign denotes that 24 h after injecting CS, serum CS concentration is significantly higher than those both in NS controls (p<0.001) and in animals exposed to IES (p<0.001). Seven days following treatments, there is no significant difference among serum CS concentrations (p>0.05).
We also analyzed spine synapses in a stress-indifferent area, the MII/III of NS-1d, IES-1d, and IES-7d animals. One-way ANOVA found no significant differences among these three treatment groups (F2,6=0.064, p=0.939), indicating that stress does not influence the number of spine synapses in MII/III (Figure 7). We analyzed only layer II/III of motor cortex because similar to the hippocampal areas of interest, it contains the apical dendrites of the vast majority of cortical principal neurons.
Figure 7.

Effect of inescapable footshock (IES) on the number of spine synapses in layer II/III of motor cortex (MII/III). Abbreviations: IES-1d and IES-7d, treatment groups containing rats examined 24 h and 7 days, respectively, following exposure to stress; NS-1d, treatment group consisting of animals evaluated 24 h after a nonstress exposure to shuttle boxes. Tukey test results: p=0.962 for NS-1d vs. IES-1d; p=0.997 for NS-1d vs. IES-7d; and p=0.939 for IES-1d vs. IES-7d.
Discussion
This is the first demonstration at the ultrastructural level that hippocampal spine synapses undergo considerable remodeling in association with behavioral changes in the rat LH model of depression and antidepressant response. Stress induced an acute and persistent loss of spine synapses in each of CA1sr, CA3sl/sr, and DGsm, which was associated with an acutely developing and persistent helpless behavior in LH. On the other hand, we detected no significant changes in the number of MII/III spine synapses, indicating that the deleterious effect of stress exposure on spine synapses does not appear uniformly in all cortical areas. A single injection of CS to nonstressed animals reproduced both the synaptic and the behavioral responses to stress, suggesting that CS is implicated in these effects. Treatment of stress-exposed animals for six days with desipramine reversed both the hippocampal spine synapse loss and the escape deficit in LH. In line with previous studies (21), however, shorter DMI treatments had neither synaptic nor behavioral effects, indicating that DMI promotes spine synapse growth, rather than preventing the negative effect of stress. It is remarkable in particular, that even a slight difference in escape latencies is reflected in the number of hippocampal spine synapses (see Figure 3). By contrast, animals with the same amount of hippocampal spine synapses show identical behavior in LH, irrespective of previous stress experience and treatment conditions (see Figures 4, 5).
Methodological consideration
It has to be noted that n=3 subjects per treatment group in our morphological studies may seem to be inadequate by current standards. However, electron microscopic stereology is exceptionally accurate, which is due to the high number of samples (disectors) taken from each animal for ultrastructural analysis. The accuracy of synapse counts is confirmed by the consistency of many replications of the IES and NS groups in Experiments 1-3. In addition, our synapse counts are in line with more than a dozen previous stereology studies published by others (28) and by the Leranth laboratory (22; 29; 30).
Remodeling of hippocampal synapses in stress and depression
It has been postulated for many years that depression is related to loss of hippocampal spine synapses. Previous studies have provided some evidence that hippocampal spine synapse remodeling indeed occurs in depressed patients (19), as well as in animal models of stress and depression (18; 31). However, there are many controversies in the existing data regarding the direction, distribution, and functional significance of these synaptic changes. Most of the findings indicate that depression, stress, and CS administration all lead to hippocampal spine synapse loss (18; 26; 32) and to the shrinkage of pyramidal cell dendritic trees (18; 25; 27; 33; 34), the latter also suggesting spine synapse loss. Conversely, antidepressants appear to reverse the stress-induced dendritic alterations (35; 36) and induce hippocampal spine synapse growth (24; 28), the latter two studies also indicating that inducing hippocampal synaptogenesis is not a DMI-specific feature. Our present findings are in line with these earlier data. By contrast, other authors report hippocampal spinogenesis elicited by stress (37; 38), while the hippocampal expression of spine/synaptic marker molecules varies excessively both in depressed patients and animal models of stress (19; 39-42), as well as in response to antidepressant administration (43-46). Regarding the hippocampal distribution of synaptic changes, many researchers conclude that the main target of stress is the CA3 area (18; 25; 27; 34), while the CA1 is the most stress-resistant. By contrast, our present findings show that stress-induced spine synapse loss is the mildest in CA3, at least in percentage terms, and that the largest effects are observed in CA1. More importantly, available information is limited and we lack ultrastructural evidence in the case of functional significance, i.e., regarding the relation of these synaptic changes to depressive behavior. Only two recent studies have correlated hippocampal expression of spine/synaptic marker molecules with helpless behavior, but some of their findings, especially the observed alterations in presynaptic markers, are at odds with our present results in terms of both the nature and the hippocampal distribution of changes (31; 47).
Although the many obvious differences in experimental design may partially explain the varying observations, the above detailed seemingly conflicting findings may well be different aspects of an integrated mechanism that underlies synaptic plasticity. It is conceivable that building blocks of the complex structure of spine synapses, such as presynaptic vesicle proteins, postsynaptic density molecules, dendritic spines, and ultrastructurally defined spine synapses, are regulated differentially by stress and antidepressants. Indeed, there is compelling evidence that new spine synapses may be formed between preexisting boutons and spines (48), and existing spine synapses may be destroyed without spine loss and axon degeneration (49). From a functional point of view, an important question is which one, or what combination, of these building blocks is associated well with behavior? Here we provide evidence that the number of ultrastructurally defined hippocampal spine synapses is strongly correlated with helpless behavior.
Many authors argue that hippocampal synaptic remodeling may reflect cell loss and neurogenesis (50). Although our findings do not exclude this possibility, there is evidence that treatment of helpless animals with DMI for 7 days is not capable of eliciting significant cell proliferation in the hippocampus (51). In addition, IES-induced acute loss of spine synapses in CA1sr is difficult to explain with diminishing dentate gyrus neurogenesis, because there is no direct anatomical connection between the two areas.
Corticosterone in helplessness and hippocampal synaptic remodeling
As Figure 6 demonstrates, baseline CS concentrations are increased several-fold 24 h after IES or CS administration, but they are back to control levels 7 days later. By contrast, both the extent of hippocampal spine synapse loss and the severity of helpless behavior are approximately the same in the IES-1d and CS-1d groups; and the deficits are maintained even 7 days later. These findings indicate that a surge in CS levels may be sufficient to induce the observed deficits, but continued elevation of serum CS concentrations is not essential for maintaining these effects. Our CS measurements are in line with those of previous studies (52; 53), and are also consistent with clinical findings that cortisol levels in humans are not always high during a depressive episode (54; 55). When glucocorticoid concentrations do increase in a depressed patient, this increase is usually more limited than what we observed in our rat LH model. However, comparing glucocorticoid levels and their significance in humans and rodents is difficult due to several dissimilarities in the two stress responses.
Functional considerations
Several studies have compared stress-induced hippocampal synaptic or spine changes to cognitive functions (18; 38). In line with the hypothesis that remodeling of spine synapses may represent a morphological substrate of learning and memory (56), our findings suggest that helpless behavior and the associated spine synapse loss in the hippocampus represent a learning impairment. Although this seems to be a logical conclusion, approximately 70-80% of helpless animals in each experiment reached such a level of behavioral deficit that they did not even make an effort to escape shock, which cannot be explained by defective learning mechanisms. One may also argue that this total lack of escape response is acquired during prior exposure to inescapable stress, which is contradicted by our finding that CS administration induces helpless behavior without previous stress experience. These facts indicate that mechanisms in addition to learning are also involved in the development of helpless behavior.
Besides learning and memory, the hippocampus is strongly involved in regulating the stress response (11; 57; 58), and in modulating the mesolimbic dopaminergic system and motivation circuitries (59-61), the latter being particularly important in the mechanisms of helpless behavior (62; 63). Thus, deteriorating hippocampal activity may critically contribute to the joint development of cognitive problems, dysregulation of the stress response, and loss of motivation, common traits in helpless animals and in human depression (16). The number of spine synapses, as we measured in this study, may not only reflect cognitive functions, but could also serve as an important morphological correlate of hippocampal activity. Dendrites of dentate gyrus granule cells receive the major input to the hippocampus from layer II neurons of entorhinal cortex. Mossy fibers, the axons of granule cells, innervate CA3 pyramidal neurons, while CA3 pyramids project to both ipsilateral CA1 (via Schaffer collaterals) and contralateral CA1 and CA3 pyramidal cells (via commissural connections). In addition to this excitatory trisynaptic loop, CA3 pyramids on the same side are also interconnected via an associational network. The vast majority of these connections take the shape of excitatory asymmetric spine synapses located in CA1sr, CA3sl/sr, and DGsm, the very synapses that we analyzed in this study. Loss of these synapses compromises hippocampal signal flow and activity by decreasing the amount of excitatory input that principal cells receive from each other. In addition, our observation in DMI-treated animals, where spine synapse loss was only apparent in CA1sr, suggests that damage to a single link in the hippocampal trisynaptic loop may be sufficient to alter behavior, which emphasizes the need for comprehensive examination of the entire hippocampal circuitry in future studies.
In summary, despite its limitations, learned helplessness is considered one of the best animal models of depression and antidepressant response (64; 65). Based on this fact, our present findings suggest that hippocampal spine synapses are valuable neuroanatomical markers that may predict the risk of depression and the effectiveness of antidepressant therapy.
Acknowledgments
This work was supported by NIH grants MH074021 (Hajszan), MH025642 (Duman), MH045481 (Duman), ES014893 (Leranth), a NARSAD Young Investigator Award (Hajszan), a Hungarian National Office for Research and Technology grant RET 08/2004 (Parducz), a Hungarian Ministry of Health research grant ETT 476/2006 (Parducz), a Hungarian Academy of Sciences grant E-438/2006 (Parducz), and by the Connecticut Mental Health Center and the VA Center for PTSD.
Footnotes
Disclosures The authors reported no biomedical financial interests or potential conflicts of interest.
Publisher's Disclaimer: This is a PDF file of an unedited manuscript that has been accepted for publication. As a service to our customers we are providing this early version of the manuscript. The manuscript will undergo copyediting, typesetting, and review of the resulting proof before it is published in its final citable form. Please note that during the production process errors may be discovered which could affect the content, and all legal disclaimers that apply to the journal pertain.
References
- 1.Kessler RC, McGonagle KA, Zhao S, Nelson CB, Hughes M, Eshleman S, et al. Lifetime and 12-month prevalence of DSM-III-R psychiatric disorders in the United States. Results from the National Comorbidity Survey. Arch Gen Psychiatry. 1994;51:8–19. doi: 10.1001/archpsyc.1994.03950010008002. [DOI] [PubMed] [Google Scholar]
- 2.Conwell Y, Duberstein PR, Cox C, Herrmann JH, Forbes NT, Caine ED. Relationships of age and axis I diagnoses in victims of completed suicide: a psychological autopsy study. Am J Psychiatry. 1996;153:1001–1008. doi: 10.1176/ajp.153.8.1001. [DOI] [PubMed] [Google Scholar]
- 3.Carney RM, Freedland KE, Miller GE, Jaffe AS. Depression as a risk factor for cardiac mortality and morbidity: a review of potential mechanisms. J Psychosom Res. 2002;53:897–902. doi: 10.1016/s0022-3999(02)00311-2. [DOI] [PubMed] [Google Scholar]
- 4.Kanner AM. Depression and the risk of neurological disorders. Lancet. 2005;366:1147–1148. doi: 10.1016/S0140-6736(05)67461-2. [DOI] [PubMed] [Google Scholar]
- 5.Jorm AF. History of depression as a risk factor for dementia: an updated review. Aust N Z J Psychiatry. 2001;35:776–781. doi: 10.1046/j.1440-1614.2001.00967.x. [DOI] [PubMed] [Google Scholar]
- 6.Trivedi MH, Rush AJ, Wisniewski SR, Nierenberg AA, Warden D, Ritz L, et al. Evaluation of outcomes with citalopram for depression using measurement-based care in STAR*D: implications for clinical practice. Am J Psychiatry. 2006;163:28–40. doi: 10.1176/appi.ajp.163.1.28. [DOI] [PubMed] [Google Scholar]
- 7.Sheline YI, Sanghavi M, Mintun MA, Gado MH. Depression duration but not age predicts hippocampal volume loss in medically healthy women with recurrent major depression. J Neurosci. 1999;19:5034–5043. doi: 10.1523/JNEUROSCI.19-12-05034.1999. [DOI] [PMC free article] [PubMed] [Google Scholar]
- 8.Frodl T, Meisenzahl EM, Zetzsche T, Born C, Groll C, Jager M, et al. Hippocampal changes in patients with a first episode of major depression. Am J Psychiatry. 2002;159:1112–1118. doi: 10.1176/appi.ajp.159.7.1112. [DOI] [PubMed] [Google Scholar]
- 9.MacMaster FP, Mirza Y, Szeszko PR, Kmiecik LE, Easter PC, Taormina SP, et al. Amygdala and hippocampal volumes in familial early onset major depressive disorder. Biol Psychiatry. 2008;63:385–390. doi: 10.1016/j.biopsych.2007.05.005. [DOI] [PMC free article] [PubMed] [Google Scholar]
- 10.Gallassi R, Di Sarro R, Morreale A, Amore M. Memory impairment in patients with late-onset major depression: the effect of antidepressant therapy. J Affect Disord. 2006;91:243–250. doi: 10.1016/j.jad.2006.01.018. [DOI] [PubMed] [Google Scholar]
- 11.McEwen BS. Mood disorders and allostatic load. Biol Psychiatry. 2003;54:200–207. doi: 10.1016/s0006-3223(03)00177-x. [DOI] [PubMed] [Google Scholar]
- 12.O’Brien JT, Lloyd A, McKeith I, Gholkar A, Ferrier N. A longitudinal study of hippocampal volume, cortisol levels, and cognition in older depressed subjects. Am J Psychiatry. 2004;161:2081–2090. doi: 10.1176/appi.ajp.161.11.2081. [DOI] [PubMed] [Google Scholar]
- 13.Campbell S, Macqueen G. The role of the hippocampus in the pathophysiology of major depression. J Psychiatry Neurosci. 2004;29:417–426. [PMC free article] [PubMed] [Google Scholar]
- 14.Castren E. Neurotrophic effects of antidepressant drugs. Curr Opin Pharmacol. 2004;4:58–64. doi: 10.1016/j.coph.2003.10.004. [DOI] [PubMed] [Google Scholar]
- 15.Hajszan T, MacLusky NJ. Neurologic links between epilepsy and depression in women: is hippocampal neuroplasticity the key? Neurology. 2006;66:S13–22. doi: 10.1212/wnl.66.66_suppl_3.s13. [DOI] [PubMed] [Google Scholar]
- 16.Nestler EJ, Barrot M, DiLeone RJ, Eisch AJ, Gold SJ, Monteggia LM. Neurobiology of depression. Neuron. 2002;34:13–25. doi: 10.1016/s0896-6273(02)00653-0. [DOI] [PubMed] [Google Scholar]
- 17.Sorra KE, Harris KM. Overview on the structure, composition, function, development, and plasticity of hippocampal dendritic spines. Hippocampus. 2000;10:501–511. doi: 10.1002/1098-1063(2000)10:5<501::AID-HIPO1>3.0.CO;2-T. [DOI] [PubMed] [Google Scholar]
- 18.Sousa N, Lukoyanov NV, Madeira MD, Almeida OF, Paula-Barbosa MM. Reorganization of the morphology of hippocampal neurites and synapses after stress-induced damage correlates with behavioral improvement. Neuroscience. 2000;97:253–266. doi: 10.1016/s0306-4522(00)00050-6. [DOI] [PubMed] [Google Scholar]
- 19.Law AJ, Weickert CS, Hyde TM, Kleinman JE, Harrison PJ. Reduced spinophilin but not microtubule-associated protein 2 expression in the hippocampal formation in schizophrenia and mood disorders: molecular evidence for a pathology of dendritic spines. Am J Psychiatry. 2004;161:1848–1855. doi: 10.1176/ajp.161.10.1848. [DOI] [PubMed] [Google Scholar]
- 20.Wallace TL, Stellitano KE, Neve RL, Duman RS. Effects of cyclic adenosine monophosphate response element binding protein overexpression in the basolateral amygdala on behavioral models of depression and anxiety. Biol Psychiatry. 2004;56:151–160. doi: 10.1016/j.biopsych.2004.04.010. [DOI] [PubMed] [Google Scholar]
- 21.Shirayama Y, Chen AC, Nakagawa S, Russell DS, Duman RS. Brain-derived neurotrophic factor produces antidepressant effects in behavioral models of depression. J Neurosci. 2002;22:3251–3261. doi: 10.1523/JNEUROSCI.22-08-03251.2002. [DOI] [PMC free article] [PubMed] [Google Scholar]
- 22.MacLusky NJ, Hajszan T, Johansen JA, Jordan CL, Leranth C. Androgen effects on hippocampal CA1 spine synapse numbers are retained in Tfm male rats with defective androgen receptors. Endocrinology. 2006;147:2392–2398. doi: 10.1210/en.2005-0673. [DOI] [PubMed] [Google Scholar]
- 23.Sterio DC. The unbiased estimation of number and sizes of arbitrary particles using the disector. J Microsc. 1984;134:127–136. doi: 10.1111/j.1365-2818.1984.tb02501.x. [DOI] [PubMed] [Google Scholar]
- 24.Hajszan T, MacLusky NJ, Leranth C. Short-term treatment with the antidepressant fluoxetine triggers pyramidal dendritic spine synapse formation in rat hippocampus. Eur J Neurosci. 2005;21:1299–1303. doi: 10.1111/j.1460-9568.2005.03968.x. [DOI] [PubMed] [Google Scholar]
- 25.Watanabe Y, Gould E, Cameron HA, Daniels DC, McEwen BS. Phenytoin prevents stress- and corticosterone-induced atrophy of CA3 pyramidal neurons. Hippocampus. 1992;2:431–435. doi: 10.1002/hipo.450020410. [DOI] [PubMed] [Google Scholar]
- 26.Tata DA, Marciano VA, Anderson BJ. Synapse loss from chronically elevated glucocorticoids: relationship to neuropil volume and cell number in hippocampal area CA3. J Comp Neurol. 2006;498:363–374. doi: 10.1002/cne.21071. [DOI] [PubMed] [Google Scholar]
- 27.Woolley CS, Gould E, McEwen BS. Exposure to excess glucocorticoids alters dendritic morphology of adult hippocampal pyramidal neurons. Brain Res. 1990;531:225–231. doi: 10.1016/0006-8993(90)90778-a. [DOI] [PubMed] [Google Scholar]
- 28.Chen F, Madsen TM, Wegener G, Nyengaard JR. Changes in rat hippocampal CA1 synapses following imipramine treatment. Hippocampus. 2008 doi: 10.1002/hipo.20423. In Press. [DOI] [PubMed] [Google Scholar]
- 29.Hajszan T, MacLusky NJ, Leranth C. Role of androgens and the androgen receptor in remodeling of spine synapses in limbic brain areas. Horm Behav. 2008;53:638–646. doi: 10.1016/j.yhbeh.2007.12.007. [DOI] [PMC free article] [PubMed] [Google Scholar]
- 30.Leranth C, Szigeti-Buck K, Maclusky NJ, Hajszan T. Bisphenol A prevents the synaptogenic response to testosterone in the brain of adult male rats. Endocrinology. 2008;149:988–994. doi: 10.1210/en.2007-1053. [DOI] [PMC free article] [PubMed] [Google Scholar]
- 31.Iwata M, Shirayama Y, Ishida H, Kawahara R. Hippocampal synapsin I, growth-associated protein-43, and microtubule-associated protein-2 immunoreactivity in learned helplessness rats and antidepressant-treated rats. Neuroscience. 2006;141:1301–1313. doi: 10.1016/j.neuroscience.2006.04.060. [DOI] [PubMed] [Google Scholar]
- 32.Stewart MG, Davies HA, Sandi C, Kraev IV, Rogachevsky VV, Peddie CJ, et al. Stress suppresses and learning induces plasticity in CA3 of rat hippocampus: a three-dimensional ultrastructural study of thorny excrescences and their postsynaptic densities. Neuroscience. 2005;131:43–54. doi: 10.1016/j.neuroscience.2004.10.031. [DOI] [PubMed] [Google Scholar]
- 33.Magarinos AM, McEwen BS. Stress-induced atrophy of apical dendrites of hippocampal CA3c neurons: involvement of glucocorticoid secretion and excitatory amino acid receptors. Neuroscience. 1995;69:89–98. doi: 10.1016/0306-4522(95)00259-l. [DOI] [PubMed] [Google Scholar]
- 34.Magarinos AM, McEwen BS. Stress-induced atrophy of apical dendrites of hippocampal CA3c neurons: comparison of stressors. Neuroscience. 1995;69:83–88. doi: 10.1016/0306-4522(95)00256-i. [DOI] [PubMed] [Google Scholar]
- 35.Norrholm SD, Ouimet CC. Altered dendritic spine density in animal models of depression and in response to antidepressant treatment. Synapse. 2001;42:151–163. doi: 10.1002/syn.10006. [DOI] [PubMed] [Google Scholar]
- 36.Watanabe Y, Gould E, Daniels DC, Cameron H, McEwen BS. Tianeptine attenuates stress-induced morphological changes in the hippocampus. Eur J Pharmacol. 1992;222:157–162. doi: 10.1016/0014-2999(92)90830-w. [DOI] [PubMed] [Google Scholar]
- 37.Shors TJ, Chua C, Falduto J. Sex differences and opposite effects of stress on dendritic spine density in the male versus female hippocampus. J Neurosci. 2001;21:6292–6297. doi: 10.1523/JNEUROSCI.21-16-06292.2001. [DOI] [PMC free article] [PubMed] [Google Scholar]
- 38.Diamond DM, Campbell AM, Park CR, Woodson JC, Conrad CD, Bachstetter AD, Mervis RF. Influence of predator stress on the consolidation versus retrieval of long-term spatial memory and hippocampal spinogenesis. Hippocampus. 2006;16:571–576. doi: 10.1002/hipo.20188. [DOI] [PubMed] [Google Scholar]
- 39.Gao Y, Bezchlibnyk YB, Sun X, Wang JF, McEwen BS, Young LT. Effects of restraint stress on the expression of proteins involved in synaptic vesicle exocytosis in the hippocampus. Neuroscience. 2006;141:1139–1148. doi: 10.1016/j.neuroscience.2006.04.066. [DOI] [PubMed] [Google Scholar]
- 40.Eastwood SL, Harrison PJ. Hippocampal synaptic pathology in schizophrenia, bipolar disorder and major depression: a study of complexin mRNAs. Mol Psychiatry. 2000;5:425–432. doi: 10.1038/sj.mp.4000741. [DOI] [PubMed] [Google Scholar]
- 41.Xu H, He J, Richardson JS, Li XM. The response of synaptophysin and microtubule-associated protein 1 to restraint stress in rat hippocampus and its modulation by venlafaxine. J Neurochem. 2004;91:1380–1388. doi: 10.1111/j.1471-4159.2004.02827.x. [DOI] [PubMed] [Google Scholar]
- 42.Thome J, Pesold B, Baader M, Hu M, Gewirtz JC, Duman RS, Henn FA. Stress differentially regulates synaptophysin and synaptotagmin expression in hippocampus. Biol Psychiatry. 2001;50:809–812. doi: 10.1016/s0006-3223(01)01229-x. [DOI] [PubMed] [Google Scholar]
- 43.Varea E, Castillo-Gomez E, Gomez-Climent MA, Blasco-Ibanez JM, Crespo C, Martinez-Guijarro FJ, Nacher J. Chronic antidepressant treatment induces contrasting patterns of synaptophysin and PSA-NCAM expression in different regions of the adult rat telencephalon. Eur Neuropsychopharmacol. 2007;17:546–557. doi: 10.1016/j.euroneuro.2007.01.001. [DOI] [PubMed] [Google Scholar]
- 44.Tordera RM, Pei Q, Sharp T. Evidence for increased expression of the vesicular glutamate transporter, VGLUT1, by a course of antidepressant treatment. J Neurochem. 2005;94:875–883. doi: 10.1111/j.1471-4159.2005.03192.x. [DOI] [PubMed] [Google Scholar]
- 45.Rapp S, Baader M, Hu M, Jennen-Steinmetz C, Henn FA, Thome J. Differential regulation of synaptic vesicle proteins by antidepressant drugs. Pharmacogenomics J. 2004;4:110–113. doi: 10.1038/sj.tpj.6500229. [DOI] [PubMed] [Google Scholar]
- 46.Zink M, Rapp S, Gebicke-Haerter PJ, Henn FA, Thome J. Antidepressants differentially affect expression of complexin I and II RNA in rat hippocampus. Psychopharmacology (Berl) 2005;181:560–565. doi: 10.1007/s00213-005-0017-4. [DOI] [PubMed] [Google Scholar]
- 47.Reines A, Cereseto M, Ferrero A, Sifonios L, Podesta MF, Wikinski S. Maintenance treatment with fluoxetine is necessary to sustain normal levels of synaptic markers in an experimental model of depression: Correlation with behavioral response. Neuropsychopharmacology. 2007 doi: 10.1038/sj.npp.1301596. In Press. [DOI] [PubMed] [Google Scholar]
- 48.Yankova M, Hart SA, Woolley CS. Estrogen increases synaptic connectivity between single presynaptic inputs and multiple postsynaptic CA1 pyramidal cells: a serial electron-microscopic study. Proc Natl Acad Sci U S A. 2001;98:3525–3530. doi: 10.1073/pnas.051624598. [DOI] [PMC free article] [PubMed] [Google Scholar]
- 49.Bastrikova N, Gardner GA, Reece JM, Jeromin A, Dudek SM. Synapse elimination accompanies functional plasticity in hippocampal neurons. Proc Natl Acad Sci U S A. 2008;105:3123–3127. doi: 10.1073/pnas.0800027105. [DOI] [PMC free article] [PubMed] [Google Scholar]
- 50.Kempermann G, Kronenberg G. Depressed new neurons--adult hippocampal neurogenesis and a cellular plasticity hypothesis of major depression. Biol Psychiatry. 2003;54:499–503. doi: 10.1016/s0006-3223(03)00319-6. [DOI] [PubMed] [Google Scholar]
- 51.Chen H, Pandey GN, Dwivedi Y. Hippocampal cell proliferation regulation by repeated stress and antidepressants. Neuroreport. 2006;17:863–867. doi: 10.1097/01.wnr.0000221827.03222.70. [DOI] [PubMed] [Google Scholar]
- 52.Malberg JE, Duman RS. Cell proliferation in adult hippocampus is decreased by inescapable stress: reversal by fluoxetine treatment. Neuropsychopharmacology. 2003;28:1562–1571. doi: 10.1038/sj.npp.1300234. [DOI] [PubMed] [Google Scholar]
- 53.Fleshner M, Deak T, Spencer RL, Laudenslager ML, Watkins LR, Maier SF. A long-term increase in basal levels of corticosterone and a decrease in corticosteroid-binding globulin after acute stressor exposure. Endocrinology. 1995;136:5336–5342. doi: 10.1210/endo.136.12.7588279. [DOI] [PubMed] [Google Scholar]
- 54.Gold PW, Drevets WC, Charney DS. New insights into the role of cortisol and the glucocorticoid receptor in severe depression. Biol Psychiatry. 2002;52:381–385. doi: 10.1016/s0006-3223(02)01480-4. [DOI] [PubMed] [Google Scholar]
- 55.Swaab DF, Bao AM, Lucassen PJ. The stress system in the human brain in depression and neurodegeneration. Ageing Res Rev. 2005;4:141–194. doi: 10.1016/j.arr.2005.03.003. [DOI] [PubMed] [Google Scholar]
- 56.Kandel ER. The molecular biology of memory storage: a dialogue between genes and synapses. Science. 2001;294:1030–1038. doi: 10.1126/science.1067020. [DOI] [PubMed] [Google Scholar]
- 57.Sala M, Perez J, Soloff P, Ucelli di Nemi S, Caverzasi E, Soares JC, Brambilla P. Stress and hippocampal abnormalities in psychiatric disorders. Eur Neuropsychopharmacol. 2004;14:393–405. doi: 10.1016/j.euroneuro.2003.12.005. [DOI] [PubMed] [Google Scholar]
- 58.Herman JP, Mueller NK. Role of the ventral subiculum in stress integration. Behav Brain Res. 2006;174:215–224. doi: 10.1016/j.bbr.2006.05.035. [DOI] [PubMed] [Google Scholar]
- 59.Cooper DC, Klipec WD, Fowler MA, Ozkan ED. A role for the subiculum in the brain motivation/reward circuitry. Behav Brain Res. 2006;174:225–231. doi: 10.1016/j.bbr.2006.05.036. [DOI] [PubMed] [Google Scholar]
- 60.Taepavarapruk P, Floresco SB, Phillips AG. Hyperlocomotion and increased dopamine efflux in the rat nucleus accumbens evoked by electrical stimulation of the ventral subiculum: role of ionotropic glutamate and dopamine D1 receptors. Psychopharmacology (Berl) 2000;151:242–251. doi: 10.1007/s002130000376. [DOI] [PubMed] [Google Scholar]
- 61.Lisman JE, Grace AA. The hippocampal-VTA loop: controlling the entry of information into long-term memory. Neuron. 2005;46:703–713. doi: 10.1016/j.neuron.2005.05.002. [DOI] [PubMed] [Google Scholar]
- 62.Takamori K, Yoshida S, Okuyama S. Repeated treatment with imipramine, fluvoxamine and tranylcypromine decreases the number of escape failures by activating dopaminergic systems in a rat learned helplessness test. Life Sci. 2001;69:1919–1926. doi: 10.1016/s0024-3205(01)01279-6. [DOI] [PubMed] [Google Scholar]
- 63.Winter C, von Rumohr A, Mundt A, Petrus D, Klein J, Lee T, et al. Lesions of dopaminergic neurons in the substantia nigra pars compacta and in the ventral tegmental area enhance depressive-like behavior in rats. Behav Brain Res. 2007;184:133–141. doi: 10.1016/j.bbr.2007.07.002. [DOI] [PubMed] [Google Scholar]
- 64.Cryan JF, Markou A, Lucki I. Assessing antidepressant activity in rodents: recent developments and future needs. Trends Pharmacol Sci. 2002;23:238–245. doi: 10.1016/s0165-6147(02)02017-5. [DOI] [PubMed] [Google Scholar]
- 65.Willner P, Mitchell PJ. The validity of animal models of predisposition to depression. Behav Pharmacol. 2002;13:169–188. doi: 10.1097/00008877-200205000-00001. [DOI] [PubMed] [Google Scholar]