

Abstract
While remarkably complex networks of connected DNA molecules can form from a relatively small number of distinct oligomer strands, a large computational space created by DNA reactions would ultimately require the use of many distinct DNA strands. The automatic synthesis of this many distinct strands is economically prohibitive. We present here a new approach to producing distinct DNA oligomers based on the polymerase chain reaction (PCR) amplification of a few random template sequences. As an example, we designed a DNA template sequence consisting of a 50-mer random DNA segment flanked by two 20-mer invariant primer sequences. Amplification of a dilute sample containing about 30 different template molecules allows us to obtain around 1011 copies of these molecules and their complements. We demonstrate the use of these amplicons to implement some of the vector operations that will be required in a DNA implementation of an analog neural network.
Keywords: DNA, Computation, Oligomer, Random
1 INTRODUCTION
In 1994, Adleman proposed and demonstrated a new way to solve in principle very complex problems using DNA molecular computation [1]. This technique has been improved by introducing the selection of desired components in electrophoresis gels containing bound target DNA oligomers [2]. Since the first DNA computer was reported, various alternate schemes for DNA computing and self assembly have been proposed, all based on the property that complementary single-stranded DNA oligomers can find each other in solution to form Watson-Crick double strands. If the single-stranded oligomers are present in connected pairs of distinct molecules [1,2] or in higher multiples of distinct molecules [3,4], certain networks of molecules will form in space or time, depending on how the reactions are carried out. The structure of the resulting networks will reflect the correlations encoded in the set of oligomer pairs or triads, etc. While complex networks can form from a relatively small number of distinct oligomer strands, a large computing power might ultimately require the use of many more distinct DNA strands than could be economically produced by automatic synthesis. Our new approach to producing the requisite distinct DNA oligomers is based on the polymerase chain reaction (PCR) amplification of a few molecules chosen from a collection of oligomers produced with random sequences. Our method could in principle be scaled to produce millions of different DNA oligomers.
In Adleman’s classic DNA computing paper [1], a small-scale directed Hamiltonian path problem was solved by encoding the cities and paths of the problem in complementary DNA molecules that would find each other in solution and by the process of self-assembly produce a small number of connected DNA oligomers representing the correct result. Liu et al. [5,6] proposed another technique that involves the immobilization and manipulation of combinatorial mixtures of DNA on a gold-coated coverslip. A set of DNA molecules encoding all candidate solutions is synthesized and attached to the surface. Successive cycles of hybridization operations and exonuclease digestion are used to identify and eliminate those members that are not solutions. After completing all of the multiple step cycles, the solution to the computational problem is identified using PCR to amplify the remaining molecules, which are then hybridized to an addressed array. The advantages of this approach are its scalability and potential to be automated. However, the shortcomings are the low efficiency of DNA attaching to the gold-coated surface and the requirements of large quantities of different synthesized DNA strands. DNA computation approaches using the ability of pairs of distinct oligomers to join in chains have been used to suggest a way to solve the SAT problem [7], to perform binary addition [8,9], and to solve the maximal clique problem [10]. Inspired by Adleman’s work using DNA renaturization to effect a computation, the energy of hybridization of DNA fuel strands has also been used to run nanomachines [11,12]. (For a review see [13].)
The operations of joining various strands of DNA may be thought of as a series of matrix multiplications with the matrix elements being represented by couplets of joined single-stranded oligomers and vectors by singlets [14]. An analog neural network may be represented by saturable matrix operations [15] and hence may be represented by chemical operations performed on strands of DNA [16,17]. The latter references have described a particular set of DNA operations to effect the interconversion of electrical and DNA data, to represent the Hopfield associative memory [15], and to implement the feed-forward neural network of Rumelhart et al. [18]. This type of DNA computing has the advantage that it should be fault tolerant and thus more immune to DNA hybridization errors than a Boolean DNA computer [19]. To extend this method to problems of n dimensions, one will need n different basis DNA oligomers and their complements. Thus really interesting applications using thousands of dimensions will be impractical if the different basis vectors must be synthesized individually.
The idea of representing a vector space by concentrations of various chemicals may be traced to Weyl’s [20] suggestion of a vector space composed of a mixture of four gases, with unit concentrations of the pure gases standing for unit vectors in the various dimensions. We note that Adleman in his original DNA computing experiment [1] used random 20-mers to represent his basis vectors, but these were specified as definite sequences that were produced by a DNA synthesizer. Non-random designs for oligomers with advantageous properties for DNA computing have been proposed [21], but such basis vectors would be impractical for calculations in a large number of dimensions. In this paper, we describe a new method in which we make the material representing each basis vector in a DNA vector space by PCR-amplifying a few random DNA oligomers into a macroscopic sample of oligomers and their complements. The problem of negative amplitudes needed for a true vector space representation is solved by assigning concentrations of the complementary DNA oligomers to stand for negative concentrations. Such a convention has the desired property that equal concentrations of positive and negative basis vectors will cancel out by becoming inactive double-stranded DNA after a period of time. The template material for generating our basis vectors is a commercially synthesized 90-mer single stranded DNA oligomer, specified as a 50mer random sequence flanked by two distinct 20-mer fixed DNA strands serving as the primer set for PCR. A sample containing about 30 template molecules with different DNA sequences is obtained by repeated dilutions of template in nuclease-free water. After 38 cycles of PCR we obtain approximately 1011 copies of these 30 molecules. Asymmetric PCR (using first only one primer and then the other one) yields usable amounts of two samples containing single-stranded template copies and their complements for our use in various matrix operations for implementing an analog neural network DNA computing algorithm. We infer that it will be possible to scale up to obtain large numbers (at least hundreds) of distinct DNA template molecule sets.
2 MATERIALS AND METHODS
Primer and Random DNA Sequence designing
In this experiment, we chose two primers from the website http://www.realtimeprimers.org/ with sequences as:
Primer L20-002-MWG: 5′-AAGAGCCATGCTACTGTTGG -3′ and
Primer R20-002-MWG: 5′-GGAACTTCACAGATAGCCTC - 3′
with both being bought from MWG Biotech. Tag-primer L20-002-MWG and Tag-primer R20-002-MWG were bought from MWG Biotech by adding TET and AA to 5′ end of Primer L20-002-MWG and Primer R20-002-MWG, respectively. The template labeled as
Template 90-002: 5′-AAGAGCCATGCTACTGTTGGNN…NNGAGGCTATCTGTGAAGTTCC-3′
was bought from Integrated DNA Technologies, Inc, with the middle 50-mer random sequences made by machine mixing-30% T, 20% A, 26% G and 24% C. Both the primers and the template were checked by using software AnnHyb 4.920 to reduce the chance of primer dimer or hairpin formation. We note that it is essential to purchase the primers and templates from different vendors, else there will be a chance that minute traces of template from the solid matrix of the synthesizer will contaminate the primers.
Our primary interest in the design of strands is that they are orthogonal (aka – they don’t hybridize to one another). Concerns about the differential activity of polymerase on differing nucleosides are allayed by two points. First, even if certain strands were amplified more than others, there would be a negligible effect in output intensity of the polyacrylamide gel. This benefit of “fault tolerance” is one which we believe makes analog neural network architectures most attractive. Second, any fragmentation that occurs is minimal, as evidence by a lack of fragmentation in our output gels.
PCR and Asymmetric PCR
In order to reduce the formation of primer dimers before PCR starts, we selected Finnzymes’ DyNAzyme™ II hot start DNA polymerase (New England Biolabs), a modified form of the DyNAzyme™ II DNA Polymerase originating from Thermus brockianus. It is inactive at room temperature, and the activity is recovered by a 10-minute incubation step at 94°C. The enzyme improves the specificity of PCR by preventing the extension of non-specifically bound primers during reaction setup and the first heating cycle. Besides PCR primers and templates, each 100 μL solution contains 0.2mM dNTP (New England Biolabs), 1X DyNAzyme™ II Hot Start DNA Polymerase Reaction Buffer (15 mM Tris-HCl, 30 mM KCl, 5 mM (NH4)2SO4, 2.5 mM MgCl2, 0.02 % BSA,pH 8.2 @ 25°C), 1.2μL 2units/μL hot start polymerase and nuclease free water (Integrated DNA Technologies). In our experiment, we combined the annealing step and extension step together. A 38 cycles symmetric PCR and a 30 cycles asymmetric PCR (initial 10minutes incubate at 94°C; denature at 94°C for 30 seconds, annealing and extension at 50°C for 90 seconds; after 38 or 30 cycles, incubate at 72°C for 10minutes to maximize the extension, and then keep at 4°C) were used to get single-stranded DNA amplicons. We sealed every PCR test tube with a hot glue gun before we put them into the thermal incubator to prevent cross contamination.
DNA polyacrylamide gel electrophoresis
15% TBE gels and 10–20% gradient Tris-Hcl gels were used to check the results. A vertical gel tank was used with controllable temperature cycling water inside and one sapphire plate covering the gel to maintain the desired temperature uniformly across the gel. 1×Tris-Borate-EDTA buffer (Sigma) was used as the running buffer and 1×Bromophenol blue buffer as the loading buffer. In each gel well, 6μL solution was added. Gel electrophoresis was run at 107 V and 40°C for 70 minutes.
SYBR Gold gel stain
SYBR Gold (Molecular Probes) nucleic acid gel stain was used to stain DNA after gel electrophoresis, which is the most sensitive fluorescent stain available for detecting double- or single-stranded DNA or RNA in electrophoresis gels. It is a proprietary unsymmetrical cyanine dye with excitation maxima for dye-nucleic acid complexes at ~495nm in the visible and ~300nm in the ultraviolet and with emission maximum at ~537nm. For detecting DNA and RNA, SYBR Gold stain is more than 10-fold more sensitive than Ethidium Bromide and does not require a destain step due to the low intrinsic fluorescence of the unbound dye. In our experiment, the polyacrylamide gel with DNA was immersed into a stain buffer (formed by mixing 5μL of 10,000× SYBR Gold gel stain with 10ml 10× TBE buffer and 90ml double distilled water) at room temperature for 40minutes.
Data analysis using Kodak 1D system
312nm UV light (Fisher Scientific), or 488nm or 514 nm Laser light was used to excite the SYBR Gold-nucleic acid complexes. The exposure time was 8 seconds. Using a Kodak 1D image analysis system (Fisher Scientific), the concentration and mobility of the DNA strands were measured.
DNA extraction from polyacrylamide gel using QIAEX® II gel extraction kits
In order to get pure DNA strands, a small piece of gel containing the required DNA band was cut using a razor blade and crushed in a test tube with a pippet tip. A QIAEX® II gel extraction kit was used to purify DNA strands.
3 RESULTS AND DISCUSSION
Amplifying 30 molecules using PCR
1μL 50μM Template 90-002 was diluted into 1000μL Nuclease Free Water (IDT) and labeled as D-1 with a concentration of 30*109 molecules/μL. 1μL D-1 was diluted into 1000μL of nuclease free water and labeled as D-2 (30*106molecules/μL). 1μL D-2 was diluted into 1000μL of nuclease free water and labeled as D-3 (30*103 molecules/μL). 1μL D-3 was diluted into 100μL of nuclease free water and labeled as D-3.5 (300molecules/μL), and into 1000μL of nuclease free water and labeled as D-4 (30molecules/μL). After 38 cycles PCR, the template can be amplified approximately 238≈1011 fold. Experimental evidence for an efficiency approaching unity for Taq Polymerase can be found in Wolffs et al [22]. In this reference, the authors use the efficiency equation “E = (10-1/slope) – 1”, which was derived from an earlier work [23]. Experiments performed by Wolffs et al show a value of −3.3229 for the slope in this equation, which yields E = .99959. While the experiments in Wolffs’ paper were performed using real time PCR, the results stated therein are suggestive of a high efficiency in our experiment. An initial 30 molecules in a 100 μL solution will become 3*1012 molecules, giving a concentration of 0.05μM. Table 1 shows the materials for PCR. The products were run in a 10–20% gradient Tris-HCL Polyacrylamide gel. The gel was stained in SYBR Gold gel stain solution for 40 minutes and the image was taken using 488nm laser.
Table 1.
Materials used in PCR.
| 1 [μL] | 2 [μL] | 3 [μL] | 4 [μL] | 5 [μL] | 6 [μL] | 7 [μL] | 8 [μL] | 9 [μL] | 10 [μL] | 11 [μL] | 12 [μL] | |
|---|---|---|---|---|---|---|---|---|---|---|---|---|
| 1μL template | D-2 | D-2 | D-3 | D-3 | D-3.5 | D-3.5 | D-4 | D-4 | 0 | 0 | 0 | 0 |
| 10mM dNTP | 2 | 2 | 2 | 2 | 2 | 2 | 2 | 2 | 2 | 2 | 2 | 2 |
| 2U/μL Hot start DNA Polymerase | 1.2 | 1.2 | 1.2 | 1.2 | 1.2 | 1.2 | 1.2 | 1.2 | 1.2 | 1.2 | 1.2 | 1.2 |
| 10× hot start Reaction Buffer | 10 | 10 | 10 | 10 | 10 | 10 | 10 | 10 | 10 | 10 | 10 | 10 |
| 20μM Left L20 | 1 | 1 | 1 | 1 | 1 | 1 | 1 | 1 | 1 | 1 | 1 | 1 |
| 20μM Right R20 | 1 | 1 | 1 | 1 | 1 | 1 | 1 | 1 | 1 | 1 | 1 | 1 |
| Nuclease-free Water | 83.8 | 83.8 | 83.8 | 83.8 | 83.8 | 83.8 | 83.8 | 83.8 | 84.8 | 84.8 | 84.8 | 84.8 |
The result in Fig. 1 shows a band around 90bp from lanes 1 to 8. The long dark bands above 90bp in lanes 1 and 2 with initial 30×106 random DNA molecules may be explained as those 90-base DNA oligomers that act as their own primers, thus producing long primer dimers. The long dark bands above 90 bp in lanes 3 and 4 with initial 30,000 random DNA molecules can be accounted for in the same way. In contrast, the initial 300 molecules produce fewer long bands and more primer strands left in lanes 5 and 6. For the initial 30 molecules in lanes 7 and 8, the longest bands don’t appear and the primers produced more primer dimers around 40bp. The control lanes (9, 10, 11, 12) without the template show no amplified signals around 90bp. The results indicate that we succeeded in getting larger quantities (approximately 5 pmoles) of multiplicities of 30 different molecules using 38 cycles hot-start PCR.
Figure 1.
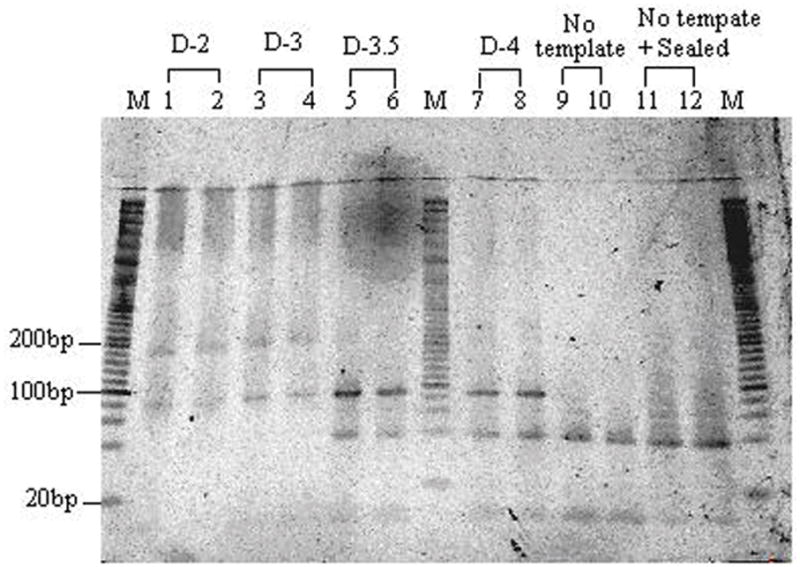
Gel electrophoresis of PCR amplifying random DNA sequence in a 10–20% gradient Tris-HCl polyacrylamide gel. Lane M contains 20bp DNA marker. Lanes 1 and 2 contain PCR amplicons of D-2. Lanes 3 and 4 contain PCR amplicons of D-3. Lanes 5 and 6 contain PCR amplicons of D-3.5. Lanes 7 and 8 contain PCR amplicons of D-4. Lanes 9 and 10 are controls without the initial DNA template. Lanes 11 and 12 are controls with sealed caps.
Making two basis vectors and their probes using Asymmetric PCR
From the above PCR products, two samples containing 30 different molecules which have been amplified were chosen and labeled as A and B. Theoretically these two samples should each contain 30 different molecules, and there are small probabilities for them to have one sequence in common. Each of these two samples represents a “basis vector”. In this case, the sequences which are complementary to each of these samples can be isolated and used to “eliminate” one of the basis vectors by allowing them to hybridize. Our method of using several different types of molecules has more benefit over the use of a single type of molecule due to the difficulties inherent in the amplification of such a small sample (such as obtaining a single molecule from a solution and the time required for PCR). Further, since the readout of a result is given by a ratio of intensities in gel, this system is fault tolerant. In order to improve the signal to noise ratio, one only has to increase the standard aliquot used for a basis vector. The signal will then become brighter in a polyacrylamide gel by a factor much larger than any errors in the system. The buffer and small molecules were eliminated from the solution by the Edge gel filtration method. First, two Edge gel filtration cartridges were centrifuged at 2900RPM for 3 minutes. Second, the cartridges were transferred to two clean microcentrifuge tubes and 80μl of A and B were added to the packed columns, respectively. Finally, they were centrifuged at 2900RPM for 2 minutes and then pure DNA oligomers were obtained and used as the template for the following asymmetric PCR. For the asymmetric PCR, the solution was first heated to 94°C for 10 minutes. Second, 30 cycles of PCR (first, 94°C for 30seconds to denature dsDNA, then kept at 50°C for 90 seconds for annealing and extension steps) were used to linearly amplify the templates. Finally, the solutions were kept at 72°C for 10 minutes to optimize the polymerization. In Table 2, 20 bases primers and TET labeled 22 bases primers were used.
Table 2.
Samples used in the asymmetric PCR.

|

|

|

|

|

|

|

|
||
|---|---|---|---|---|---|---|---|---|---|
| Template | 16A | 16A | 16B | 16B | Template(μL) | 16A | 16A | 16B | 16B |
| 10mM dNTP | 4 | 4 | 4 | 4 | 10mM dNTP | 4 | 4 | 4 | 4 |
| 2U/μL Hot start | 2.4 | 2.4 | 2.4 | 2.4 | 2U/μL Hot start | 2.4 | 2.4 | 2.4 | 2.4 |
| 10× hot start | 20 | 20 | 20 | 20 | 10× hot start | 20 | 20 | 20 | 20 |
| 50μM Left L20 | 5 | 0 | 5 | 0 | 100μM | 2.5 | 0 | 2.5 | 0 |
| 50μM Right R20 | 0 | 5 | 0 | 5 | 100μM Tag-R20 | 0 | 2.5 | 0 | 2.5 |
| Nuclease-free | 152.6 | 152.6 | 152.6 | 152.6 | Nuclease-free | 155.1 | 155.1 | 155.1 | 155.1 |
In Fig. 2, lanes 1, 2, 3 and 4 contain 6 bands in each lane. Compared to 90 bases template 90-002 in lane 9, the band around 140bp is 90-base ssDNA amplified by asymmetric PCR, and the band at 90bp is the left 90bp template after the asymmetric PCR. The higher intensity of bands in lanes 1 and 3 than those of lanes 2 and 4 indicates that the efficiency of the asymmetric PCR using one direction primer is larger than using the other direction primer due to the annealing temperature difference between these two primers. Using software AnnHyb 4.920, the melting temperature for 1.25μM primer L20 at 50mM salt concentration is 56.5°C, while the melting temperature for 1.25μM primer R20 at 50mM salt concentration is 53.9°C. Therefore, primer L20 has a higher annealing ability than primer R20 when we use 50°C as the annealing temperature. The other possible reason is that the 3′ GG end of primer L20-002 is much easier to anneal to template than the 3′ TC end of primer R20. The three bands between 20bp and 80bp may come from primer dimers. The amplified 92 bases ssDNA and 92 bp dsDNA with overhang in lanes 5, 6, 7 and 8 move slower than 90 bases ssDNA and 90 bp dsDNA in lanes 1, 2, 3 and 4, respectively, due to the two extra As and TET at the 5′ end of Tag-primer L20 and Tag-primer R20. From Fig. 2, we see that the formation of ssDNA using Tag-primers has a lower product than that of primers. This indicates that asymmetric PCR using an imperfectly matched primer will yield low products, which may be caused by steric hindrance due to the tag’s presence. This mechanism needs further study.
Figure 2.
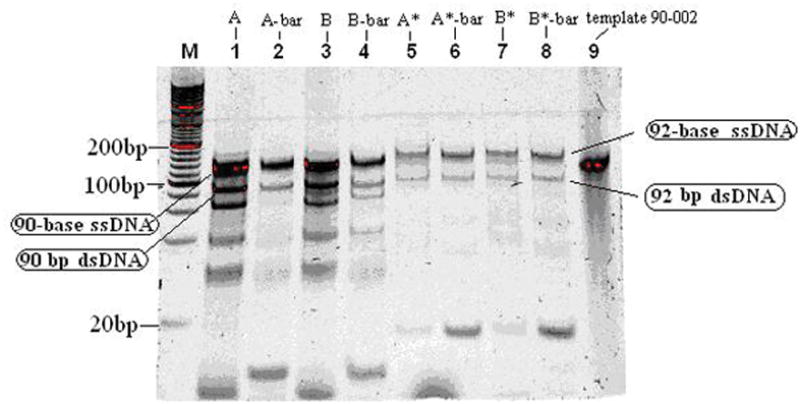
Gel electrophoresis of 30-cycle asymmetric PCR products at 107 volts and 40°C in a 15% TBE gel. Lane M contains 20bp DNA ladder. Lane 1 contains the products of template A and primer L20 only. Lane 2 contains template A and primer R20 only. Lane 3 contains the products of template B and primer L20 only. Lane 4 contains template B and primer R20 only. Lane 5 contains the product of template A and Tag-L20 only. Lane 6 contains the product of template A and Tag-R20 only. Lane 7 contains the product of template B and Tag-L20 only. Lane 8 contains the product of template B and Tag-R20 only. Lane 9 contains 10μL 0.5μM template 90-002.
Purifying 90 base ssDNA and its complement after the asymmetric PCR
The asymmetric PCR products come with some longer or shorter unwanted strands. In order to get pure amplicons, eight pieces of gel were used to purify eight samples respectively, and the gel containing the asymmetric PCR amplified ssDNA strands was cut. ssDNA strands were purified following the QIAEX® II gel extraction procedure. The diffusion coefficient can be obtained by the Nernst-Einstein relation
where μ is the mobility, k is Boltzmann’s constant, T is the temperature in Kelvin, and q is the charge. In our experiment, the length of DNA is 90 bases, so μ≈ 5*10−5 cm2/vs, kT≈1/40 eV at room temperature and q=90e. Thus D≈10−8cm2/s and the rms (root mean square) of diffusion length for 3 hours would be λrms=(Dt)1/2=0.1 mm. Because the size of the gel fragments after grinding is smaller than 0.1 mm, the DNA oligomers in the gel can easily diffuse out into the elution buffer (0.5M ammonium acetate; 10 mM magnesium acetate; 1 mM EDTA, pH 8.0; 0.1% SDS) which is maintained at 50°C.
20 μL of each ssDNA strand were obtained using QIAEX II gel extraction kits. 2 μL of each were taken and diluted into 8 μL nuclease free water and loaded into a 15% TBE gel respectively. The electrophoresis was run at 107V and 40°C for 80 minutes. Then the gel was soaked in SYBR Gold Gel stain solution for 40 minutes. The image shown in Fig. 3 was taken using 312 nm UV light. Compared to 0.5 μM template 90-002 in lane 9, the ssDNA concentrations from lanes 1 to 8 were calculated and shown in Fig. 4. Because 2 μL of initial concentration of samples were diluted into 8 μL nuclease free water, the initial concentration should be calculated as Cinitial=5Cmeasured as shown in Table 3.
Figure 3.
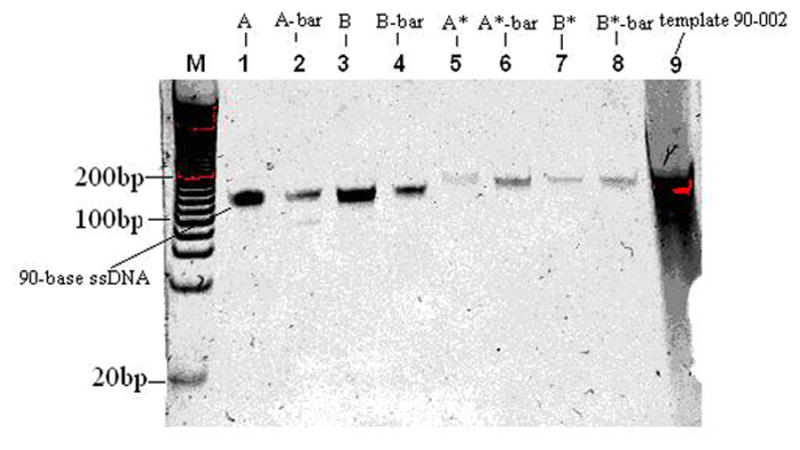
Gel electrophoresis of purified ssDNA in a 15% TBE gel. Lane M contains 20 bp DNA ladder. Lanes 1, 2, 3, 4, 5, 6, 7 and 8 contain pure ssDNA samples from corresponding lanes of Fig. 2. Lane 9 contains 10μL 0.5μM template 90-002.
Figure 4.
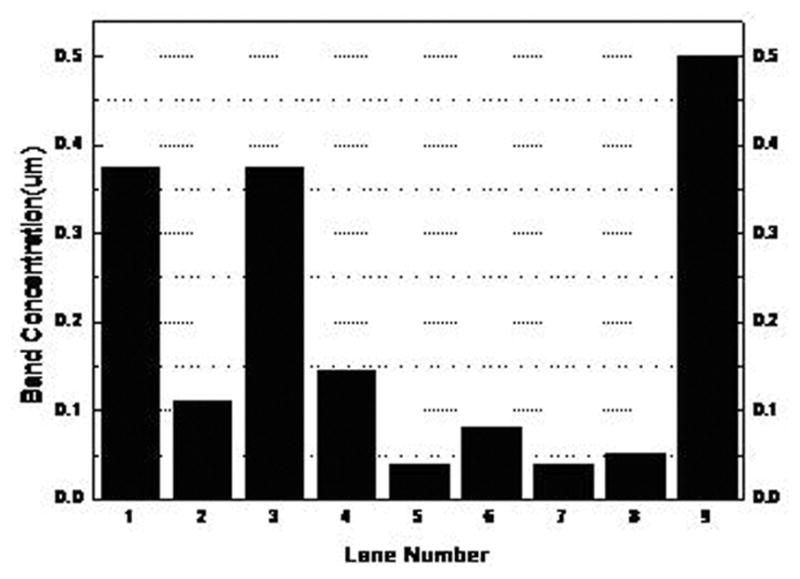
Calculated band concentration of purified ssDNA strands versus lane numbers. The standard Lane 9 has a concentration of 0.5μM.
Table 3.
Calculated initial concentration of pure samples
| # | 1 | 2 | 3 | 4 | 5 | 6 | 7 | 8 |
|---|---|---|---|---|---|---|---|---|
| Label | A | A-bar | B | B-bar | TET-A | TET-A-bar | TET-B | TET-B-bar |
| Name | A | A-bar | B | B-bar | A* | A*-bar | B* | B*-bar |
| Concentration(μM) | 1.87 | 0.55 | 1.86 | 0.72 | 0.2 | 0.4 | 0.2 | 0.25 |
Before further experiments, we tested the annealing efficiency of ssDNA strands and their complements. Table 4 shows the sample components. For samples 1 and 2, the excess A and A-bar, and the excess B and B-bar were mixed with nuclease free water respectively. For sample 3, the excess A and B-bar were mixed with nuclease free water. For sample 4, A and B were mixed together. Samples 5–8 are similar but contain about 40mM NaCl. Figure 5 (a) and (b) show the electrophoresis of samples with the annealing temperature at 37°C and at 60°C, respectively. In both figures, the increased intensity of 90bp dsDNA in lanes 5 and 6 compared to that of lanes 1 and 2 shows that 30–40mM NaCl enhances the annealing efficiency because it can weaken the electro-repulsion force between the two complementary strands and thus lower Tm.
Table 4.
Samples for testing the annealing conditions for ssDNA oligomers and their complements.
| # | Sample component |
|---|---|
| 1 | 1μL 1.87μM A + 3μL 0.55μM A-bar + 6μL Nuclease Free Water |
| 2 | 1μL 1.86μM B + 2μL 0.72μM B-bar + 7μL Nuclease Free Water |
| 3 | 1μL 1.87μM A + 2μL 0.72μM B-bar + 7μL Nuclease Free Water |
| 4 | 1μL 1.87μM A + 1μL 1.86μM B + 8μL Nuclease Free Water |
| 5 | 1μL 1.87μM A + 3μL 0.55μM A-bar + 6μL 50mM NaCl |
| 6 | 1μL 1.86μM B + 2μL 0.72μM B-bar + 7μL 50mM NaCl |
| 7 | 1μL 1.87μM A + 2μL 0.72μM B-bar + 7μL 50mM NaCl |
| 8 | 1μL 1.87μM A + 1μL 1.86μM B + 8μL 50mM NaCl |
Figure 5.
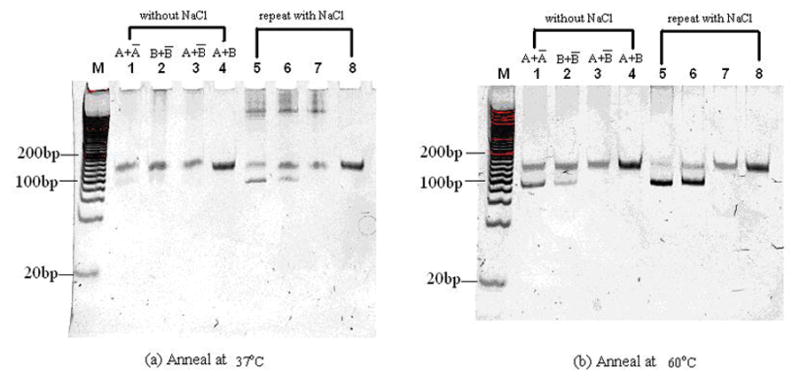
Gel electrophoresis of DNA samples annealed at 37°C (a) and 60°C (b) in 15% TBE gels. Lane M contains 20bp DNA ladder. Lane 1 and 2 contains the annealing products of A and A-bar, B and B-bar respectively. Lane 3 contains the bubble DNA formed by annealing A and B-bar. Lane 4 contains ssDNA A and B. Lane 5 to 8 repeat lanes 1 to 4 by annealing with 30~40 mM NaCl.
In Fig 5 (a), lanes 5, 6 and 7 with 30–40mM NaCl contain long bands near the top of the gel, which may come from tangled DNA strands. The bands disappeared and more dsDNA at 90 bp formed when the annealing temperature was increased to 60°C as shown in lanes 5, 6 and 7 of Fig. 5 (b). Comparing these two images, we can see that the efficiency of produced dsDNA greatly increases as the annealing temperature increases. Thus, 30–40 mM NaCl and 60°C annealing temperature are two important factors for us to get dsDNA from random ssDNA and its complement.
Vector Addition of two DNA Vectors
In order to see whether the basis vectors made of random strands are useful or not, we repeated an experiment which tested the vector addition of two DNA vectors [19], but this time using our new random DNA basis vectors. Using the procedures described above, we obtained two basis vectors which we label A and B, along with their complementary strands (A-bar and B-bar) and fluorescent probes. We define two vectors V1 and V2 that we wish to add:
where the negative basis vector has been represented by the complement of the basis vector as discussed above. The sum of the two vectors is:
where the double-stranded DNA (A|A-bar) is defined to be zero. Fig. 6 shows the detailed vector addition in a two-dimensional coordinate system, in which distances along the positive X axis are proportional to the concentration of the basis vector A, whereas along the negative X axis the distances are proportional to the concentration of A-bar. A similar convention holds for the Y axis. Table 5 shows how to test three vectors with four probes A*, A*-bar, B* and B*-bar. The letters with stars represent fluorescent probes, with A*, A*-bar, B* and B*-bar being the complements of A-bar, A, B-bar and B respectively, but with two extra bases and TET molecules dangling at the 5′ end.
Figure 6.
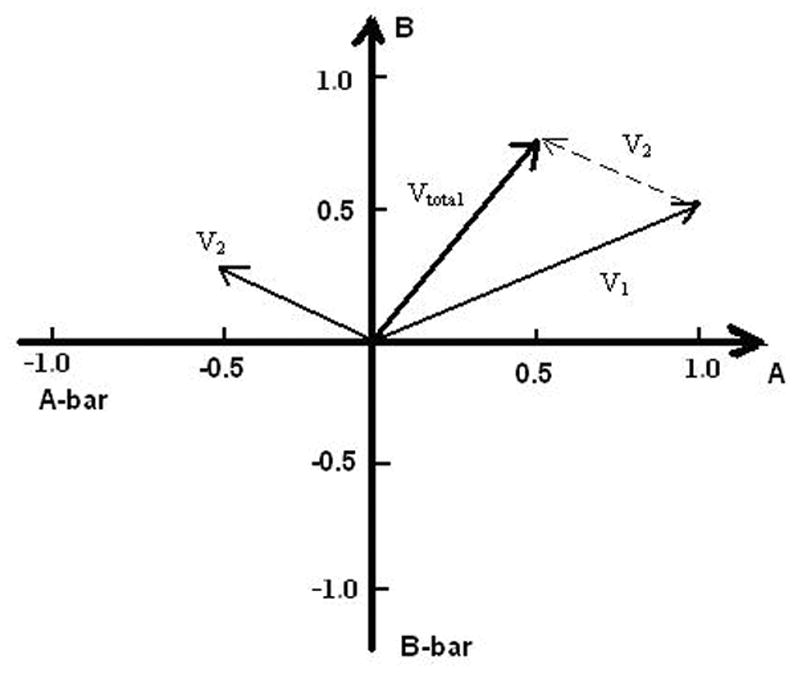
Addition of two vectors using the representation in DNA basis vector space. Two basis vectors A and B are represented by DNA strands amplified by the asymmetric PCR. V1=A+0.5B, V2= −0.5 A +0.25B and Vtotal =0.5 A + 0.75B.
Table 5.
Vectors detected using four fluorescent probes.
| number | Vector + probes | Results |
|---|---|---|
| 1 | V1+ A* | A+0.5B+ A* |
| 2 | V1 + A*-bar | (A|A*-bar)+0.5B |
| 3 | V1+ B* | A+0.5B+ B* |
| 4 | V1 + B*-bar | A+ 0.5(B|B*-bar) + 0.5B*-bar |
| 5 | V2 + A* | 0.5(A-bar|A*)+ 0.25B +0.5 A* |
| 6 | V2 + A*-bar | 0.5A-bar+0.25B+ A*-bar |
| 7 | V2 + B* | 0.5A-bar+0.25B+ B* |
| 8 | V2 + B*-bar | 0.5A-bar+0.25(B|B*-bar)+ 0.75 B*-bar |
| 9 | Vtotal + A* | 0.5A+0.5(A|A-bar)+0.75B+ A* |
| 10 | Vtotal + A*-bar | 0.5(A|A*-bar)+0.5 A*-bar +0.5(A|A-bar)+0.75B |
| 11 | Vtotal + B* | 0.5A+0.5(A|A-bar)+0.75B+ B* |
| 12 | Vtotal+ B*-bar | 0.5A+0.5(A|A-bar)+0.75(B|B*-bar)+0.25B*-bar |
Table 6 shows the concentration of eight ssDNA molecules used in this experiment. We defined 1.5 pmoles as 1 unit and calculated the volume of 1 unit of different DNA strands. First, 8V1 and 8V2 are made as shown in Table 7. Then 4Vtotal is made by mixing half of 8V1 and half of 8V2 together. 10μL nuclease free water was added into 4V1 and 4V2 for a total of 20μL. Then all the samples were incubated at 60°C for 1 hour. 13 samples were made according to Table 8 and samples #1 to #12 were incubated at 60°C for 1 hour. After being mixed with 1× loading buffer, all of these materials were loaded into a 15-well 15% TBE gel. The electrophoresis was run at 107V and 40°C for 80 minutes. The fluorescence image of the TET labeled DNA shown in Fig. 7 was taken with the excitation of a 15mW 514 nm laser.
Table 6.
Concentration of basis vectors, and their complements and fluorescent probes for the vector addition experiment.
| A | A-bar | B | B-bar | A* | A*-bar | B* | B*-bar | |
|---|---|---|---|---|---|---|---|---|
| Concentration (μM) | 2.43 | 0.9 | 1.88 | 1.15 | 0.34 | 0.48 | 0.4 | 0.48 |
| volume for 1 unit (μL) | 0.62 | 1.66 | 0.8 | 1.3 | 4.45 | 3.12 | 3.76 | 3.15 |
Table 7.
Basis vector composition of three vectors.
| 8V1 | 8A+4B | 4.96μl A+ 3.2μL B +1μL 1M NaCl +10.84μL N.Water |
| 8V2 | 4A-bar+2B | 6.64μL A-bar+ 1.6μL B+ 1μL 1M NaCl +10.76 μL N.Water |
| 4Vtotal | 4V1 +4 V2 | 2.48μL A+3.32μL A-bar+2.4μL B+ 1μL 1M NaCl + 10.8μL Water |
Table 8.
Samples for detecting addition results using four fluorescence probes
| #1 | 5μL V1 +4.45μL A* + 0.5μL 1M NaCl + 5.05 μL Water |
| #2 | 5μL V1 +3.12μL A*-bar + 0.5μL 1M NaCl + 6.38 μL Water |
| #3 | 5μL V1 +3.76μL B* + 0.5μL 1M NaCl + 5.74 μL Water |
| #4 | 5μL V1 +3.15μL B*-bar + 0.5μL 1M NaCl + 6.35 μL Water |
| #5 | 5μL V2 +4.45μL A* + 0.5μL 1M NaCl + 5.05 μL Water |
| #6 | 5μL V2 +3.12μL A*-bar + 0.5μL 1M NaCl + 6.38 μL Water |
| #7 | 5μL V2 +3.76μL B* + 0.5μL 1M NaCl + 5.74 μL Water |
| #8 | 5μL V2 +3.15μL B*-bar + 0.5μL 1M NaCl + 6.35 μL Water |
| #9 | 5μL Vtotal +4.45μL A* + 0.5μL 1M NaCl + 5.05 μL Water |
| #10 | 5μL Vtotal +3.12μL A*-bar + 0.5μL 1M NaCl + 6.38 μL Water |
| #11 | 5μL Vtotal +3.76μL B* + 0.5μL 1M NaCl + 5.74 μL Water |
| #12 | 5μL Vtotal+3.15μL B*-bar + 0.5μL 1M NaCl + 6.35 μL Water |
| #13 | 3μL 1μM TET-prime L20 |
Figure 7.
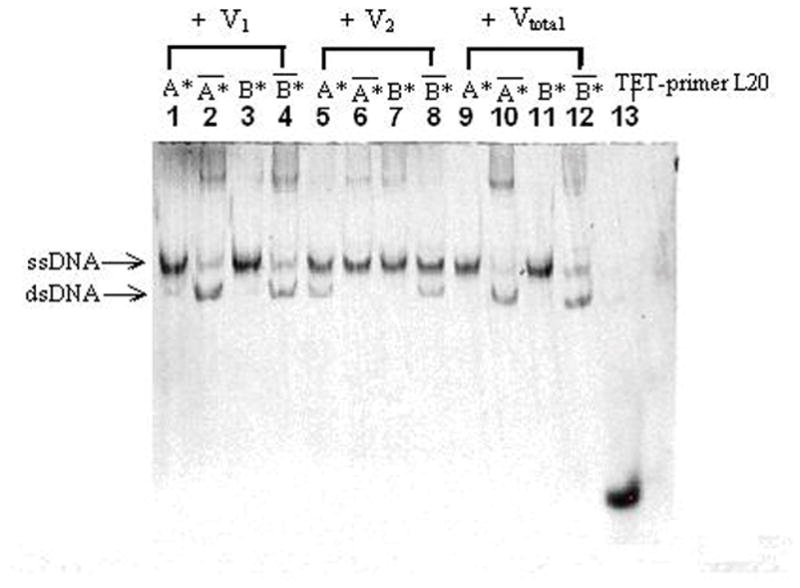

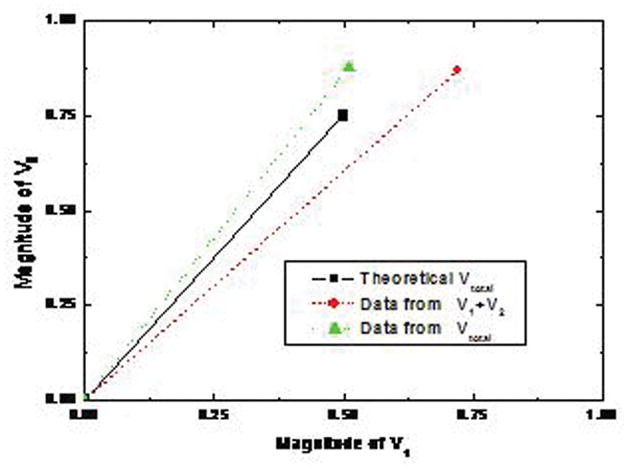
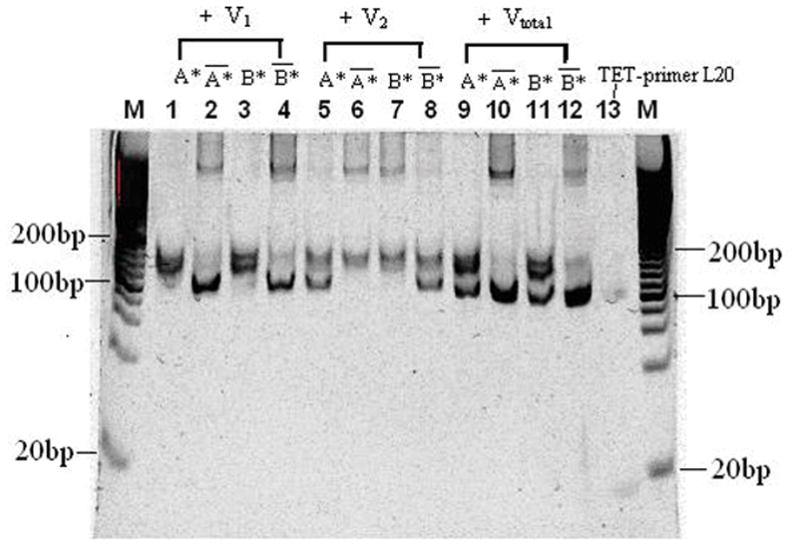
Fluorescence images of vectors using a 15mW 514 nm laser. The electrophoresis was run at 107V and 40°C for 80 minutes. (A) Lanes 1, 2, 3 and 4 show the fluorescence signal of V1 detected by using A*, A*-bar, B* and B*-bar respectively. Lanes 5, 6, 7 and 8 show the fluorescence signal of V2 detected by using A*, A*-bar, B* and B*-bar respectively. Lane 9, 10, 11 and 12 show the fluorescence signal of Vtotal by using A*, A*-bar, B* and B*-bar respectively. Lane 13 contains 3 pmoles of 22 bases TET primerL20. (B) The normalized intensities. Experimental results are V1=1A+0.62B, V2=−0.28A+0.25B and Vtotal=0.51A+0.88B obtained directly from the fluorescence signals. (C) The plot of theoretical value Vtotal=0.5A+0.75B, data from the numerical sum of the separate intensities measured for V1 and V2 and data from the DNA vector sum Vtotal.
In Table 5, samples 1, 3, 6, 7, 9 and 11 have only ssDNA probes existing by themselves, so only the ssDNA bands can be seen. The signals in the corresponding lanes in Fig. 7 (A) support our prediction. Samples 2, 4, 5, 8, 10 and 12 contain dsDNA formed by normal ssDNA and probes, which correspond to the fluorescence signals in Fig. 7 (A). Those longest bands near the top of the gel in lanes 2, 4, 6, 7, 10 and 12 may be clusters formed by the reaction between probe-bar and non-complement DNA or between DNA-bar and non-complement probe. The ssDNA band in lane 2 may come from the excess amount of A*-bar. From Table 5, the amount of ssDNA B*-bar and dsDNA (B|B*-bar) in sample 4 is equal, which matches well with the signals in lane 4 of Fig. 7 (A). The theoretical prediction of the ratio of ssDNA A* to dsDNA (A-bar|A*) of sample 5 is 1:1, however, the signal of ssDNA is apparently stronger than that of dsDNA in lane 5, which may be caused by the excess probes A*. The theoretical prediction of the ratio between B* and (B|B*-bar) of sample 8 is 3:1, and the ratio between the intensity of ssDNA signal and that of dsDNA signal matches well. The theoretical prediction of the ratio between A*-bar and (A|A*-bar) of sample 10 is 1:1, but the signal of ssDNA is weaker than that of dsDNA. The possible reason is that some A*-bar and ssDNA B formed the cluster DNA shown at the top of lane 10 due to the alternative opening and closing states of bubble-dsDNA structures which are easily trapped in the gel. The theoretically predictable ratio between (B|B*-bar) and B*-bar of sample 12 is 3:1, but the ratio between these two bands in lane 12 is slightly smaller, because some of probes B*-bar react with A and form longer DNA clusters which can be seen at the top of lane 12. The intensities of dsDNA in lanes 2, 4, 5, 8, 10 and 12 of Fig. 7 (A) indicate the components of A of V1, B of V1, A-bar of V2, B of V2, A of Vtotal, and B of Vtotal, respectively. By integrating the intensity of these dsDNA signals, and dividing them by the intensity of A of V1, the normalized components were obtained as V1=1A+0.62B, V2=−0.28A+0.25B and Vtotal=0.51A+0.88B shown in Fig. 7 (B). The theoretical and experimental data were plotted in Fig. 7 (C). The result indicates that the theoretical value and experimental value fit well.
In order to further investigate the theoretical prediction, the gel was stained in SYBR Gold solution for 40 minutes and the image shown in Fig. 8 was taken with 312 nm UV light. The total trend in Fig. 8 is similar to that in Fig. 7. Samples 1, 3, 6, 7 and 13 contain only ssDNA, which can be seen in lanes 1, 3, 6, 7 and 13 of Fig. 8. The others contain dsDNA and can be seen in the corresponding lanes in Fig. 8. In lanes 2 and 4, only dsDNA bands can be seen because most of ssDNA formed DNA clusters at the top band. In lanes 5 and 8, we can see both dsDNA band and ssDNA and their intensity is approximately equal because more SYBR Gold binds to dsDNA than equal length of ssDNA. In lanes 9 and 11, the intensity of ssDNA is stronger than that of ssDNA because the amount of dsDNA is much less than that of ssDNA. In lane 12, the amount of dsDNA is much larger than that of ssDNA so that the intensity of dsDNA is much stronger than that of ssDNA. Thus, vector addition can be implemented by random DNA strands from PCR and asymmetric PCR.
Figure 8.
Gel images of vectors using 312 nm UV light after SYBR Gold gel stain. The electrophoresis was run at 107V and 40°C for 80 minutes. Lane M contains 20bp DNA ladder. Lanes 1, 2, 3 and 4 show the SYBR Gold signal of V1 with A*, A*-bar, B* and B*-bar respectively. Lanes 5, 6, 7 and 8 show the SYBR Gold signal of V2 with A*, A*-bar, B* and B*-bar respectively. Lanes 9, 10, 11 and 12 show the SYBR Gold signal of Vtotal with A*, A*-bar, B* and B*-bar respectively. Lane 13 contains 22 bases ssDNA TET-primerL20.
This result is to be compared with the similar earlier experiment on vector addition [19] using determinate DNA unit vectors supplied by a commercial vendor using solid state synthesis. The results of the previous experiment exhibited deviations from perfect addition amounting to 10–40% of the expected vector increments and was qualitatively the same as the results obtained in the present work. The inaccuracies may be attributed to uncertainties in pipetting small volumes of liquid and in imprecisely known concentrations of the DNA components.
4 CONCLUDING REMARKS
In this paper, we proposed a method to obtain large numbers of different DNA oligomer samples that are relatively inexpensive and unlikely to hybridize with each other. Samples containing only 30 random molecules were successfully amplified using the polymerase chain reaction (PCR) method. These multiplicities of 30 molecules were further amplified using asymmetric PCR to give us useful quantities of DNA oligomers that may be utilized as basis vectors for matrix operations. The basis vectors are thus represented by solutions of single-stranded DNA oligomers and their complements. Starting with two basis vectors and their complements, we constructed two vectors, the amplitudes of which were proportional to the concentrations of the basis vectors. The two vectors were added by mixing their representative solutions, and vector sum so formed agreed to within 25% of the expected vector sum. We conclude that our random amplicons are able to implement some of the vector operations that will be required in a DNA implementation of an analog neural network.
Acknowledgments
FUNDING
National Science Foundation (CCF 0524203).
References
- 1.Adleman LM. Molecular computation of solutions to combinatorial problems. Science. 1994;266:1021–1021. doi: 10.1126/science.7973651. [DOI] [PubMed] [Google Scholar]
- 2.Braich RS, Chelyapov N, Johnson C, Rothemund PWK, et al. Solution of a 20-Variable 3-SAT Problem on a DNA Computer. Science. 2002;296:499. doi: 10.1126/science.1069528. [DOI] [PubMed] [Google Scholar]
- 3.Winfree E, Liu FR, Wenzler LA, Seeman NC. Design and self-assembly of two-dimensional DNA crystals. Nature. 1998;394:539–544. doi: 10.1038/28998. [DOI] [PubMed] [Google Scholar]
- 4.Seeman NC, Wang H, Yang XP, Liu FR, et al. New motifs in DNA nanotechnology. Nanotechnology. 1998;9:257–273. [Google Scholar]
- 5.Liu QH, Wang LM, Frutos AG, Condon AE, et al. DNA computing on surfaces. Nature. 2000;403:175–179. doi: 10.1038/35003155. [DOI] [PubMed] [Google Scholar]
- 6.Ogihara M, Ray A. DNA computing on a chip. Nature. 2000;403:143. doi: 10.1038/35003071. [DOI] [PubMed] [Google Scholar]
- 7.Lipton RJ. DNA solution of hard computational problems. Science. 1995;268:542–545. doi: 10.1126/science.7725098. [DOI] [PubMed] [Google Scholar]
- 8.Guarnieri F, Fliss M, Bancroft C. Making DNA add. Science. 1996;273:220–223. doi: 10.1126/science.273.5272.220. [DOI] [PubMed] [Google Scholar]
- 9.Yurke B, Mills AP, Jr, Cheng SL. DNA implementation of addition in which the input strands are separate from the operator strands. BioSystems. 1999;52:165–174. doi: 10.1016/s0303-2647(99)00043-x. [DOI] [PubMed] [Google Scholar]
- 10.Ouyang Q, Kaplan PD, Liu SM, Libchaber A. DNA solution of the maximal clique problem. Science. 1997;278:446–449. doi: 10.1126/science.278.5337.446. [DOI] [PubMed] [Google Scholar]
- 11.Yurke B, Turberfield AJ, Mills AP, Fimmel SC, et al. A DNA-fuelled molecular machine made of DNA. Nature. 2000;406:605–608. doi: 10.1038/35020524. [DOI] [PubMed] [Google Scholar]
- 12.Fontana W. Pulling strings. Science. 2006;314:1552. doi: 10.1126/science.1135101. [DOI] [PubMed] [Google Scholar]
- 13.Seeman NC. DNA enables nanoscale control of the structure of matter. Q Rev Biophys. 2005;38(4):363–371. doi: 10.1017/S0033583505004087. [DOI] [PMC free article] [PubMed] [Google Scholar]
- 14.Oliver JS. Matrix multiplication with DNA. J Molec Evol. 1997;45:161–167. doi: 10.1007/pl00006216. [DOI] [PubMed] [Google Scholar]
- 15.Hopfield JJ. Neural networks and physical systems with emergent collective computational abilities. Proc Nat Acad Sci USA. 1982;79:2554–2558. doi: 10.1073/pnas.79.8.2554. [DOI] [PMC free article] [PubMed] [Google Scholar]
- 16.Mills AP, Jr, Yurke B, Platzman PM. Article for analog vector algebra computation. Biosystems. 1999;52:175–180. doi: 10.1016/s0303-2647(99)00044-1. [DOI] [PubMed] [Google Scholar]
- 17.Mills AP, Jr, Yurke B, Platzman PM. DNA analog vector algebra and physical constraints on large-scale DNA-based neural network computation. DIMACS Series in Discrete Mathematics and Theoretical Computer Science. 2000;54:65–73. [Google Scholar]
- 18.Rumelhart DE, Hinton GE, Williams RJ. Parallel Distributed Processing: Explorations in the Microstructure of Cognition. 1986. Learning internal representations by error propagation; pp. 318–362. [Google Scholar]
- 19.Mills AP, Jr, Turberfield M, Turberfield AJ, Yurke B, et al. Experimental aspects of DNA neural network computation. Soft Computing. 2001;5:10–18. [Google Scholar]
- 20.Weyl AH. Space-Time-Matter 1950. Dover; pp. 23–26. 1st American Printing of the fourth edition of 1922, translated from the German by H. L. Brose) [Google Scholar]
- 21.Tanaka F, Kameda A, Yamamoto M, Ohuchi A. Design of nucleic acid sequences for DNA computing based on a thermodynamic approach. Nucleic Acids Res. 2005;33:903–911. doi: 10.1093/nar/gki235. [DOI] [PMC free article] [PubMed] [Google Scholar]
- 22.Wolffs P, Grage H, Hagberg O, Radstrom P. Impact of DNA Polyermases and their buffer systems on quantitative real-time PCR. Journal of Clinical Microbiology. 2004;42:408–411. doi: 10.1128/JCM.42.1.408-411.2004. [DOI] [PMC free article] [PubMed] [Google Scholar]
- 23.Klein D, Janda P, Steinborn R, Muller M, Salmons B, Gunzburg WH. Proviral load determination of different feline immunodeficiency virus isolates using real-time polymerase chain reaction: influence of mismatches on quantification. Electrophoresis. 1999;20:291–299. doi: 10.1002/(SICI)1522-2683(19990201)20:2<291::AID-ELPS291>3.0.CO;2-R. [DOI] [PubMed] [Google Scholar]