

Abstract
Tremor was recorded under simulated vitreoretinal microsurgical conditions as subjects attempted to hold an instrument motionless. Several autoregressive models (AR, ARMA, multivariate, and nonlinear) are generated to predict the next value of tremor. It is shown that a sixth order ARMA model predictor can predict a tremor having an amplitude of 96.6 ± 84.5 microns RMS with an error of 8.2 ± 5.9 microns RMS, a mean improvement of 47.5% over simple last-value prediction.
I. Introduction
Normal physiological hand tremor causes extraneous movement during microsurgery, making some high-precision operations difficult or impossible. Tremor is defined qualitatively as any roughly sinusoidal involuntary motion [1]. In recent years, quantitative modeling of tremor has been a subject of research [2, 3].
Several researchers have developed robotic systems to compensate or suppress tremor during microsurgery, including teleoperated systems and the Johns Hopkins “steady hand” system [4]. In our laboratory, a fully handheld active instrument called “Micron” has been developed, which measures its own motion, separates tremor from desired motion, and actuates the tool tip in real time to compensate for the tremor [5].
In a system such as Micron, a model of the tremor can be used for prediction during operation, and can also serve as a substitute for the human user in simulations of the control system. In this paper, several classes of autoregressive modeling techniques are applied to model tremor measured from five people under three different scenarios. Previous research has employed autoregressive techniques for tremor analysis, but these generally have not involved visual feedback, and certainly not with magnification [3, 6]. Furthermore, importantly, most such studies have simplified the spectrum by bandlimiting techniques such as prefiltering [6], analyzing the acceleration signal rather than displacement [3], or windowing for spectral analysis [7]. In contrast, this research involves modeling of the entire spectrum of movement (except for any constant bias or linear trend) during instrument pointing or station-keeping in a simulated vitreoretinal surgical environment, with magnified visual feedback, using standard autoregressive (AR), AR moving average (ARMA), multivariate AR, and nonlinear-augmented AR techniques.
II. Methods
A. Equipment
To accurately measure the Micron instrument tip, an optical system called ASAP (Apparatus to Sense Accuracy of Position) is used to provide the real-time position and orientation of the instrument. Two LEDs mounted to the instrument inside diffuse spheres pulse square waves, one at 2 kHz and the other at 3 kHz. The two signals are sensed by orthogonal position-sensitive detectors (PSD’s) (DL10, UDT Sensors Inc. Hawthorne, CA, USA) and demodulated to measure the tip position with an error of less than 10 μm RMS (root mean square) [8].
B. Experimental Procedure
Tremor data was acquired from five non-medical personnel subjects under a board-approved protocol. The setup, shown in Figure 1, shows a subject inserting the instrument through the hollowed out eye of the face mask. The instrument tip position and orientation is recorded by ASAP and displayed on the LCD computer monitor at 25X magnification. This “virtual Micron” setup mimics retinal surgery, a practical application of the Micron system.
Figure 1.

(a) ASAP measuring and displaying instrument position on LCD screen. (b) Instrument tip with LEDs being inserted through face mask eye. The two notches on opposite sides function as simulated sclerotomies to brace the tool.
The study involved three test conditions.
The first scenario asked the subject to hold the instrument vertically through the eye. The subject braced the instrument in a notch at the side of the eye and maintains the X, Y, and Z position of the tool tip at a set point on the screen (pointing task). This approximated a typical retinal surgery where the surgeon braces the tool against the sclera (the white of the eye).
Secondly, subjects were required to perform the same test as above, except without the bracing (i.e. the instrument shaft is not in contact with the face).
The last scenario asked the subjects to close their eyes and maintain the instrument as still as possible while bracing it against the notch in the eye.
In all three cases, the hand rested on the forehead of the face for stabilization. Each subject completed the three scenarios, rested briefly, and then completed the three scenarios again in reverse order. This second dataset enabled cross-validation of the models. All tremor was recorded at a sampling rate of 1 kHz for a duration of 60 s, with 45 s extracted from the middle of each recording to avoid ramp-up and ramp-down effects. The means and linear trends in the data were removed for normalization purposes. To reduce sensor noise, the signal was decimated to 40 Hz.
C. Modeling Techniques
Autoregressive techniques simplify a dataset to a mathematical model dependent only on a small number of parameters [7]. These parameters are estimated from the data and can be used to recreate the signal or predict future values of the signal. Autoregressive techniques model a signal as a linear combination of past inputs and outputs. A standard autoregressive (AR) model of order p represents the value of signal x at position n by a weighted average a of the previous signal values and some error  :
:
| (1) |
Multivariate AR models exploit relationships that exist between multiple signals [9]. For Micron, three tremor signals corresponding to the X, Y, and Z axis are available and may provide additional information when modeled together. In this case, Xn is a three element vector of the X, Y, and Z tremor components and the averaging coefficients are 3×3 matrices A such that:
| (2) |
An autoregressive moving average (ARMA) considers not only previous signal values, but a weighted average b of some additional input [10]. For a single signal, the input is taken to be the error terms of previous predictions:
| (3) |
These autoregressive techniques can only model linear systems. Although there is some evidence [11] for tremor as a linear process, a complete characterization of tremor has not been achieved. Thus, autoregressive techniques augmented with nonlinear regression via wavelet networks [12] were briefly investigated to model any nonlinear processes that might be appearing in the tremor or visual feedback loop.
For each subject and scenario, all four model types were estimated for orders one to forty on the first dataset. Except for the multivariate autoregression, each X, Y, and Z component of the tremor was treated as a separate signal and modeled by itself. To validate how well the constructed model represents the particular subject and scenario being analyzed, it was applied to the second dataset recorded under identical conditions. The evaluation criterion for the model was the root mean squared error (RMSE) magnitude of the difference between the true recorded signal and the predicted signal. A simple last-value predictor, x̃n = xn−1, was also calculated as a baseline for comparison.
III. Results
The mean RMS tremor amplitude is 73.7 ± 53.9, 100.6 ± 100.2, and 115.5 ± 89.8 μm for Scenarios 1–3 with 3.4 ± 3.0 μm sensor noise. Each model is applied to predict tremor.
A. AR and ARMA Models
Figures 2–4 show the result of applying AR and ARMA models of increasing order. The data in each figure are derived from one person across scenarios and tremor signal components. The RMSE magnitudes achieved by predictions of AR and ARMA models 1 to 40 are displayed and compared to the simple baseline last-value predictor. Order 40 predicts the next value from one second of past signal.
Figure 2.

AR and ARMA results for X (top), Y (middle), and Z (bottom) tremor components for a typical subject under Scenario 1 (instrument braced against side of eye). For this sample, tremor amplitude is 45.4, 62.9, and 5.4 μm RMS in x, y, and z, respectively.
Figure 4.

AR and ARMA results for X (top), Y (middle), and Z (bottom) tremor components for a typical subject under Scenario 3 (instrument braced, but no visual feedback). For this sample, tremor amplitude is 254.0, 166.1, and 15.2 μm RMS in x, y, and z, respectively.
As evidenced by the graphs, both AR and ARMA models perform better than the baseline predictor. While for high orders AR and ARMA models converge, the ARMA model tends to converge much more quickly, by sixth order or lower, which is in agreement with [6, 7]. The results shown are from a typical subject; for some subjects the RMSE trends slightly upwards for higher orders of AR. Figures 8–10 provide a graphical understanding of the frequency and phase characteristics of the generated sixth order ARMA models by presenting Bode plots for the X, Y, and Z models derived from one subject’s Scenario 1 test.
Figure 8.
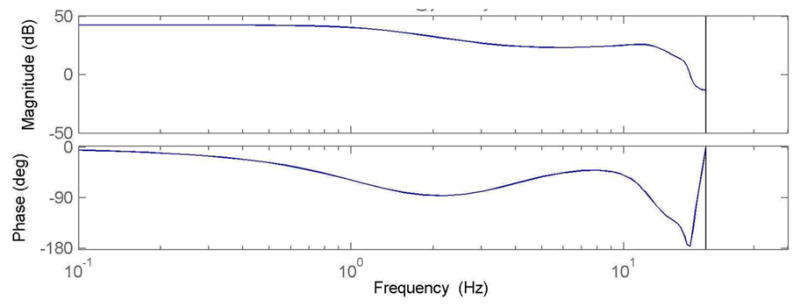
Bode diagram of Scenario 1 ARMA model for X component
Figure 10.

Bode diagram of Scenario 1 ARMA model for Z component
Numerically, the last-value predictor achieves a mean reduction of 81.5% in RMSE magnitude over all the subjects and scenarios. Using this as a baseline predictor, Figure 5 shows that AR and ARMA models improve the prediction by roughly 20–50%, depending on the model order used.
Figure 5.

Mean percentage improvement for AR and ARMA in comparison with last-value prediction.
B. Nonlinear and Multivariate Models
The nonlinear model used was a wavelet network [12] that augmented the standard autoregressive model. One interesting result of adding the wavelet nonlinear regression is the tendency of the nonlinear regression to overfit the data. For the dataset used to construct the model, the nonlinear approached improved the prediction. However, when tested on the cross-validation dataset, the results showed very slight improvement. For a fifth-order model, the nonlinear regression reduced the RMSE by 0.1%.
In contrast, the multivariate standard autoregressive model led to a 0.2% increase in RMSE on the cross-validation set for a second-order model and oftentimes yielded an unstable fit at higher model orders. In many instances, for orders larger than 15, the multivariate models no longer outperform last-value prediction. While an improvement can be achieved on the training dataset, performance was markedly degraded on the cross-validation set.
C. Generalized ARMA Model
While a model per person per scenario is indeed useful, a unified model that generalizes across both people and scenarios would be more advantageous as it alleviates the need for a pre-usage calibration step. Because it has proven superior in prediction than an AR model and is less complex than a nonlinear model, only the ARMA model was investigated. First, the variances of the model parameters were examined. Figure 6 shows a box and whisker plot of the first six coefficients for all ARMA models. This shows the median values for the coefficients, in addition to the lower and upper quartiles, and the furthest data points within a factor of 1.5 of the interquartile range. Outliers are represented as crosses.
Figure 6.

Box and whisker plot of the ARMA coefficients (the error term coefficients yield a similar plot with smaller coefficients).
The ARMA error coefficients are similar for different trials. By taking the mean of these coefficients, an averaged ARMA model can be constructed that represents all subjects and all scenarios. Applying the averaged model to each cross-validation run shows a slight drop in overall accuracy from 48.0% to 47.5% improvement over the baseline. A reduction in accuracy of approximately half a percent may be a preferable alternative to a time-consuming calibration routine that learns the ARMA coefficients for each new user. The predicted RMSE for Scenarios 1–3 is 8.9 ± 9.3, 9.2 ± 9.2, and 9.8 ± 8.9 μm. Additionally, the frequency and phase responses are shown in Figure 7 as a Bode diagram.
Figure 7.

Bode diagram of sixth order mean ARMA model.
IV. Discussion
In this preliminary study of modeling and predicting tremor using autoregressive techniques with five subjects under three different scenarios, a sixth-order ARMA model predicted tremor 48.0% better, on average, than a baseline last-value predictor. A single ARMA model derived from an average of all ARMA models shows that the problem can be generalized across all three scenarios and subjects with only a 0.55% drop in accuracy. With this single ARMA model, the tremor was predicted with a mean of 8.2 ± 5.9 μm RMSE using raw hand movement signals with a mean of 96.6 ± 84.5 μm RMS amplitude.
This paper also investigated other autoregressive models. The standard AR model performs nearly as well as ARMA, but only at much higher model orders. The multivariate AR model did not generalize well from the data used to estimate the model to the cross-validation data. AR models augmented with nonlinear wavelet networks marginally increased prediction performance, but likely not enough to warrant the additional complexity. Plans for future work include studies with larger numbers of subjects and more realistic microsurgical movements.
Figure 3.

AR and ARMA results for X (top), Y (middle), and Z (bottom) tremor components under Scenario 2 (instrument not braced against side of eye). For this sample, tremor amplitude is 46.4, 31.9, and 24.1 μm RMS in x, y, and z, respectively.
Figure 9.

Bode diagram of Scenario 1 ARMA model for Y component
Acknowledgments
This work was supported in part by the National Institutes of Health (R21 EY016359), the American Society for Laser Medicine and Surgery, the National Science Foundation (EEC-9731748 and Graduate Research Fellowship), and the ARCS Foundation.
Contributor Information
Brian C. Becker, Email: briancbecker@cmu.edu, Robotics Institute, Carnegie Mellon University, Pittsburgh, PA 15213 USA.
Harsha Tummala, Department of Electrical Engineering & Computer Science, University of California–Berkeley, Berkeley, CA, 94720.
Cameron N. Riviere, Email: camr@ri.cmu.edu, Robotics Institute, Carnegie Mellon University, Pittsburgh, PA 15213 USA.
References
- 1.Elble RJ, Koller WC. Tremor. Baltimore: Johns Hopkins; 1990. [Google Scholar]
- 2.Morrison S, Keogh J. Changes in the dynamics of tremor during goal-directed pointing. Hum Mov Sci. 2001;20:675–693. doi: 10.1016/s0167-9457(01)00072-0. [DOI] [PubMed] [Google Scholar]
- 3.Timmer J. Modeling noisy time series: physiological tremor. Int J Bifurcation Chaos. 1998;8:1505–1516. [Google Scholar]
- 4.Taylor RH, Jensen P, Whitcomb LL, Barnes AC, Kumar R, Stoianovici D, Gupta P, Wang ZX, deJuan E, Kavoussi LR. A steady-hand robotic system for microsurgical augmentation. 2nd Int Conf Med Image Comput Comput Assist Intervention. 1999:1031–1041. [Google Scholar]
- 5.Riviere CN, Ang WT, Khosla PK. Toward active tremor canceling in handheld microsurgical instruments. IEEE Trans Robot Autom. 2003;19:793–800. [Google Scholar]
- 6.Zhang J, Chu F, Mohammed N. Proc Am Contr Conf. Portland, OR, USA: 2005. DSP controller based signal processing of physiological hand tremor; pp. 1569–1574. [Google Scholar]
- 7.Spyers-Ashby JM, Bain PG, Roberts SJ. A comparison of fast Fourier transform (FFT) and autoregressive (AR) spectral estimation techniques for the analysis of tremor data. J Neurosci Methods. 1998;83:35–43. doi: 10.1016/s0165-0270(98)00064-8. [DOI] [PubMed] [Google Scholar]
- 8.MacLachlan RA, Riviere CN. High-speed microscale optical tracking using digital frequency-domain multiplexing. IEEE Trans Instrum Meas. 2008 doi: 10.1109/TIM.2008.2006132. in press. [DOI] [PMC free article] [PubMed] [Google Scholar]
- 9.Neumaier A, Schneider T. Estimation of parameters and eigenmodes of multivariate autoregressive models. ACM Trans Math Soft. 2001;27:27–57. [Google Scholar]
- 10.Makhoul J. Linear prediction: a tutorial review. Proc IEEE. 1975;63:561–580. [Google Scholar]
- 11.Gantert C, Honerkamp J, Timmer J. Analyzing the dynamics of hand tremor time series. Biol Cybern. 1992;66:479–484. doi: 10.1007/BF00204112. [DOI] [PubMed] [Google Scholar]
- 12.Zhang J, Walter GG, Miao Y, Lee WNW. Wavelet neural networks for function learning. IEEE Trans Signal Process. 1995;43:1485–1497. [Google Scholar]