Abstract
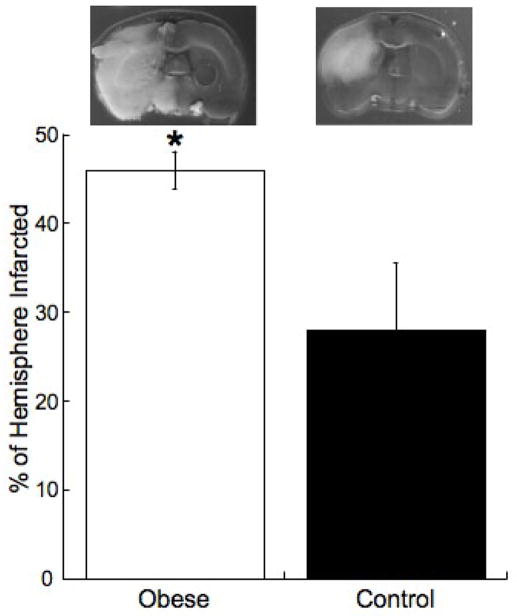
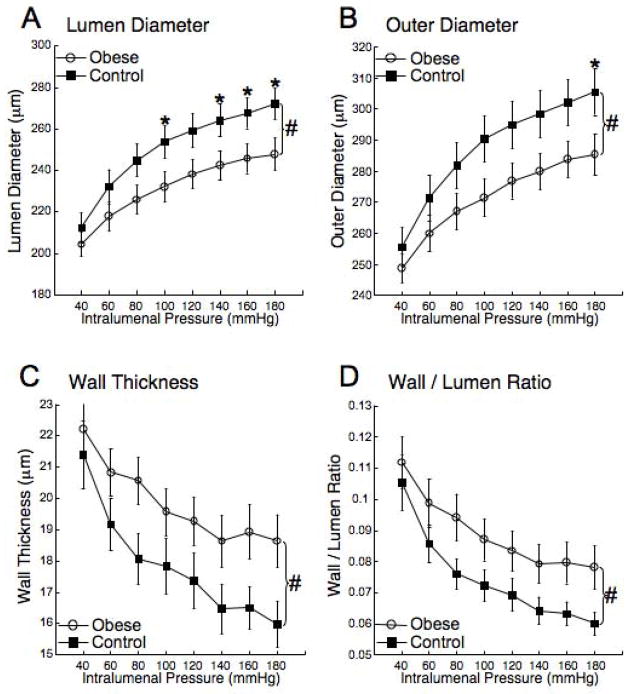
Hypertension, elevated fasting blood glucose and plasma insulin develop in rats fed a high fat (HF) diet. Our goal was to assess the effects of obesity, beginning in childhood, on the adult cardiovascular system. We hypothesized that rats fed a HF diet would have larger ischemic cerebral infarcts and middle cerebral artery (MCA) remodeling. Three-week-old male Sprague Dawley rats were fed a HF (Obese) or control diet for 10 weeks. Cerebral ischemia was induced by MCA occlusion (MCAO). MCA structure was assessed by pressure myography and cerebral vessel matrix metalloproteinase (MMP) activity and expression and collagen levels were measured in vessels from rats that did not undergo MCAO. The cerebral infarct was greater in the obese rats than the control (46.0±2.1 vs 28.0±7.5 percent of the hemisphere infarcted, obese vs control p<0.05). The MCAs from obese rats had smaller lumens (232±7.2 vs 254±7.8μm obese vs control p<0.05) and thicker walls (19.6±0.8 vs 17.8± 0.9μm obese vs control p<0.05) and were less compliant than MCAs from control rats. MMP-2 activity and collagen I expression were increased in vessels from obese rats and MMP-13 expression was reduced. These results suggest obesity, beginning in childhood, causes inward vessel remodeling with a concomitant increase in vessel stiffness due to increased collagen deposition. These changes in MCA structure may be responsible for the increase in the ischemic damage after MCAO.
Keywords: Obesity, Hypertension, Vessel Remodeling, Matrix Metalloproteinase
Introduction
Metabolic syndrome, described as obesity, insulin resistance, impaired glucose tolerance, hyperinsulinemia, dyslipidemia and hypertension (Reaven, 1988), increases an individual’s risk of developing type 2 diabetes (Festa et al., 2000; Klein et al., 2002); the incidence of which is increasing worldwide (Bagust et al., 2002; Mokdad et al., 2003). Patients with type 2 diabetes are at increased risk for developing cardiovascular disease (Grundy et al., 1999). Importantly, type 2 diabetes increases the risk of stroke, and 70% of new stroke patients have diabetes or prediabetes (Kernan and Inzucchi, 2004).
Stroke is the third most common cause of death in the U.S and the leading cause of long-term disability (Rosamond et al., 2008). Studies suggest the outcome of an ischemic stroke is directly affected by the structure and function of the cerebral vasculature. For instance, the large infarcts observed in stroke-prone spontaneously hypertensive rats (SHRSP) appear to be due, at least in part, to a reduced middle cerebral artery (MCA) lumen diameter (Coyle and Jokelainen, 1983). Few studies have characterized the effects of diabetes or obesity on cerebral vessels. One study using Goto-Kakizaki type 2 diabetic (GK) rats showed that the wall/lumen ratio and vessel collagen deposition were increased in diabetic rats compared to control (Harris et al., 2005). A recent study showed that obese Zucker rats have a reduced MCA lumen diameter and increased myogenic tone (Osmond et al., 2009). The obese Zucker rats are morbidly obese and therefore are not particularly reflective of the human population. No studies have investigated the effects of purely diet-induced obesity on the cerebral vasculature in a rat strain that has not been genetically modified. It is important to note that one cannot extrapolate the findings in the peripheral vasculature to the cerebral vessels. The larger cerebral arteries have been shown to contribute considerably to the total vascular resistance and the control of cerebral blood flow (Harper et al., 1984), making the study of their structure and function pertinent to the pathogenesis of cerebral ischemia.
To facilitate the study of the effects of diet-induced obesity several animal models have been described (Carroll et al., 1996; Hall et al., 1998). In the model developed by Levin et al (Levin et al., 1983), rats begin consuming a HF diet as adults and 50% become obese and hypertensive. This model mimics the effects of human obesity (Dobrian et al., 2000); renin-angiotensin system activation (Hall, 1994), increased leptin (Hirose et al., 1998), reduced growth hormone secretion (Kopelman et al., 1985) and increased oxidative stress (Van Gaal et al., 1995). While this model mimics the Western diet, it does not allow for investigation of the effect of obesity beginning in childhood on the adult cardiovascular system. This is an important clinical question as the incidence of childhood obesity has increased by more than 100% in the past 30 years (Rocchini, 2002) and longitudinal studies show childhood obesity is a risk factor for adult obesity (Kvaavik et al., 2003; Whitaker et al., 1997). To address this, we developed a model of obesity, where the rats begin consuming a HF diet at the earliest possible age of 3 weeks and continue into adulthood. Unlike the adult onset obesity model, almost 100% of the rats receiving the HF diet become obese and hypertensive and have elevated fasting blood glucose and plasma insulin (Smith et al., 2006; Zhou et al., 2005). Our goal was to assess the effects of diet induced obesity on the cardiovascular system. We hypothesized that these rats would have larger ischemic cerebral infarcts than control rats and that their MCAs would have smaller lumen and outer diameters. We also proposed that the vessels from the obese rats would be stiffer as a result of alterations in collagen deposition and MMP activity.
Methods
Animals
Three-week-old male Sprague Dawley rats were obtained from Harlan (Indianapolis IN). Rats were maintained on a 12-hour light/dark cycle, housed two per cage and allowed access to food and water ad libitum. These studies were approved by the Institutional Animal Care and Use committee and were carried out in accordance with the National Institutes of Health guide of the care and use of laboratory animals. Rats were fed the HF diet (36% fat; 15.2% saturated, 20.8% unsaturated, 0.4% sodium, and 0.6% potassium; Bioserve, Frenchtown, NJ) for 10 weeks; these will be referred to as obese rats. Control rats received normal chow (4.4% fat; 2.5% saturated, 1.9% unsaturated, 0.39% sodium, and 1.0% potassium; Harlan).
Blood pressure
Blood pressure was measured by tail-cuff using a RTBP1001 rat-tail blood pressure system (Kent Scientific, Torrington CT).
MCAO
Rats were anesthetized with isoflurane and oxygen, and body temperature was maintained at 37°C throughout the surgery. The MCA was permanently occluded using the intralumenal occlusion technique. The common carotid artery was exposed and the branches of the external carotid artery were cauterized. A 3-0 monofilament thread with a rounded tip was introduced into the carotid artery and advanced cranially into the internal carotid artery over a distance of 19mm, measured from the bifurcation of the common carotid artery. The thread was left in place and the rats were allowed to recover. MCAO was confirmed by laser Doppler flowmetery (Rigsby et al., 2007a). Post-occlusion (24 hours) the area of the infarction was quantified using 2,3,5-triphenyltetrazolium (TTC) staining, the cerebral infarct size was corrected for the presence of edema using the following equation, % Hemisphere Infarcted = ((VL−VC)/VC) * 100 where VL is the volume of the lesioned hemisphere and VC is the volume of the control hemisphere (Swanson et al., 1990).
MCA Function and Structure
The first branch-free segment of the MCA most proximal to the Circle of Willis was dissected and placed in cold physiological salt solution (PSS in mmol/L: 141.9 NaCl, 4.7 KCl, 1.7 MgSO4, 0.5 EDTA, 2.8 CaCl2, 10.0 HEPES, 1.2 KH2PO4, and 5.0 glucose). The vessel was mounted on two glass micropipettes (outer diameter, 125–150 μm) and secured with silk thread in a pressure myograph (Living Systems Instrumentation, Burlington, VT). The distal pipette was closed off, creating a zero-flow or blind-sac experiment, and vessels demonstrating leaks were discarded. Vessels were pressurized to 75 mmHg and the myograph was placed on an inverted microscope connected to a camera and monitor. A calibrated video dimension analyzer was used to obtain lumen diameter and wall thickness measurements in micrometers. Based on previous experiments performed in the rat MCA (Cipolla et al., 2000), vessels were allowed to equilibrate for 1 hour at 75 mmHg and 37°C in PSS at a pH of 7.4. This pressure lies within the autoregulatory range of the rat MCA and is close to the pressure normally experienced by this vessel (Coulson et al., 2002). The lumen diameter was measured after a 10 minute incubation at an intralumenal pressure of 80mmHg and 140mmHg to allow for the calculation of myogenic tone. Concentration response curves to serotonin (5-HT) and adenosine diphosphate (ADP) were constructed as described previously (Rigsby et al., 2007b). After washing the final concentration of ADP from the bath the contraction in response to L-NAME (10−5M) was measured to provide an estimate of nitric oxide (NO) production. The PSS was replaced with calcium-free PSS containing 2.0 mmol/L EGTA and the intralumenal pressure was dropped to 3mmHg and the lumen and outer diameter and wall thickness were measured after a 7 minute incubation. The intralumenal pressure was increased to 20mmHg and the measurements were taken after a 7 minute equilibration. Thereafter, the pressure was increased in 20mmHg increments to 180mmHg with the vessel being allowed to equilibrate for 7 minutes before taking readings. Myogenic tone was assessed using the following formula: 1-(active diameter/passive diameter)*100 (Rigsby et al., 2007b). The wall/lumen ratio, circumferential wall stress and wall strain were calculated (Rigsby et al., 2007a). The elastic modulus (β-coefficient) was calculated from the stress/strain curves for the individual vessels, these curves were fitted using KaleidaGraph software (Synergy Software, Reading PA) to an exponential model (y=aeβx) where β is the slope of the curve: the higher the β-coefficient the stiffer the vessel. Only curves with an R2 value equal to or greater than 0.95 were used in the analysis, for this study, all of the vessels met this requirement.
Tissue homogenization and zymography
Vessels used for zymography were obtained from naive rats that had not undergone MCAO. Snap-frozen cerebral vessels (MCA, anterior and posterior communicating and ophthalmic arteries) were placed in modified radioimmunoprecipitation assay (RIPA) buffer (50 mmol/l Tris-HCl, 1% Nonidet P-40, 0.25% Na-deoxycholate, 150 mmol/l NaCl, 1 mmol/l phenylmethylsulfonyl fluoride, 1 μg/ml aprotinin, 1 μg/ml leupeptin, 1 μg/ml pepstatin, 1 mmol/l sodium orthovanadate, and 1 mmol/l sodium fluoride) and sonicated, total protein was measured using the Bradford method (BioRad, Richmond, CA). Samples (20 μg protein/sample) were loaded onto 10% gelatin zymogram gels (BioRad) and separated by molecular weight under nonreducing conditions. The gels were then rinsed twice in 2.5% Triton X-100 and incubated for 24 h in substrate buffer containing 21 mmol/l Tris-HCl, 10 mmol/l CaCl2, with Coomassie blue R-250 followed by and 0.04% NaN3. Gels were then stained destaining in 55% methanol and 7% acetic acid. Lytic activity was viewed as clear bands on a dark blue background and was quantitated by densitometric analysis (Gel-Pro version 3.1; Media Cybernetics, Carlsbad, CA). Kaleidoscope protein standards (Bio-Rad) and recombinant MMP-2 protein (Calbiochem, San Diego, CA) were run in parallel with all samples.
Collagen Slot Blots and Western Blots
The samples produced for zymography were used for Western and slot blots. For slot blots, 40μg of protein was applied directly to PVDF membrane via a filtration manifold. For the Western blots samples were electrophoretically transferred to PVDF membrane after SDS-PAGE. After blocking, the membranes were incubated with a primary antibodies to collagen I or IV (slot blots) or MMP-13 (Western blot) followed by an HRP linked secondary antibody. The protein bands were visualized with ECL and quantified by densitometry. The membranes were stripped and reprobed for actin and the results were corrected for actin expression.
Statistics
All results are represented as a mean ± standard error of the mean. MCA structure data and concentration response curves were analyzed by two-way repeated measures ANOVA with a Bonferroni post-test. Blood pressure, cerebral infarct size, body weights, myogenic tone, L-NAME induced contraction, and β-coefficients were compared using Student’s t-test. A p-value ≤ 0.05 was considered significant.
Results
Cerebral Infarct Size
The obese rats were significantly heavier than the control rats (390.4±7.7 vs 325.6±9.1 grams obese vs control p<0.01). Cerebral ischemia was induced by MCAO, after 24 hours of ischemia the cerebral infarct was significantly larger in the obese rats than control (Figure 1). Systolic blood pressure was increased in the obese rats compared to control (161±2 vs 137±2mmHg obese vs control p<0.05). We have previously reported that fasting blood glucose and plasma insulin levels are increased in this model of obesity (Smith et al., 2006).
Figure 1. The obese have larger ischemic infarcts than control rats.
Rats were fed the HF or control diets for 10 weeks beginning at 3 week of age. Cerebral ischemia was induced by MCAO and the size of the resultant infarct was assessed after 24 hours. The upper panel shows representative brain slices, the grey tissue is viable and the white tissue is tissue damaged by ischemia. The lower panel shows the percentage of the hemisphere infarcted (n=6 for obese and n=8 for control, *=p<0.05 compared to control by t-test).
MCA Function and Structure
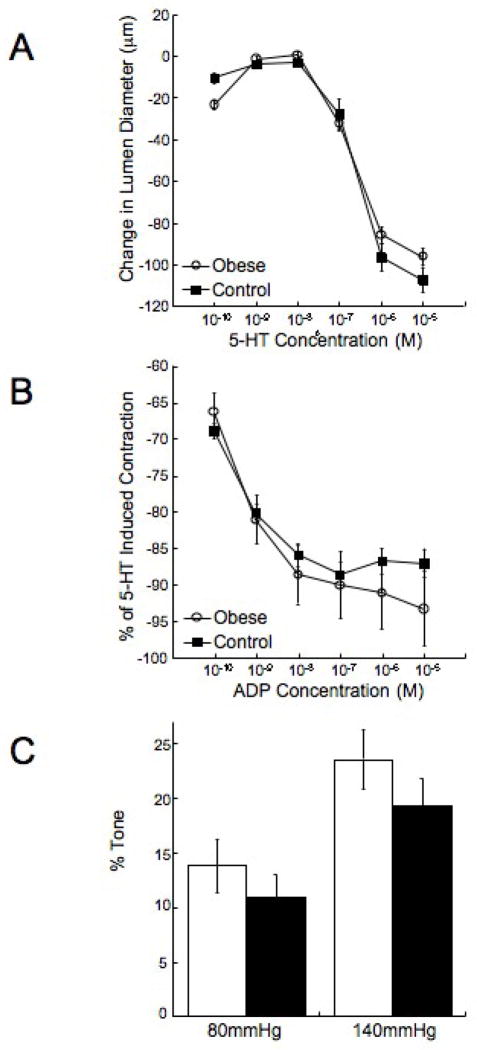
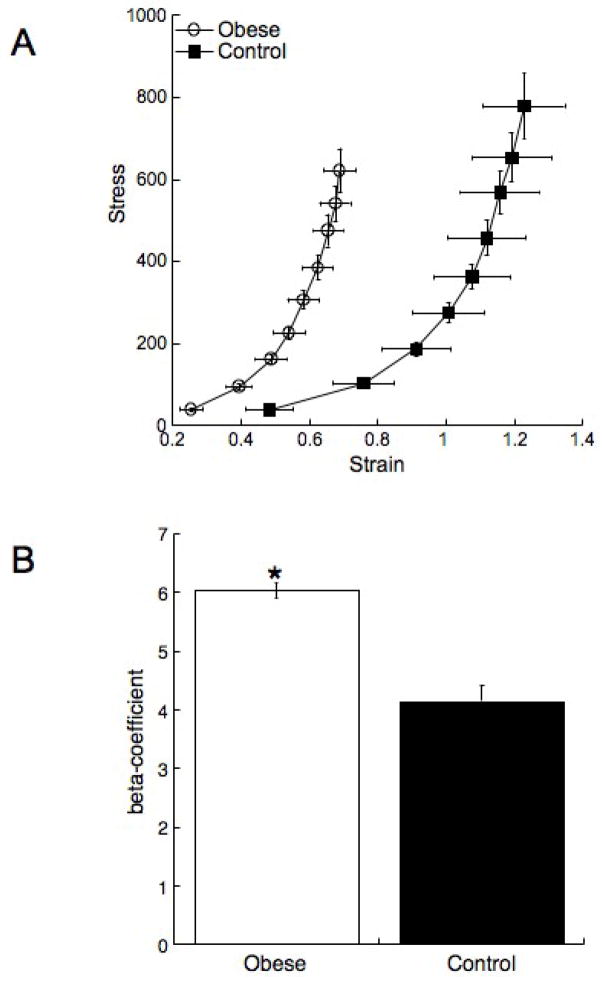
There were no differences in the response of the MCA to 5-HT or ADP between the obese and the control rats (Figure 2A and B). The vessels from the obese rats did not exhibit an enhanced capacity to generate myogenic tone (Figure 2C), and the reduction in lumen diameter in response to L-NAME was not different between the two groups (22±5.3 vs 27±6.9 μm, obese vs control). MCA structure was measured under zero flow and calcium free conditions. The MCA lumen and outer diameters were reduced in the obese rats compared to control (Figure 3A and B). At the highest intralumenal pressure the lumen and outer diameters were approximately 20μm smaller in the obese rats. This was accompanied by an approximately 3μm increase in the vessel wall thickness (Figure 3C) and a 30% increase in the wall/lumen ratio (Figure 3D) in the obese rats. The vessels from the obese rats were less compliant than the control vessels as evidenced by a leftward shift in the stress/stain curve (Figure 4A). The MCAs from the obese rats were also stiffer than vessels from the control rats as shown by the increase in the β-coefficient for the vessels (Figure 4B).
Figure 2. Obesity has no effect on the response of the MCA to 5-HT or ADP.
Rats were fed the HF or control diets for 10 weeks beginning at 3 weeks of age. 5-HT (A) and ADP (B) concentration response curves were generated using a small vessel arteriograph. The ability of the MCA to generate tone was also assessed using the pressure myograph (C) (n=8 for both groups).
Figure 3. Obesity reduces the MCA lumen and outer diameters and increases wall thickness and wall/lumen ratio.
Rats were fed the HF or control diets for 10 weeks beginning at 3 weeks of age, MCA lumen (A) and outer diameter (B), wall thickness (C) and wall/lumen ratio (D) was assessed over a range of intralumenal pressures using a small vessel arteriograph under zero flow and calcium free conditions (n=15 for obese and n=16 for control, #=p<0.05 by ANOVA, *=p<0.05 compared to control in post-hoc analysis).
Figure 4. Obesity reduces vessel compliance and increases vessel stiffness.
Rats were fed the HF or control diet for 10 weeks from 3 week of age. At the end of the treatment the MCA structure was assessed using a small vessel arteriograph. Vessel compliance was assessed by plotting a stress/strain curve (A) a leftward shift in the curve indicates a less complaint vessel. The β-coefficient (B) was calculated from the individual stress/strain curves (n=15 for obese and n=16 for control *=p<0.05 compared to control by t-test).
MMP Activity and Expression and Vessel Collagen Levels
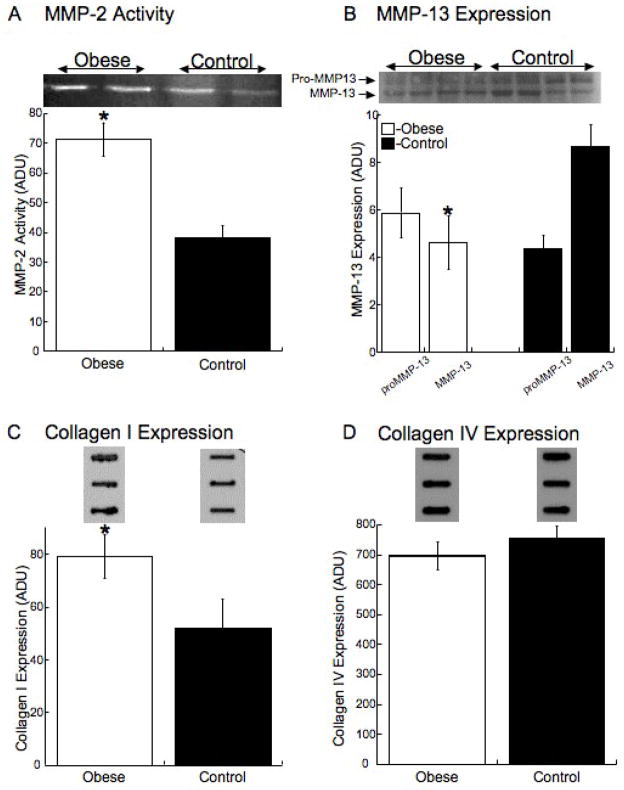
The activity of MMP-2 was increased by 2 fold the cerebral vessels from the obese rats (Figure 5A). Active MMP-13 expression was decreased by 50% in the cerebral vessels from the obese rats while proMMP-13 expression was unchanged (Figure 5B). There was a significant increase in the level of collagen 1 in the cerebral vessels from the obese rats (Figure 5C) and no change in the level of collagen IV (Figure 5D).
Figure 5. Obesity increases the activity of MMP-2 and collagen I expression and reduces MMP-13 expression.
Rats were fed the HF or control diet for 10 week from 3 weeks of age, at the end of the treatment the rats were euthanized and the cerebral vessels were collected. MMP-2 activity was measured in cerebral vessels by gelatin zymography (A) (n=4 for each group, *=p<0.05 compared to control by t-test). MMP-13 expression was measured Western blot analysis (B), collagen I (C), and collagen IV (D) were measured by slot-blot analysis (n=7–8 for each group, *=p<0.05 compared to control by t-test). Representative zymograms and Western Blotts and slot blots are shown above the quantitative data.
Discussion
There are three novel findings from these studies. Firstly we found that diet induced obesity increases the damage caused by a permanent ischemic stroke. Secondly, the structure of the MCA, the vessel most commonly occluded in humans, is altered in obese rats in a manner that would impede blood flow. Lastly, we have shown that MMP activity and expression is altered in the obese rats and that this increases collagen I deposition.
To the best of our knowledge this is the first study to document an increase in ischemic damage after MCAO in a model of diet-induced obesity. The diet used in the current studies mimics the Western diet and the rats have hypertension, which is a primary risk factor for stroke. They also have elevated fasting blood glucose and plasma insulin levels suggesting they are insulin resistant. Others have shown that the cerebral infarct size is increased in the ob/ob mouse model of obesity (Mayanagi et al., 2008) and the obese Zucker rat (Osmond et al., 2009). However, these studies used an ischemia reperfusion model that has a different pathogenesis from the permanent ischemia model used in the current studies. Several injury-inducing factors come into play with reperfusion, including increased oxidative stress and enhanced blood brain barrier breakdown. With permanent ischemia, changes in infarct size largely reflect the ability of the cerebral blood vessels to dilate in response to the ischemic insult. This vascular function is significantly impacted by changes in vessel lumen diameter (Baumbach and Heistad, 1989). The smaller passive lumen diameter observed in the obese rats suggests that, even when maximally dilated, cerebral blood flow will be impaired.
Interestingly, type II diabetes alone does not increase the damage caused by cerebral ischemia, the damaged caused by MCAO is reduced in GK rats compared to control (Ergul et al., 2007). Unlike the rats used in the current study, the GK rats are not obese and do not develop hypertension.
Despite the changes in vessel structure we were unable to detect differences in the ability of the vessels to contract and dilate to 5-HT and ADP respectively between control and obese rats. There were also no changes in the ability of the MCA to generate tone, and basal NO production is not impaired in the obese rats. This suggests the changes in the vasculature are largely structural and do not relate to alterations in signaling pathways or the smooth muscle contractile machinery. Previous studies, including some from our own laboratory (Rigsby et al., 2007a) have shown that cerebral vessel structure is altered by more malignant forms hypertension (Rigsby et al., 2007b). There is a paucity of information in the literature regarding the effect of more moderate hypertension on cerebral vessels. Recent studies have shown that MCA structure is altered in obese Zucker rats; the changes include a reduction in the vessel lumen and outer diameters and a small reduction in wall thickness. This pattern of remodeling is different from the pattern observed here, we observed a marked increase in vessel wall thickness, suggesting some hypertrophy or hyperplasia of the vessel wall is occurring. This also differs from the cerebral vessel remodeling observed in genetically hypertensive rats, which appears to be eutrophic in nature.
We also observed a change in MMP expression and activity in vessels from the obese rats. Although MMP-2 activity was increased, collagen IV levels were unchanged; the reason for the disparity between enzyme activity and substrate level is unclear. MMP-2 plays a role in vascular remodeling caused by a combination of vascular smooth muscle cell migration and extracellular matrix metabolism (Bouvet et al., 2005), and adipokines from white adipose tissue activate MMP-2 (Wu and Smas, 2008). The possibility that adipokines play a role in the changes observed here warrants further investigation. MMP-2 activity is also up regulated in GK rats and this is linked to an increase in the MCA wall/lumen ratio (Harris et al., 2005). In the current studies, the MMP activity was measured in rats that had not undergone a MCAO. Therefore, we cannot draw conclusions about the effects of MMP activity on blood brain barrier function, although the potential that this is altered in the obese rats is an important point to consider.
The expression of active MMP-13, a collagenase, was reduced in cerebral vessels from the obese rats and there was a concomitant increase in the expression of collagen I. This may be responsible for the increased wall stiffness observed in the MCAs from the obese rats. The levels of proMMP-13 were not changed, suggesting there is an increase in the absolute expression of the MMP-13 and no change in the relative activation of the enzyme.
Several variables should be considered when comparing studies of different models of obesity. Glycemic control is an important determinant of vessel structure (Kotsis et al., 2006). Blood pressure may also be a determining factor in how obesity affects the vasculature, and we have shown previously that the age at which the subjects become obese affects how the hypertension develops (Smith et al., 2006; Smith and Dorrance, 2006; Wang et al., 2003). At present it is impossible to know if the remodeling observed in the obese rats is in response to a particular factor induced by obesity such as the elevated blood pressure, oxidative stress or plasma glucose (Smith et al., 2006). Each of these factors could be involved in the changes we observe, but it is just as likely that the entire milieu is required. While blood pressure was not measured in the current study by telemetry, we have previously shown that there is an elevation in the blood pressure in conscious unstressed rats using indwelling catheters (Zhou et al., 2005).
Our studies highlight the importance of investigating the effects of obesity, beginning in childhood, on the adult cardiovascular system. The rats studied were only thirteen weeks old at the time of the induction of cerebral ischemia, yet the changes in the outcome of ischemia and in the vascular structure were marked. In summary, we have shown that obesity, beginning in childhood, changes the structure of the cerebral vasculature. This change in structure appears to exacerbate the damage caused by cerebral ischemia and is related to changes in the activity and expression of the MMP enzymes.
Acknowledgments
This work was supported by the National Institutes for Health Grants HL077384 (AMD), DK074385 and NS054688 (AE). The American Diabetes Association (ADA) (7-07-RA-28; AMD), the ADA Amaranth Diabetes Fund, American Heart Association (0840122N; AMD) and Philip Morris USA Inc and Philip Morris International (AE) also supported this work.
Footnotes
Publisher's Disclaimer: This is a PDF file of an unedited manuscript that has been accepted for publication. As a service to our customers we are providing this early version of the manuscript. The manuscript will undergo copyediting, typesetting, and review of the resulting proof before it is published in its final citable form. Please note that during the production process errors may be discovered which could affect the content, and all legal disclaimers that apply to the journal pertain.
References
- Bagust A, et al. The projected health care burden of Type 2 diabetes in the UK from 2000 to 2060. Diabet Med. 2002;19(Suppl 4):1–5. doi: 10.1046/j.1464-5491.19.s4.2.x. [DOI] [PubMed] [Google Scholar]
- Baumbach GL, Heistad DD. Remodeling of cerebral arterioles in chronic hypertension. Hypertension. 1989;13:968–72. doi: 10.1161/01.hyp.13.6.968. [DOI] [PubMed] [Google Scholar]
- Bouvet C, et al. Different involvement of extracellular matrix components in small and large arteries during chronic NO synthase inhibition. Hypertension. 2005;45:432–7. doi: 10.1161/01.HYP.0000154680.44184.01. [DOI] [PubMed] [Google Scholar]
- Carroll JF, et al. Hypertension, cardiac hypertrophy, and neurohumoral activity in a new animal model of obesity. Am J Physiol. 1996;271:H373–8. doi: 10.1152/ajpheart.1996.271.1.H373. [DOI] [PubMed] [Google Scholar]
- Cipolla MJ, et al. Postischemic attenuation of cerebral artery reactivity is increased in the presence of tissue plasminogen activator. Stroke. 2000;31:940–5. doi: 10.1161/01.str.31.4.940. [DOI] [PubMed] [Google Scholar]
- Coulson RJ, et al. Effects of ischemia and myogenic activity on active and passive mechanical properties of rat cerebral arteries. Am J Physiol Heart Circ Physiol. 2002;283:H2268–75. doi: 10.1152/ajpheart.00542.2002. [DOI] [PubMed] [Google Scholar]
- Coyle P, Jokelainen PT. Differential outcome to middle cerebral artery occlusion in spontaneously hypertensive stroke-prone rats (SHRSP) and Wistar Kyoto (WKY) rats. Stroke. 1983;14:605–11. doi: 10.1161/01.str.14.4.605. [DOI] [PubMed] [Google Scholar]
- Dobrian AD, et al. Development of hypertension in a rat model of diet-induced obesity. Hypertension. 2000;35:1009–15. doi: 10.1161/01.hyp.35.4.1009. [DOI] [PubMed] [Google Scholar]
- Ergul A, et al. Increased hemorrhagic transformation and altered infarct size and localization after experimental stroke in a rat model of type 2 diabetes. BMC Neurology. 2007;7 doi: 10.1186/1471-2377-7-33. [DOI] [PMC free article] [PubMed] [Google Scholar]
- Festa A, et al. Chronic subclinical inflammation as part of the insulin resistance syndrome: the Insulin Resistance Atherosclerosis Study (IRAS) Circulation. 2000;102:42–7. doi: 10.1161/01.cir.102.1.42. [DOI] [PubMed] [Google Scholar]
- Grundy SM, et al. Diabetes and cardiovascular disease: a statement for healthcare professionals from the American Heart Association. Circulation. 1999;100:1134–46. doi: 10.1161/01.cir.100.10.1134. [DOI] [PubMed] [Google Scholar]
- Hall JE. Louis K. Dahl Memorial Lecture. Renal and cardiovascular mechanisms of hypertension in obesity. Hypertension. 1994;23:381–94. doi: 10.1161/01.hyp.23.3.381. [DOI] [PubMed] [Google Scholar]
- Hall JE, et al. Abnormal kidney function as a cause and a consequence of obesity hypertension. Clin Exp Pharmacol Physiol. 1998;25:58–64. doi: 10.1111/j.1440-1681.1998.tb02146.x. [DOI] [PubMed] [Google Scholar]
- Harper SL, et al. Arterial and microvascular contributions to cerebral cortical autoregulation in rats. Am J Physiol. 1984;246:H17–24. doi: 10.1152/ajpheart.1984.246.1.H17. [DOI] [PubMed] [Google Scholar]
- Harris AK, et al. Type 2 diabetes causes remodeling of cerebrovasculature via differential regulation of matrix metalloproteinases and collagen synthesis: role of endothelin-1. Diabetes. 2005;54:2638–44. doi: 10.2337/diabetes.54.9.2638. [DOI] [PubMed] [Google Scholar]
- Hirose H, et al. The obese gene product, leptin: possible role in obesity-related hypertension in adolescents. J Hypertens. 1998;16:2007–12. doi: 10.1097/00004872-199816121-00023. [DOI] [PubMed] [Google Scholar]
- Kernan WN, Inzucchi SE. Type 2 Diabetes Mellitus and Insulin Resistance: Stroke Prevention and Management. Curr Treat Options Neurol. 2004;6:443–450. doi: 10.1007/s11940-004-0002-y. [DOI] [PubMed] [Google Scholar]
- Klein BE, et al. Components of the metabolic syndrome and risk of cardiovascular disease and diabetes in beaver dam. Diabetes Care. 2002;25:1790–4. doi: 10.2337/diacare.25.10.1790. [DOI] [PubMed] [Google Scholar]
- Kopelman PG, et al. Impaired growth hormone response to growth hormone releasing factor and insulin-hypoglycaemia in obesity. Clin Endocrinol (Oxf) 1985;23:87–94. doi: 10.1111/j.1365-2265.1985.tb00187.x. [DOI] [PubMed] [Google Scholar]
- Kotsis VT, et al. Impact of obesity in intima media thickness of carotid arteries. Obesity (Silver Spring) 2006;14:1708–15. doi: 10.1038/oby.2006.196. [DOI] [PubMed] [Google Scholar]
- Kvaavik E, et al. Predictors and tracking of body mass index from adolescence into adulthood: follow-up of 18 to 20 years in the Oslo Youth Study. Arch Pediatr Adolesc Med. 2003;157:1212–8. doi: 10.1001/archpedi.157.12.1212. [DOI] [PubMed] [Google Scholar]
- Levin BE, et al. Relationship between sympathetic activity and diet-induced obesity in two rat strains. Am J Physiol. 1983;245:R364–71. doi: 10.1152/ajpregu.1983.245.3.R364. [DOI] [PubMed] [Google Scholar]
- Mayanagi K, et al. Acute treatment with rosuvastatin protects insulin resistant (C57BL/6J ob/ob) mice against transient cerebral ischemia. J Cereb Blood Flow Metab. 2008;28:1927–1935. doi: 10.1038/jcbfm.2008.81. [DOI] [PMC free article] [PubMed] [Google Scholar]
- Mokdad AH, et al. Prevalence of obesity, diabetes, and obesity-related health risk factors, 2001. Jama. 2003;289:76–9. doi: 10.1001/jama.289.1.76. [DOI] [PubMed] [Google Scholar]
- Osmond JM, et al. Obesity increases blood pressure, cerebral vascular remodeling, and severity of stroke in the Zucker rat. Hypertension. 2009;53:381–6. doi: 10.1161/HYPERTENSIONAHA.108.124149. [DOI] [PMC free article] [PubMed] [Google Scholar]
- Reaven GM. Banting lecture 1988, Role of insulin resistance in human disease. Diabetes. 1988;37:1595–607. doi: 10.2337/diab.37.12.1595. [DOI] [PubMed] [Google Scholar]
- Rigsby CS, et al. Intact Female Stroke-Prone Hypertensive Rats Lack Responsiveness to Mineralocorticoid Receptor Antagonists. Am J Physiol Regul Integr Comp Physiol. 2007a doi: 10.1152/ajpregu.00145.2007. [DOI] [PMC free article] [PubMed] [Google Scholar]
- Rigsby CS, et al. Spironolactone improves structure and increases tone in the cerebral vasculature of male spontaneously hypertensive stroke-prone rats. Microvasc Res. 2007b;73:198–205. doi: 10.1016/j.mvr.2006.12.001. [DOI] [PMC free article] [PubMed] [Google Scholar]
- Rocchini AP. Childhood obesity and a diabetes epidemic. N Engl J Med. 2002;346:854–5. doi: 10.1056/NEJM200203143461112. [DOI] [PubMed] [Google Scholar]
- Rosamond W, et al. Heart disease and stroke statistics--2008 update: a report from the American Heart Association Statistics Committee and Stroke Statistics Subcommittee. Circulation. 2008;117:e25–146. doi: 10.1161/CIRCULATIONAHA.107.187998. [DOI] [PubMed] [Google Scholar]
- Smith AD, et al. Obesity-induced hypertension develops in young rats independently of the renin-angiotensin-aldosterone system. Exp Biol Med (Maywood) 2006;231:282–7. doi: 10.1177/153537020623100307. [DOI] [PubMed] [Google Scholar]
- Smith AD, Dorrance AM. Arachidonic acid induces augmented vasoconstriction via cyclooxygenase 1 in the aorta from rats fed a high-fat diet. Prostaglandins Leukot Essent Fatty Acids. 2006;75:43–9. doi: 10.1016/j.plefa.2006.03.008. [DOI] [PubMed] [Google Scholar]
- Swanson RA, et al. A semiautomated method for measuring brain infarct volume. J Cereb Blood Flow Metab. 1990;10:290–3. doi: 10.1038/jcbfm.1990.47. [DOI] [PubMed] [Google Scholar]
- Van Gaal LF, et al. Human obesity: from lipid abnormalities to lipid oxidation. Int J Obes Relat Metab Disord. 1995;19(Suppl 3):S21–6. [PubMed] [Google Scholar]
- Wang MH, et al. Downregulation of renal CYP-derived eicosanoid synthesis in rats with diet-induced hypertension. Hypertension. 2003;42:594–9. doi: 10.1161/01.HYP.0000090123.55365.BA. [DOI] [PubMed] [Google Scholar]
- Whitaker RC, et al. Predicting obesity in young adulthood from childhood and parental obesity. N Engl J Med. 1997;337:869–73. doi: 10.1056/NEJM199709253371301. [DOI] [PubMed] [Google Scholar]
- Wu Y, Smas CM. Wdnm1-like, a New Adipokine with a Role in MMP-2 Activation. Am J Physiol Endocrinol Metab. 2008 doi: 10.1152/ajpendo.90316.2008. [DOI] [PMC free article] [PubMed] [Google Scholar]
- Zhou Y, et al. Gender differences of renal CYP-derived eicosanoid synthesis in rats fed a high-fat diet. Am J Hypertens. 2005;18:530–7. doi: 10.1016/j.amjhyper.2004.10.033. [DOI] [PubMed] [Google Scholar]


