

Abstract
The acute phases of human immunodeficiency virus (HIV) and simian immunodeficiency virus (SIV) infection are characterized by rapid and profound depletion of CD4+ T cells from the guts of infected individuals. The large number of CD4+ T cells in the gut (a large fraction of which are activated and express the HIV/SIV coreceptor CCR5), the high level of infection of these cells, and the temporal coincidence of this CD4+ T-cell depletion with the peak of virus in plasma in acute infection suggest that the intestinal mucosa may be the major source of virus driving the peak viral load. Here, we used data on CD4+ T-cell proportions in the lamina propria of the rectums of SIV-infected rhesus macaques (which progress to AIDS) and sooty mangabeys (which do not progress) to show that in both species, the depletion of CD4+ T cells from this mucosal site and its maximum loss rate are often observed several days before the peak in viral load, with few CD4+ T cells remaining in the rectum by the time of peak viral load. In contrast, the maximum loss rate of CD4+ T cells from bronchoalveolar lavage specimens and lymph nodes coincides with the peak in virus. Analysis of the kinetics of depletion suggests that, in both rhesus macaques and sooty mangabeys, CD4+ T cells in the intestinal mucosa are a highly susceptible population for infection but not a major source of plasma virus in acute SIV infection.
The acute phase of human immunodeficiency virus (HIV) infection is characterized by moderate CD4+ T-cell depletion in blood, followed by a transient partial restoration of CD4+ T-cell numbers and eventually by a slow long-term CD4+ T-cell decline in the chronic phase that lasts for several years. Studies of CD4+ T-cell depletion in mucosal sites, often conducted with simian immunodeficiency virus (SIV)-infected macaques, have demonstrated that mucosal CD4+ T-cell depletion is more rapid and profound (3, 10, 13, 19, 21). The severe depletion of cells in the gut in early infection is thought to be driven in part by the phenotype of the cells present, which are predominantly CCR5+ and in general more activated than their circulating counterparts. As such, these mucosal CD4+ T cells are highly susceptible to productive infection with the dominant CCR5-tropic strains of HIV and SIV present in early infection (20). The rapid depletion of CD4+ T cells at mucosal sites is accompanied by relatively high numbers of infected cells (10, 13) and is temporally associated with the peak viral load in plasma, suggesting that the infection of mucosal CD4+ T cells may be responsible for the majority of virus replication occurring during acute infection (10, 15, 21, 22).
The size of the CD4+ T-cell pool in the gut is a matter of some controversy, with estimates ranging from ∼5 to 50% of the total body pool of these cells (reviewed in reference 5). Regardless of the precise numbers, the gut (and particularly the mucosal lamina propria) contains a significant proportion of the body CD4+ CCR5+ memory T cells, which are depleted very early in infection. However, whether CD4+ T cells in the gut are merely a target of early infection or whether they are a major driver of early viral growth and peak viral loads in acute infection is unclear. Here we use a combination of experimental data and modeling to demonstrate that the gut is unlikely to be a major source of virus production in acute SIV infection.
MATERIALS AND METHODS
Experimental data.
The data and experimental protocols for analysis of viral and CD4+ T-cell levels refer to 15 SIVmac239-infected rhesus macaques and five SIVsmm-infected sooty mangabeys and have been published previously (7) or are in the course of publication (4a). Briefly, the SIVmac239 studies involved 15 MaMu-A*01-positive Indian rhesus macaques. Two groups of five animals were vaccinated with modified vaccinia virus Ankara vectors bearing SIV Gag and Tat antigens, and one group of five was left uninfected. All 15 animals were challenged with 10,000 50% tissue culture infective doses of SIVmac239. The five sooty mangabeys were infected using 1 ml of plasma passaged from another experimentally infected animal. Viral levels in plasma were measured using reverse transcription-PCR as described previously (6), and the proportions of CD4+ T cells in the various tissues examined (peripheral blood [PB], lymph nodes [LNs], bronchoalveolar lavage [BAL] specimens, and rectal biopsy [RB] specimens) were measured by flow cytometry as previously described (7).
Analysis of peak viral and CD4+ T-cell depletion.
The percentage of residual CD4+ T cells at each studied time point post-SIV infection was calculated as a proportion of the uninfected value (taken 4 weeks prior to infection). The rate of CD4+ T-cell loss was calculated from the linear slope between adjacent data points and can be considered an average over the interval between the data points. The midpoint time of the maximum loss rate interval was then used to compare to the time of peak viral load. The day of peak viral load was taken to be the time of the highest viral load or, in cases where two subsequent viral loads differed by <2-fold, the average of the times of the two highest measurements was used.
The difference between the time of peak viral load and the time of the fastest CD4+ T-cell loss for all animals was assessed for significance with a Wilcoxon signed rank test using Prism (ver. 5.01; GraphPad Software). This test was also used to compare CD4+ T-cell levels from RB specimens with those from BAL specimens.
Modeling of CD4+ T-cell kinetics.
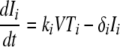
The interaction between the viral load and CD4+ T-cell kinetics was modeled using a simplified version of a previously published differential equation model for HIV and SIV (14) adapted to consider different compartments of susceptible cells:
 |
(1) |
 |
(2) |
 |
(3) |
where Ti and Ii are the numbers of target and infected cells in the ith compartment, respectively; ki is the infectivity; δi is the death rate of infected CD4+ T cells; and pi is the production rate of virus from infected cells in that compartment. The clearance rate of free virus (V) is c. This simplified model assumes that the production rate and the natural death rate of uninfected cells are negligible over the course of acute infection. We modified this basic model of infection to include three separate “compartments” of infected cells. These compartments could differ in various ways, including in size, in death rate (δi), in infectivity (ki), and in viral production (pi).
For the purpose of this model, the cell numbers needed to be in the same proportion as the total numbers in the respective compartments. We chose the representative numbers so that the sizes of the compartments were roughly 10-fold different. Thus, T was initially 900, 90, and 9 cells in compartments 1 to 3, respectively.
The equations were solved using the ode45 function in Matlab (ver. 7.4; Mathworks). The observed total CD4+ T-cell numbers contained both uninfected and infected CD4+ T cells (since infected cells still express CD4). From the model, combining equation 1 and equation 2, we find that the observed loss rate of total CD4+ T cells,
 |
(4) |
is proportional to the number of infected cells in the compartment. Thus, the maximum observed CD4+ loss rate will coincide with the peak of infected cells and the peak virus production in the compartment.
RESULTS
Dynamics of CD4+ T-cell depletion in RB specimens during acute SIVmac239 infection.
In order to study the dynamics of the viral load and CD4+ T-cell depletion in the gut, we obtained sequential plasma and tissue samples from the rectums of rhesus macaques infected with SIVmac239. Of note, the examined samples contained for the most part CD4+ T cells residing in the intestinal lamina propria, an immune effector mucosal site, and did not provide a representative sampling of the immune inductive mucosal sites (i.e., Peyer patches and isolated lymphoid follicles). Consistent with previous studies, we observed a rapid depletion of CD4+ T cells in the rectal mucosa during acute infection (Fig. 1a). We then examined the dynamics of CD4+ T-cell depletion compared to the viral load. Surprisingly, we observed that in a significant proportion of animals, CD4+ T cells were severely depleted from the gut several days before the peak viral load (Fig. 1b). As expected in a group of outbred animals, the exact timing of CD4+ T-cell depletion and peak viral loads varied between individual SIV-infected macaques. Although 8 of the 15 animals showed a clearly defined peak in the viral load at day 10, others animals showed a slightly broader peak and could show a peak as late as day 14. Therefore, we aligned the peak viral load in each animal, and observed the level of CD4+ T-cell depletion in the rectum at different sampling times leading up to the peak viral load (Fig. 1b). In 8 of the 15 animals, CD4+ T cells were depleted to 0.3 to 31% of preinfection levels 2 to 5 days prior to the peak viral load.
FIG. 1.

Plasma viral load and CD4+ T-cell kinetics in rhesus macaques. (a) The plasma viral load (black) and percent CD4+ T cells were measured in PB, LNs, rectum, and BAL specimens for an individual animal. The peak viral load (indicated by the dashed vertical line) varied between individual animals. The kinetics of CD4+ T-cell depletion in the rectum (b) BAL specimens (c) LNs (d), and PB (e) are shown relative to the time of the peak viral load in each animal. This reveals that depletion in the rectum often significantly precedes the peak in the viral load. Animals that deplete early in the rectum (indicated in red) do not necessarily deplete early in other sites. Note that BAL specimen CD4+ kinetics for animal RNr8 was not included, as baseline levels were not available.
The clearance rate of free virus in HIV and SIV is extremely high (16), and thus, the viral load levels provide a good estimate of the viral production rate around the time of measurement, and also the number of productively infected cells. If gut CD4+ T cells were a major source of virus, one would conclude that the relatively small fraction of gut CD4+ T cells remaining at the time of the peak viral load was sufficient to cause this high level of virus replication. However, the daily loss rate of CD4+ T cells in the gut prior to the peak viral load in some cases exceeded the total number of cells remaining at the peak. Thus, more cells died each day (presumably as a result of infection) than were even available for infection by the time of the peak viral load. Moreover, since the viral loads at the time of rapid loss of CD4+ T cells in the gut were often >10-fold lower than the peak viral loads, this would require that the minority population of CD4+ T cells remaining in the gut at the peak viral load were all infected and produced many more virions on a per cell basis than infected CD4+ T cells earlier in infection. Since the level of CD4+ T cells in the rectum did not change between the viral peak and day 28 after infection (Fig. 2), it seems extremely unlikely that all of these cells could have been infected at the peak.
FIG. 2.

CD4+ T-cell depletion in RB and BAL specimens. The rectum (RB) shows significantly higher levels of CD4+ T-cell depletion than the BAL specimens at the time of peak viral load (a) (P = 0.0001). However, by 28 days postinfection, the depletions are similar in both compartments (b) (P = 1.0).
Dynamics of CD4+ T-cell depletion in other compartments during acute SIVmac239 infection.
Data on the kinetics of CD4+ T-cell depletion during acute SIVmac239 infection were also available from BAL, LN biopsy, and PB samples obtained from the same macaques. CD4+ T-cell depletion in PB and LN did not reach the same high levels seen in RB specimens (likely due to their enrichment in naïve CD4+ T cells, which are more resistant to infection), and thus it was not possible to directly compare depletion levels across all compartments. CD4+ T-cell depletion in RB specimens over the course of acute infection was similar to that seen in BAL specimens compared at day 28 (median, 5.4% versus 9.5%, respectively) (Fig. 2). However, when depletion rates at the time of the peak viral load were compared, the rectum showed significantly higher depletion than the BAL specimens (median, 11.9% versus 62.7%, respectively; P = 0.0001; Wilcoxon matched pairs), indicating that early depletion was limited to the gut, despite similar long-term depletion levels in both RB specimens and BAL specimens.
In order to compare the timing of CD4+ T-cell loss between anatomic compartments in which the overall levels of depletion differed greatly, we first determined the time at which the maximal depletion rate was observed. The loss rate of CD4+ T cells was calculated from the available CD4+ T-cell data at different times, allowing us to estimate the loss rate over the interval between any data points. The rate is assumed to be constant over this interval; however, it is possible that there is either an early or late depletion within this interval and that the interval merely serves as the range of possible times when this could occur. Consistent with the observed severe CD4+ T-cell depletion prior to the peak viral load, we observed that the peak rates of CD4+ T-cell loss in the rectum preceded the peak viral load in 9 out of the 15 animals (Fig. 3). By comparing the midpoint of the time interval in which the peak CD4+ T-cell loss rate occurred to the time of peak virus (Fig. 4), we found that the peak CD4+ T-cell depletion rate in the gut occurred significantly before the peak viral load (P < 0.001; Wilcoxon). In contrast, the time of the maximum rate of loss in PB, LN, and BAL specimens was not significantly different from the time of the peak plasma viral load (P > 0.50 for LN, BAL specimens, and PB).
FIG. 3.

The timing of peak CD4+ T-cell depletion rates in RB (a), BAL (b), PB (c), and LN (d) specimens relative to the time of peak viral load in rhesus macaques. The animals are aligned according to the time of the peak viral load, and the relative times of the peak CD4+ T-cell depletion rate are indicated for samples from different tissues. The time period in which the peak loss of CD4+ T cells (i.e., maximum percent per day) occurred is indicated as a horizontal bar.
FIG. 4.

CD4+ T-cell depletion occurs significantly earlier in the rectum. The time of peak CD4+ T-cell depletion relative to the peak viral load is indicated in different tissues for rhesus macaques (a) and sooty mangabeys (b). The time of peak depletion is taken as the midpoint of the interval in which the maximum depletion was observed. Each point represents an individual animal. The gray bars indicate the median differences. Peak depletion in RB samples from rhesus macaques occurred significantly before the peak viral load (P < 0.001; Wilcoxon). However, in other compartments, the time of peak depletion was not significantly different from the timing of the peak viral load.
Dynamics of CD4+ T-cell depletion during acute SIV infection of sooty mangabeys.
The observed disconnect between the timing of gut CD4+ T-cell depletion and the peak viral loads in SIVmac239 infection of rhesus macaques may reflect physiological factors specific to the host or viral factors specific to this strain of SIV. In order to investigate whether early depletion was seen in other models of HIV infection, we chose to study intestinal CD4+ T-cell depletion in a “natural-host” model of SIV infection in sooty mangabeys (18). These animals do not suffer from severe CD4+ T-cell depletion in the PB and do not progress to AIDS but still experience profound CD4+ T-cell depletion in mucosal sites in acute SIV infection (7). This model thus provides a different host and disease outcome to compare with SIVmac239. Figure 5 illustrates the timing of the maximum CD4+ T-cell loss rate and the viral-load peak in five experimentally infected sooty mangabeys. Consistent with our observations in rhesus macaques, the majority of these animals again showed that CD4+ T-cell depletion in the gut preceded the viral peak, while the timing coincided with the viral peak in other compartments. When we compared the timing of the highest CD4+ T-cell loss rate for these animals with the timing of the peak viral load in plasma, we saw a strong trend (P ≈ 0.055) toward earlier depletion in the gut, before the peak viral level (Fig. 4b and 6), whereas differences in other compartments were not significant (BAL specimens, P ≈ 0.409; LN, P ≈ 0.099; PB, P ≈ 0.581).
FIG. 5.

Plasma viral load and CD4+ T-cell kinetics in sooty mangabeys. (a) The plasma viral load (black) and the percent CD4+ T cells were measured in PB, LNs, rectum, and BAL specimens for an individual animal. The peak viral loads (indicated by the dashed vertical line) varied between individual animals. The kinetics of CD4+ T-cell depletion in the rectum (b), BAL specimens (c), LN (d), and PB (e) are shown relative to the time of the peak viral load in each animal. The animals were aligned according to the timing of the peak viral load in order to observe the timing of depletion in different anatomical compartments.
FIG. 6.

Difference between the time of the peak CD4+ T-cell depletion rate and the peak viral load in RB (a), BAL (b), PB (c), and LN (d) specimens from sooty mangabeys. The times of peak CD4+ T-cell depletion (indicated as horizontal bars) and peak viral load (indicated as a vertical line) are shown in different compartments for SIV-infected sooty mangabeys. The peak rate of CD4+ T-cell depletion (taken as the midpoint of the time interval) in the rectum occurred before the peak viral load in all animals (although this is not significant due to the small number of animals studied). The depletion in other compartments occurred closer to the peak viral load.
Modeling susceptibility versus production of virus in acute infection.
In order to understand the dynamics of CD4+ T-cell depletion in different physiological compartments in acute SIV, we adapted the standard mathematical model of HIV infection (9, 14) to consider infection in different “compartments” that differed in “size” and “susceptibility to infection” (Fig. 7). When all compartments had equal susceptibilities to infection, all were infected and depleted synchronously (and coincident with the peak viral load) (Fig. 7a). However, different dynamics were observed when the compartments differed in their susceptibilities to infection. When the largest compartment was the most susceptible, infection in the compartment effectively drove the peak in the viral load, and thus the rapid CD4+ T-cell depletion occurred at the same time in the other compartments. Thus, all compartments were depleted synchronously and coincidentally with the peak viral load (Fig. 7b). However, when the largest compartment was the least susceptible to infection, it was the last to be depleted. Regardless of the susceptibility of the largest compartment, the peak in infection here was always coincident with the peak viral load (since it provided the major source of virus during infection). The smaller compartments were infected at earlier times depending on their susceptibility to infection but had little impact on the peak viral load. In cases where the minor compartments were more susceptible to infection than the largest compartment, they were profoundly depleted prior to the peak viral load. Thus, the timing of the depletion of minor compartments could be dissociated from that of major compartments, depending on the susceptibility and dynamics of infection.
FIG. 7.

Modeling the peak viral load and CD4+ T-cell depletion in compartments of different sizes or with different virus production rates. The dashed black lines represent viral loads; the colored lines are total observed (uninfected and infected; T + I) CD4+ T-cell numbers. The circles mark the fastest CD4+ T-cell depletion in each compartment. We first modeled infection in compartments differing in size and either susceptibility to infection or death rate (using equations 1 to 3). Before infection, the largest (red) compartment contained 900 cells, the medium-size compartment (blue) had 90 cells, and the smallest compartment (green) had 9 cells. (a) When all three compartments have same susceptibility to infection (kL = kM = kS = 5 × 10⁻⁸ ml/copy/day), they are depleted synchronously. (b) If the largest compartment has the highest susceptibility (kL = 10−7 ml/copy/day = 10kM = 100kS), then it is infected rapidly, driving the peak viral load. In the less susceptible compartments, maximum depletion occurs around the peak viral load, and thus depletion occurs almost synchronously in all compartments. (c) If the largest compartment has the lowest susceptibility (kL = 10−8 ml/copy/day = 0.1kM = 0.01kS), then the smaller compartments are depleted first, but the peak viral load is not reached until the large compartment is infected. In panels a to c, the other parameters are as follows: δ = 1/day, p = 106 copies/cell/day, and c = 20/day. (d) Early depletion cannot be driven by high death rates. If the compartments have the same susceptibility to infection but the death rates of infected cells vary, this has relatively little effect on driving early depletion. All compartments are infected synchronously (as in panel a), and differences in death rates do not affect the timing of depletion greatly. The largest compartment has the highest death rate of infected cells (δL = 2/day, δM = 1/day, and δS = 0.5/day). The other parameters are as follows: k = 10−7 ml/copy/day, p = 5 × 10⁵ copies/cell/day, and c = 20/day. Early depletion can also be seen if all compartments are the same size (333 cells) but differ in susceptibility to infection and the rate at which infected cells produce virus. (e) If compartments differ only in susceptibilities, with the first (red) compartment the least susceptible (k1 = 10−8 ml/copy/day = 0.1k2 = 0.01k3), but with the same viral production in each compartment (p = 5 × 10⁵ copies/cell/day), then they differ in the timing of depletion, but with the most susceptible compartment still depleting around the peak of virus (not before it). (f) If compartments differ in virus production rates, as well as susceptibilities, then the highest-producing compartment (red) (producing a p1 of 10 copies/cell/day, which is 10-fold more than the medium-producing [blue] and 100-fold more than the low-producing [green] compartment) drives the peak viral load. If the highest-producing, red, compartment is the least susceptible, then the other compartments are depleted earlier. Thus, low production and small compartment size in the gut are both compatible with the observed kinetics in vivo. The other parameters are as follows: δ = 1/day, and c = 20/day.
Another factor that could drive the earlier depletion in the gut would be if infected cells in the gut had a higher death rate than infected cells elsewhere. However, as shown in Fig. 7d, even a twofold difference in infected-cell death rates between compartments had relatively little impact on the timing of depletion between compartments if they had the same susceptibility to infection.
The rapid depletion of cells in the gut is best explained by an increased susceptibility to infection. However, the conclusion that the gut is not a major source of virus does not require that there must be overall fewer CD4+ T cells in the gut, as it is also possible that infected cells in the gut simply produced less virus. Figure 7e illustrates the predicted outcome of infection with three compartments of the same size that differed in susceptibility to infection. In this case, all of the compartments contributed to the peak viral load, and all were depleted after the peak. However, if the compartments differed in both susceptibility to infection and viral production per infected cell (Fig. 7f), then we observed essentially the same behavior as seen with compartments of different sizes (compare Fig. 7c and f). Thus, both scenarios suggest the gut must be more susceptible to infection than the other tissues in order to be depleted first. However, failure to contribute to the peak viral load may arise either because of a small number of susceptible cells in the gut or because gut CD4+ T cells produce less virus per infected cell than other tissues. We note that the latter explanation would also be compatible with a high level of “bystander death” of uninfected CD4+ T cells in the gut during acute SIV infection, as suggested by Li et al. (10).
The experimental studies demonstrated directly that the peak rate of depletion of CD4+ T cells in the gut occurs significantly before the peak in the viral load. From analysis of the modeling, we have shown that the timing of the maximum CD4+ loss rate is a direct indicator of the peak of infected cells in a chosen compartment (equation 4). Because of the extremely high clearance rate of the free virus, the peak of infected cells nearly coincides with the peak production of virus in the compartment (Fig. 8).
FIG. 8.

The peak depletion rate of CD4+ T cells coincides with the peak production of virus in the compartment. Shown is modeling of CD4+ T-cell depletion using the same parameters as in Fig. 7c but showing viral production from each compartment. The solid lines represent CD4+ T cells in each compartment, with circles at the maximum rates of loss of CD4+ T cells. The dotted lines represent the contributions of each compartment to the total viral load.
The maximum CD4+ loss rate in the gut precedes the peak viral load by several days both in rhesus macaques and in sooty mangabeys (Fig. 4). This means that virus production by infected cells in the gut peaks approximately 4 days before the peak in the viral load and that it becomes negligible compared to the contributions of the other compartments at the peak of acute infection.
DISCUSSION
The intestinal mucosa is an anatomic compartment that plays a major role in the interaction between primate lentiviruses and the host immune system. This is due to several factors, including the presence of both high levels of activated CD4+ CCR5+ T cells that are preferential targets for HIV/SIV and strong antiviral cellular immune responses (8). In the current study, we have observed that CD4+ T cells in RB specimens are often depleted several days before the peak in the plasma viral load occurs. Since the time of maximum death of rectal CD4+ T cell occurs before the peak of virus in the blood, the rapid death of these CD4+ T cells cannot be connected with the peak of virus replication during acute SIV infection. We used a modeling approach to analyze how the sizes and susceptibilities to infection of different anatomical compartments affect the timing and extent of CD4+ T-cell depletion relative to the peak viral loads. This analysis suggests that the maximum loss rate of CD4+ T cells in the largest compartment will always coincide with the peak viral load. Other compartments may be depleted before the peak viral load if they are more susceptible to infection than the major compartment. If a compartment is observed to deplete separately from the peak, it cannot be the driver of the peak viral load. However, just because a compartment is depleted at the same time as the peak viral load does not indicate that it drives the peak—it may just have similar susceptibility to infection. The scenario most similar to the experimental data is that seen in Fig. 7c. There, a small compartment of highly susceptible cells (in the rectum) is depleted early. A compartment with intermediate susceptibility is also partially depleted at this time and goes on to similar levels of peak depletion (as seen in the BAL specimens [Fig. 2]). A similar scenario is seen if the production rate of virus per infected cell, rather than the number of cells, is what differentiates compartments (Fig. 7f). Thus, it is possible that the number of cells in the gut is large but that they do not produce much virus per infected cell. Regardless of the mechanisms, the timing of depletion of CD4+ T cells in the rectal mucosa indicates that this cannot be the major source of virus, and it is likely just a very susceptible population of cells that is rapidly targeted and depleted. However, the coincidence of CD4+ T-cell depletion in LNs, BAL specimens, and PB with peak plasma viremia does not guarantee that one or all of these is driving peak viremia. They may just have susceptibilities to infection similar to that of the major compartment(s).
The results of this study appear at first to directly contradict a number of earlier studies. One major difference between this study and previous ones is the serial biopsies of individual animals. In earlier studies, only a necropsy sample or one biopsy sample plus a necropsy sample were obtained during early infection (10, 13). These were staggered at various stages in early infection, so that the “average viral peak” and “average depletion” were obtained by combining data from different animals. Thus, these studies correctly concluded that the viral peak and CD4 depletion occurred around the same time, but they lacked the resolution to distinguish a difference of 4 to 5 days in this timing.
Our study analyzed RB samples as a representative region of the gut. We note that previous studies have not described any major differences between the upper and lower gastrointestinal tract (10, 13). However, we cannot exclude the possibility that the dynamics may vary at different sites. Similarly, we have analyzed the dynamics of total CD4+ T cells in the gut. Thus, we cannot exclude the possibility of “special cells” that are a very small minority population of CD4+ T cells in the gut but somehow produce all of the virus. However, we note that there is no more reason to suspect that “special cells” exist in the gut than in any other site. Finally, our conclusion that the dynamics of CD4+ T-cell loss in the gut are inconsistent with it being a major source of virus does not exclude a role for the gut in indirectly causing high viral production elsewhere; HIV infection and CD4+ T-cell loss in the gut have been associated with the influx of microbial products into the systemic circulation (2, 11). These microbial products may play a role in activating T cells in other sites, leading to increased susceptibility to infection and increased viral production elsewhere. It is possible that the peak in the viral load immediately following T-cell depletion in the gut is a consequence of this activation in other sites.
The rapid early depletion of CD4+ T cells from the gut has suggested an important role of this anatomic compartment in the pathogenesis of HIV infection. Our results suggest that these features may be explained by an increased susceptibility of gut cells to infection but that the gut does not provide a major source of virus (at least during acute infection). Thus, the gut is a “passenger” and not a “driver” in the dramatic interaction between HIV/SIV and the host immune system that takes place during acute infection. The peak viral load in acute infection is a major determinant of the extent of CD4+ T-cell depletion in simian/human immunodeficiency virus and SIV infection, and the extent of depletion can be reduced by vaccines that effectively control the peak viral load (1, 4, 12, 17, 23). Identifying which tissues are the major drivers of the peak viral load provides an opportunity for interventions aimed at reducing infection and/or immune activation at these sites. The approach of comparing the timing of infection and depletion of CD4+ T cells in different tissues is one way of identifying the major source of virus during infection and identifying potential anatomical sites for immune control.
Acknowledgments
We thank Meritxel Genesca for helpful discussions on the role of lipopolysaccharide in SIV infection.
This work is supported by the James S. McDonnell Foundation 21st Century Research Award/Studying Complex Systems, the National Health and Medical Research Council (Australia), and the NIH (grant R01-AI66998 P51-RR00165, U19 AI074078, and U19 AI76174 to G.S.). M.P.D. is supported by a Sylvia and Charles Viertel Charitable Foundation Senior Medical Research Fellowship.
Footnotes
Published ahead of print on 20 May 2009.
REFERENCES
- 1.Barouch, D. H., S. Santra, J. E. Schmitz, M. J. Kuroda, T. M. Fu, W. Wagner, M. Bilska, A. Craiu, X. X. Zheng, G. R. Krivulka, K. Beaudry, M. A. Lifton, C. E. Nickerson, W. L. Trigona, K. Punt, D. C. Freed, L. M. Guan, S. Dubey, D. Casimiro, A. Simon, M. E. Davies, M. Chastain, T. B. Strom, R. S. Gelman, D. C. Montefiori, et al. 2000. Control of viremia and prevention of clinical AIDS in rhesus monkeys by cytokine-augmented DNA vaccination. Science 290486-492. [DOI] [PubMed] [Google Scholar]
- 2.Brenchley, J. M., D. A. Price, T. W. Schacker, T. E. Asher, G. Silvestri, S. Rao, Z. Kazzaz, E. Bornstein, O. Lambotte, D. Altmann, B. R. Blazar, B. Rodriguez, L. Teixeira-Johnson, A. Landay, J. N. Martin, F. M. Hecht, L. J. Picker, M. M. Lederman, S. G. Deeks, and D. C. Douek. 2006. Microbial translocation is a cause of systemic immune activation in chronic HIV infection. Nat. Med. 121365-1371. [DOI] [PubMed] [Google Scholar]
- 3.Brenchley, J. M., T. W. Schacker, L. E. Ruff, D. A. Price, J. H. Taylor, G. J. Beilman, P. L. Nguyen, A. Khoruts, M. Larson, A. T. Haase, and D. C. Douek. 2004. CD4+ T cell depletion during all stages of HIV disease occurs predominantly in the gastrointestinal tract. J. Exp. Med. 200749-759. [DOI] [PMC free article] [PubMed] [Google Scholar]
- 4.Davenport, M. P., L. Zhang, J. W. Shiver, D. R. Casmiro, R. M. Ribeiro, and A. S. Perelson. 2006. Influence of peak viral load on the extent of CD4+ T-cell depletion in simian HIV infection. J. Acquir. Immune Defic. Syndr. 41259-265. [DOI] [PubMed] [Google Scholar]
- 4a.Engram, J. C., R. M. Dunham, G. Makedonas, T. H. Vanderford, B. Sumpter, N. R. Klatt, S. J. Ratcliffe, S. Garg, M. Paiardini, M. McQuoid, J. D. Altman, S. I. Staprans, M. R. Betts, D. A. Garber, M. B. Feinberg, and G. Silvestri. Vaccine-induced, SIV-specific CD8+ T-cells reduce virus replication but do not protect from SIV disease progression. J. Immunol., in press. [DOI] [PubMed]
- 5.Ganusov, V. V., and R. J. De Boer. 2007. Do most lymphocytes in humans really reside in the gut? Trends Immunol. 28514-518. [DOI] [PubMed] [Google Scholar]
- 6.Garber, D. A., G. Silvestri, A. P. Barry, A. Fedanov, N. Kozyr, H. McClure, D. C. Montefiori, C. P. Larsen, J. D. Altman, S. I. Staprans, and M. B. Feinberg. 2004. Blockade of T cell costimulation reveals interrelated actions of CD4+ and CD8+ T cells in control of SIV replication. J. Clin. Investig. 113836-845. [DOI] [PMC free article] [PubMed] [Google Scholar]
- 7.Gordon, S. N., N. R. Klatt, S. E. Bosinger, J. M. Brenchley, J. M. Milush, J. C. Engram, R. M. Dunham, M. Paiardini, S. Klucking, A. Danesh, E. A. Strobert, C. Apetrei, I. V. Pandrea, D. Kelvin, D. C. Douek, S. I. Staprans, D. L. Sodora, and G. Silvestri. 2007. Severe depletion of mucosal CD4+ T cells in AIDS-free simian immunodeficiency virus-infected sooty mangabeys. J. Immunol. 1793026-3034. [DOI] [PMC free article] [PubMed] [Google Scholar]
- 8.Haase, A. T. 2005. Perils at mucosal front lines for HIV and SIV and their hosts. Nat. Rev. Immunol. 5783-792. [DOI] [PubMed] [Google Scholar]
- 9.Ho, D. D., A. U. Neumann, A. S. Perelson, W. Chen, J. M. Leonard, and M. Markowitz. 1995. Rapid turnover of plasma virions and CD4 lymphocytes in HIV-1 infection. Nature 373123-126. [DOI] [PubMed] [Google Scholar]
- 10.Li, Q., L. Duan, J. D. Estes, Z. M. Ma, T. Rourke, Y. Wang, C. Reilly, J. Carlis, C. J. Miller, and A. T. Haase. 2005. Peak SIV replication in resting memory CD4+ T cells depletes gut lamina propria CD4+ T cells. Nature 4341148-1152. [DOI] [PubMed] [Google Scholar]
- 11.Li, Q., J. D. Estes, L. Duan, J. Jessurun, S. Pambuccian, C. Forster, S. Wietgrefe, M. Zupancic, T. Schacker, C. Reilly, J. V. Carlis, and A. T. Haase. 2008. Simian immunodeficiency virus-induced intestinal cell apoptosis is the underlying mechanism of the regenerative enteropathy of early infection. J. Infect. Dis. 197420-429. [DOI] [PubMed] [Google Scholar]
- 12.Mattapallil, J. J., D. C. Douek, A. Buckler-White, D. Montefiori, N. L. Letvin, G. J. Nabel, and M. Roederer. 2006. Vaccination preserves CD4 memory T cells during acute simian immunodeficiency virus challenge. J. Exp. Med. 2031533-1541. [DOI] [PMC free article] [PubMed] [Google Scholar]
- 13.Mattapallil, J. J., D. C. Douek, B. Hill, Y. Nishimura, M. Martin, and M. Roederer. 2005. Massive infection and loss of memory CD4+ T cells in multiple tissues during acute SIV infection. Nature 4341093-1097. [DOI] [PubMed] [Google Scholar]
- 14.Perelson, A. S. 2002. Modelling viral and immune system dynamics. Nat. Rev. Immunol. 228-36. [DOI] [PubMed] [Google Scholar]
- 15.Picker, L. J. 2006. Immunopathogenesis of acute AIDS virus infection. Curr. Opin. Immunol. 18399-405. [DOI] [PubMed] [Google Scholar]
- 16.Ramratnam, B., S. Bonhoeffer, J. Binley, A. Hurley, L. Zhang, J. E. Mittler, M. Markowitz, J. P. Moore, A. S. Perelson, and D. D. Ho. 1999. Rapid production and clearance of HIV-1 and hepatitis C virus assessed by large volume plasma apheresis. Lancet 3541782-1785. [DOI] [PubMed] [Google Scholar]
- 17.Shiver, J. W., T. M. Fu, L. Chen, D. R. Casimiro, M. E. Davies, R. K. Evans, Z. Q. Zhang, A. J. Simon, W. L. Trigona, S. A. Dubey, L. Huang, V. A. Harris, R. S. Long, X. Liang, L. Handt, W. A. Schleif, L. Zhu, D. C. Freed, N. V. Persaud, L. Guan, K. S. Punt, A. Tang, M. Chen, K. A. Wilson, K. B. Collins, G. J. Heidecker, V. R. Fernandez, H. C. Perry, J. G. Joyce, K. M. Grimm, J. C. Cook, P. M. Keller, D. S. Kresock, H. Mach, R. D. Troutman, L. A. Isopi, D. M. Williams, Z. Xu, K. E. Bohannon, D. B. Volkin, D. C. Montefiori, A. Miura, G. R. Krivulka, M. A. Lifton, M. J. Kuroda, J. E. Schmitz, N. L. Letvin, M. J. Caulfield, A. J. Bett, R. Youil, D. C. Kaslow, and E. A. Emini. 2002. Replication-incompetent adenoviral vaccine vector elicits effective anti-immunodeficiency-virus immunity. Nature 415331-335. [DOI] [PubMed] [Google Scholar]
- 18.Silvestri, G., D. L. Sodora, R. A. Koup, M. Paiardini, S. P. O'Neil, H. M. McClure, S. I. Staprans, and M. B. Feinberg. 2003. Nonpathogenic SIV infection of sooty mangabeys is characterized by limited bystander immunopathology despite chronic high-level viremia. Immunity 18441-452. [DOI] [PubMed] [Google Scholar]
- 19.Smit-McBride, Z., J. J. Mattapallil, M. McChesney, D. Ferrick, and S. Dandekar. 1998. Gastrointestinal T lymphocytes retain high potential for cytokine responses but have severe CD4+ T-cell depletion at all stages of simian immunodeficiency virus infection compared to peripheral lymphocytes. J. Virol. 726646-6656. [DOI] [PMC free article] [PubMed] [Google Scholar]
- 20.van't Wout, A. B., N. A. Kootstra, G. A. Mulder-Kampinga, N. Albrecht-van Lent, H. J. Scherpbier, J. Veenstra, K. Boer, R. A. Coutinho, F. Miedema, and H. Schuitemaker. 1994. Macrophage-tropic variants initiate human immunodeficiency virus type 1 infection after sexual, parenteral, and vertical transmission. J. Clin. Investig. 942060-2067. [DOI] [PMC free article] [PubMed] [Google Scholar]
- 21.Veazey, R. S., M. Demaria, L. V. Chalifoux, D. E. Shvetz, D. R. Pauley, H. L. Knight, M. Rosenzweig, R. P. Johnson, R. C. Desrosiers, and A. A. Lackner. 1998. Gastrointestinal tract as a major site of Cd4+ T cell depletion and viral replication in SIV infection. Science 280427-431. [DOI] [PubMed] [Google Scholar]
- 22.Veazey, R. S., and A. A. Lackner. 2004. Getting to the guts of HIV pathogenesis. J. Exp. Med. 200697-700. [DOI] [PMC free article] [PubMed] [Google Scholar]
- 23.Wilson, D. P., J. J. Mattapallil, M. D. Lay, L. Zhang, M. Roederer, and M. P. Davenport. 2007. Estimating the infectivity of CCR5-tropic simian immunodeficiency virus SIVmac251 in the gut. J. Virol. 818025-8029. [DOI] [PMC free article] [PubMed] [Google Scholar]