

Abstract
Neurons and glia are functionally organized into circuits and higher-order structures via synaptic connectivity, well-orchestrated molecular signaling, and activity-dependent refinement. Such organization allows the precise information processing required for complex behaviors. Disruption of nervous systems by genetic deficiency or events such as trauma or environmental exposure may produce a diseased state in which certain aspects of inter-neuron signaling are impaired. Optical imaging techniques allow the direct visualization of individual neurons in a circuit environment. Imaging probes specific for given biomolecules may help elucidate their contribution to proper circuit function. Genetically encoded sensors can visualize trafficking of particular molecules in defined neuronal populations, non-invasively in intact brain or reduced preparations. Sensor analysis in healthy and diseased brains may reveal important differences and shed light on the development and progression of nervous system disorders. We review the field of genetically encoded sensors for molecules and cellular events, and their potential applicability to the study of nervous system disease.
Introduction
The human brain is a complex network of approximately 100 billion neurons. Precise patterns of synaptic connectivity amongst these neurons produce neural circuits, and collectively give rise to our perception of the world. Neurophysiology, the molecular and cellular study of such networks, encompasses the development of axonal and dendritic arbors, the establishment of precise chemical and electrical synapses, action potential generation and propagation via voltage gated-ion channels, presynaptic neurotransmitter packaging and release, postsynaptic neurotransmitter reception, downstream signal transduction cascades, and neural circuit tuning by processes such as long-term potentiation and depression [Fig.1] (for review see [1]). Disruption of any aspect of this complicated signaling network has the potential to give rise to a neurological disorder, in which proper function of these circuits is disturbed. Alzheimer’s, Parkinson’s, and Huntington’s diseases, as well as epilepsy, ischemia (stroke), acute trauma, muscular dystrophy, and aging are only a small subset of known nervous system disorders.
Figure 1. Probing molecular and cellular events in neurons.

Action potentials are propagated by voltage-gated ion channels. At synapses, calcium influx during membrane depolarization can trigger neurotransmitter release via synaptic vesicle trafficking. Neurotransmitters, such as glutamate, then bind to post-synaptic ligand-gated ion channels, directly gating ion current, or to metabotropic receptors, activating ion channels through a G-protein coupled second messenger cascade. The action of second messengers, such as cyclic AMP (cAMP) and Ca2+, regulates downstream pathways, primarily through kinase signaling.
Precise understanding of neuronal system function requires the deciphering of signals within individual neurons, as well as the organization of neuronal populations into circuits and larger structures [2]. Detailed knowledge of the establishment and maintenance of chemical synapses and gap junctions, the flux of molecular signals within the network, how this information processing changes over time and in response to stimuli, and how these properties differ between healthy and diseased brains, will facilitate the search for therapeutic targets for neural disorders.
Recent advances in optical microscopy have made it possible to visualize brain structure and function in vivo [3-7]. Methods include clinically relevant magnetic resonance imaging (MRI) [8] and positron emission tomography (PET) [9], optical coherence tomography [10], wide field and confocal fluorescent microscopy [11], X-ray tomography [12], and multi-photon microscopy [13]. These techniques have trade-offs in terms of invasiveness, spatio-temporal resolution, signal-to-noise ratio (SNR), and generality. Only methods using intrinsic signals or low-toxicity small molecule contrast agents are compatible with human experimentation. Multi-photon fluorescence microscopy (MPM), although incompatible with human use, offers the greatest utility for the study of model organisms, and is the only technique with single-cell spatial resolution, high temporal resolution, and low interference from surrounding tissues [13].
A variety of biochemical and imaging tools have been developed to study the molecular mechanisms of cellular and neuronal networks. For example, gene expression and protein localization and trafficking are routinely studied by genetic fusion of the target to a reporter such as an intrinsically fluorescent protein (FP) (e.g. the Aequorea victoria green fluorescent protein GFP) [14]. Antibodies raised against a target protein are also used to profile protein expression patterns, protein states such as phosphorylation, and macro-molecular complexes [15]. Nucleic acid localization may be detected with high specificity by in situ hybridization [16]. Electrophysiological methods are routinely used to detect waves of ions generated by action potential firing [17].
Neuronal function is heavily dependent on the flux of small molecule signals, for which there are few readily available detection methods. High-sensitivity mass spectrometry [18] can allow the massively parallel study of small molecule abundances in fractionated tissue samples, but this only provides snapshots of activity. Mass spectrometry-based methods are also destructive and prone to artifact [19]. Biosensors have been developed to fill the detection gap for small molecules and related analytes [20].
In general, a protein-based biosensor consists of at least a recognition element and a reporter element [Fig. 2a]. Recognition elements frequently take advantage of naturally evolved or selected proteins [21] or nucleic acids [22] that specifically bind to a target analyte with affinities in the range of physiological concentrations. Reporter elements, such as a covalently attached dye or a fused fluorescent protein, transduce the analyte-induced conformational change in the recognition element into an observable such as fluorescence emission [21]. Biosensor molecules may be applied to cultured cells or brain slice, or injected into animals [23]. The greatest strength, however, is in in situ expression from a transgene. This allows targeting to defined cell populations by promoters and enhancers [24], conditional expression [25], and sub-cellular targeting with signal peptides and retention sequences [26]. Genetically encoded sensors typically employ either a single fluorescent protein or a FRET pair of donor and acceptor FPs as a reporter element.
Figure 2. Schematic of genetically encoded fluorescence sensors.
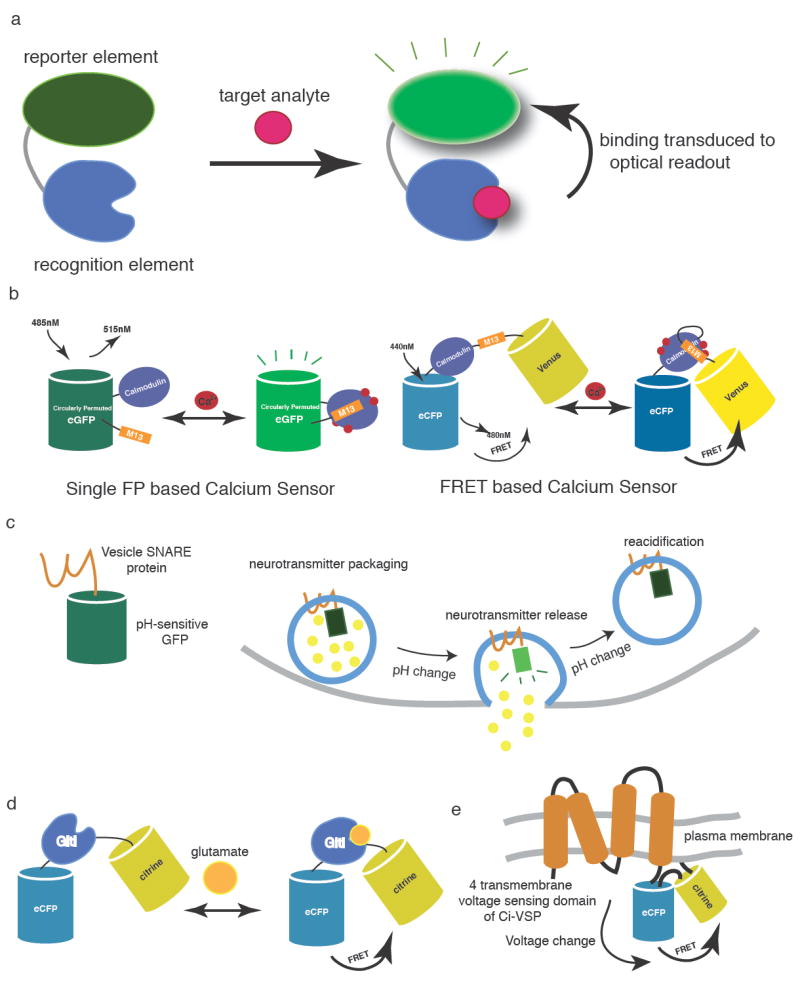
a) A biosensor consists of a recognition element and a reporter element. Upon target binding, the conformational change of the recognition element is transduced into an optical readout by the reporter element. b) Genetically encoded calcium indicators (GECIs). Representatives shown from the GCaMP and cameleon families [133]. Upon calcium binding, conformational change of the calmodulin/M13 complex results in modulation of fluorescence of circularly permuted GFP or of FRET between a CFP / YFP pair. c) The vesicle trafficking pH sensor, synapto-pHluorin [61]. The fluorescence of synapto-pHluorin is quenched by the acidic intraluminal environment of synaptic vesicles (pH ~ 5.6). During neurotransmitter release, vesicles fuse with the plasma membrane, exposing the lumen to the neutral pH of the extracellular environment (pH ~ 7.4), causing a dramatic increase in fluorescence intensity. The fluorescence intensity is then quenched once again after reacidification. d) The genetically encoded glutamate sensor, SuperGluSnFR[54]. The glutamate-binding protein GltI is sandwiched between a pair of FRET protein, ECFP and Citrine. e) Targeting of the fluorescent protein voltage sensor, VSFP2.1, to the plasma membrane [109]. The FRET pair ECFP and Citrine is attached to the C-terminus of the four-transmembrane voltage-sensing domain of Ciona intestinalis voltage-sensitive phosphatase (Ci-VSP).
A vast array of sensors has been created to monitor neurotransmission, synaptic spillover, excitable membrane potential, calcium dynamics, vesicle trafficking, receptor mobilization, and other biochemical events. Here we review advances in engineering and applying genetically encoded sensors. Such reagents can reveal the underlying molecular mechanisms of nervous system disorders, and favor efforts to develop diagnostic and treatment options.
Genetically encoded calcium indicators
The concentration of free divalent calcium ions [Ca2+] is a ubiquitous intracellular second messenger in the nervous system [Fig.1] [27]. Action potential firing opens voltage-gated calcium channels throughout the cell, triggering a large influx of Ca2+, which itself releases intracellular stores of Ca2+, principally from the lumen of the endoplasmic reticulum (ER) [28]. Cytoplasmic [Ca2+] may reach micromolar concentrations during burst firing [29]. The spatiotemporal pattern of intracellular [Ca2+] is largely responsible for signal transduction downstream from action potential firing, primarily via interaction of calcium-loaded calmodulin with thousands of cellular targets [30]. Calcium also underlies many other aspects of physiology, such as programmed cell death [31]. Calcium dyshomeostasis has long been implicated in aging and diseases of the central nervous system [27].
There are many techniques for quantifying the levels of free Ca2+ in living cells and animals [32]. Synthetic small molecule Ca2+-binding dyes have shown ion-dependent fluorescence increases of >100-fold, fast kinetics, and defined cell permeability [32]. Dyes such as Oregon Green BAPTA-1 AM ester (OGB-1) have been used to measure in vivo Ca2+ transients with single action potential-resolution [33, 34]. Small molecule dyes have many limitations, however: their use is invasive, chronic measurements are difficult [35], and they cannot be targeted to defined neuronal populations or sub-cellular locations without added transgenes [36].
Genetically encoded calcium indicators (GECIs) based on FPs address many of the shortcomings of synthetic dyes [37]. The calcium indicators cameleon [38] and FIP-CBSM [39] were the first published genetically encoded molecular sensors for any molecule. The current generation of GECIs is capable of occasional detection of single action potentials in slice preparations [40]. Both single-FP and FP-pair GECIs have advanced significantly in recent years [Fig. 2b][37]. Most GECIs are based on the calcium-binding proteins calmodulin (CaM) or troponin C (TnC), such that they detect Ca2+ in physiologically relevant concentration ranges [37]. Many calmodulin-based GECIs also make use of a helical peptide (e.g. the M13 peptide (M13pep) of myosin light-chain kinase) that binds to calcium-loaded calmodulin, thus magnifying the overall calcium-dependent sensor conformational change and resulting fluorescence modulation [Fig. 2b] [38].
Efforts have been made to quantitatively compare the performance of different GECIs in various systems, e.g. intact mouse brain [25, 41] and brain slice [40, 42], and the Drosophila melanogaster neuromuscular junction [43]. In cultured mammalian cells, GECIs have enabled the detection of sub-cellular calcium signals by targeted expression in the cytosol and plasma membrane [41, 44], ER [45], mitochondria [46], and nucleus [38]. GECIs have been used to study odor-evoked neural activity in fly [47], zebrafish [48], worm [49, 50], and mouse [25]. In zebrafish, GECIs were also used to study Ca2+ signals in identified motor and spinal cord neurons during escape behavior [51].
Protein engineering efforts have significantly improved the properties of several GECI classes. Overall sensor brightness and fluorescence change have been improved by substitution of superior FPs [52], linker truncation [53, 54], FP circular permutation [55], and by site-directed [56] and random [57] mutagenesis. Affinity and specificity of the binding domain for Ca2+ have been tuned by rational design [58]. More recently, efforts have focused on reducing the perturbative effects of over-expressing sensors containing CaM or CaM-binding peptides, which may interfere with endogenous signaling mechanisms. Computational protein design has yielded “bump-hole” versions of CaM and M13pep [44], which may decrease interaction with host proteins. These sensors (D1, D2cpv, D3cpv, D4cpv) show improved performance relative to unmutated sensors when targeted to the intracellular face of the plasma membrane [44]. Troponin C, a skeletal muscle protein, is not normally present in neurons and is expected to have fewer interactions with endogenous proteins; recent sensor versions can detect 2-3 APs in transgenic mice [59].
Efforts to improve GECI performance to the level of small molecule dyes continue. Quantitative modeling of GECI dynamics in neurons can prioritize design strategies (SA Hires, L Tian, LL Looger, in press). High-level GECI expression from virus may improve sensor signal-to-noise ratio. The structure of the calcium-bound form of the GCaMP2 calcium indicator has been solved [60], which should facilitate structure-guided improvement of sensor properties. Several transgenic mouse lines of GECIs have been [25, 59] or are being (Olga Garaschuk, Guoping Feng, personal communications) produced.
Vesicle and receptor trafficking sensors
Neurotransmitters are concentrated in acidic secretory vesicles at presynaptic terminals before release into the synaptic cleft. The luminal surface of neurotransmitter vesicles experiences a pH increase from ~5.6 to ~7.4 upon fusion with the extra-cellular plasma membrane [Fig. 2c]. A family of very pH-sensitive fluorescent proteins, the pHluorins, with intermediate pKa values, has been developed [61]. This family includes ratiometric [61] and non-ratiometric (“ecliptic” [61] or “superecliptic” [62]) GFP pHluorins (pKa ~ 7.1), and the ecliptic protein mOrange2 (pKa ~ 6.5) [63]. Fusion of the ecliptic GFP pHluorin to the luminal end of the vesicular SNARE protein VAMP2 results in a vesicle trafficking sensor known as synapto-pHluorin (spH) [Fig. 2c] [61]. SpH and related sensors such as vGLUT1pHluorin [64] display a large vesicle fusion-dependent fluorescence increase. Insertion of ecliptic pHluorin into the second intraluminal loop of synaptophysin resulted in a sensor, synaptophysin-pHluorin (sypHy), with improved SNR and decreased non-target surface staining [65, 66]. Construction of an mOrange2-based vesicle sensor would allow imaging with red-shifted excitation light, decreasing tissue aberration effects.
Sensors based on pHluorins have been used to study in vivo vesicle cycling and presynaptic activity in fly [67] and mouse olfactory sensory neurons [68], Caenorhabditis elegans thermosensory [69] and motor neurons [70], the Drosophila neuro-muscular junction [43], rat hippocampal neurons [61], Aplysia mechanosensory neurons [71], and astrocytic neurotransmitter vesicle exocytosis [72]. Transgenic Thy1.2-promoter mice lines expressing spH in a stochastic subset of hippocampal and cortical neurons have been bred [73]. Transgenic mice with spH under control of the olfactory marker protein (OMP) promoter facilitated the mapping of odor-evoked olfactory receptor neuron activity in awake, behaving mice [68]. Importantly, sensor response was shown to correlate with presynaptic calcium influx and stimulus intensity [68].
pHluorins have also been used to study the cycling of postsynaptic neurotransmitter receptors, which undergo a significant pH change between extracellular functional proteins and inactive protein in the lumen of the endoplasmic reticulum. Internalization of AMPA receptors [74, 75], metabotropic glutamate receptors [76], and GABAA receptors [77] has been observed in this manner. Similarly constructed sensors may allow the monitoring of surface dynamics and internalization of a wide array of neurotransmitter and neuromodulator receptors, both pre-and postsynaptic.
Glutamate sensors
Several methods, including outside-out patch electrodes [78], enzymatically coupled electrochemical probes [79], and enzymatically coupled metabolite imaging [80], have been used for the detection of the excitatory neurotransmitter glutamate. Recently, two similar genetically encoded methods, dubbed FLIPE [81] and GluSnFR [82], were shown to have sufficient affinity and spatio-temporal resolution to specifically detect synaptic glutamate release on the surface of single cultured neurons. These are composed of the Escherichia coli periplasmic glutamate-binding protein GltI (also known as YbeJ) bracketed by ECFP and a yellow fluorescent protein [Fig. 2d]. A membrane anchoring sequence is optionally used to tether the sensors to the extracellular surface of mammalian cells. These sensor families have a range of affinities, created by rational mutagenesis of the glutamate-binding pocket. The dynamic range of untethered FLIPE was dramatically improved by insertion of ECFP into a flexible loop of GltI [53]. Bulk loading of this improved sensor, FLII81E, onto rat cortical slices demonstrated a broad spread of glutamate following field stimulation when GABAergic inhibition was blocked with GABAzine [23]. The dynamic range of the membrane tethered GluSnFR was increased by systematic linker truncations. This improved sensor, known as SuperGluSnFR, made direct measurements of the time course of glutamate release, spillover, and uptake on the surface of cultured hippocampal neurons [54], revealing persistent, significant glutamate spillover and NMDA receptor priming during burst firing. Combining these tools with existing model systems will help address the role of glutamate in neurodegeneration, epilepsy and stroke (ischemia), and may prove useful in screening drug candidates that affect glutamate release, breakdown, or clearance.
Sensors for other metabolites and events
Many other metabolites and biochemical events are important to neuronal physiology. Carbohydrates are the key energetic currency in all cell types, and a variety of high-quality carbohydrate sensors exist, including those for glucose [53, 83], ribose [84], sucrose [85], arabinose [86], maltose [87], and maltotriose (LL Looger, unpublished results). Altered glucose metabolism has been suggested as a contributing factor in the development of Alzheimer’s disease and related neurodegenerative disorders [88]; sensors specific for glucose and key catabolites could monitor this process. Sensors specific for tryptophan [89] and arginine [90] can uncover unexpected aspects of amino acid metabolism. Synaptic glutamate is taken up primarily by astrocytes, which then convert it to glutamine before release. A genetically encoded glutamine sensor would enable the tracking of the glutamate-glutamine cycle. Phenylketonuria (PKU), a genetic deficiency in the conversion of phenylalanine to tyrosine, can give rise to an autism-like disorder [91], and specific sensors for these amino acids may be useful for understanding this metabolic malfunction.
Phosphate-dependent loading of glutamate vesicles by vGLUT1 [92] closely links Pi trafficking to glutamate metabolism; a high-SNR genetically encoded sensor for Pi has recently been published [93]. Divalent zinc ions (Zn2+) are vesicularly accumulated in some classes of neocortical glutamatergic neurons [94]. Zn2+ modulates the activity of glutamate and GABA receptors, and is implicated in synaptic plasticity [95]. A recently-engineered Zn2+-sensing protein (Amy Palmer, personal communication) will enable its tracking in vivo. High-quality genetically encoded indicators have been designed for the cyclic nucleotides cAMP and cGMP, ubiquitous second messenger molecules (reviewed in [96]). Dysregulation of cAMP levels has been implicated in prefrontal cortex maladies such as attention-deficit hyperactivity disorder (ADHD) [97]. Reactive oxygen species (ROS) are thought to be central to the etiology of numerous neurodegenerative diseases and are potentially at the heart of the aging process [98]. GFP with an engineered disulfide bond near the chromophore can sense redox potential [99]. The HyPer sensor for H2O2 [100] should allow detection of this ROS species. By fusing substrate peptides between a FRET pair of FPs, numerous sensors have been engineered to probe enzyme activity [101], including kinases [102, 103], caspases [104], β-secretase [105], and Ras GTPase [106].
Voltage sensors
Neurons are fundamentally electrical in nature. Electrodes have revealed most of what is known about the activity of neurons in the brain, and voltage-sensitive small molecule dyes are gaining acceptance. Genetically encoded voltage indicators (GEVIs) directly transduce the underlying membrane depolarizations into fluorescence signals with all the advantages of genetic targeting. Previous attempts to engineer voltage-gated ion channels (VGICs), as well as VGIC subdomains, into fluorescent voltage reporters produced sensors with low signal-to-noise, poor membrane targeting, and toxic cellular effects [107]. The discovery of monomeric, voltage-gated phosphatases [108] opened new avenues for voltage sensor construction; the sensor VSFP2.1, based on the voltage “paddle” from the Ciona intestinalis enzyme, shows good membrane targeting and a modest voltage-dependent FRET change [Fig. 2e] [109]. “Hybrid” voltage sensors with both protein and small molecule components [110, 111] are another alternative. The current generation of GEVIs is unlikely to be useful for analyzing patterns of neural activity; further protein engineering is required to improve sensor response.
Imaging the connectome
The precise synaptic wiring diagram of a nervous system (the “connectome” [112]) is the basis of behavior. Many nervous system disorders correlate with altered wiring diagrams. For example, mutations in synaptic adhesion molecules have been associated with autism spectrum disorders [113]. Wiring diagram defects are thought to underlie developmental conditions such as schizophrenia [112]. Mapping the exact synaptic connectivity of the 302-neuron C. elegans adult nervous system has only recently been completed [114, 115]; this effort required the combination of electron microscopy (EM) resolution of cells and synapses, together with light microscopy of cell-specific fluorescent proteins to assist in EM image segmentation and process tracing. Various viruses, microbial toxins, and carbohydrate-binding proteins have been demonstrated to “trace” neuronal connectivity [2]. Few trans-neuronal tracers, however, have been demonstrated to be truly trans-synaptic [2], and such reagents may merely demonstrate spatial position rather than synaptic connectivity. Two recent genetically encodable constructs may help in assigning functional neuronal connectivity, and real-time changes in cellular and synaptic morphology.
GFP has been engineered into two soluble, functionally complementing (“split”) fragments [116]. Extracellular membrane expression of one GFP fragment pre-and the other post-synaptically in C. elegans neurons resulted in reconstitution of fluorescence at the site of synapse formation [117]. This technique allows synapse specification in a genetically targeted neuronal population. A second recent method is the stochastic expression of different FPs throughout the neurons of the brain, known as the “Brainbow” [118]. A stochastic recombination event in each neuron in the system generates expression of a single FP, permitting multi-color assignment of neuronal processes to cell bodies, and visualization of developmental changes in many cells simultaneously. Imaging in an earlier two-color transgenic animal clearly showed real-time in vivo synaptic competition between motor neurons [119]. These and related techniques will facilitate in vivo quantification of wiring diagram differences between healthy and diseased nervous systems, as well as monitoring real-time changes in neuronal morphology and synaptic connectivity.
Case study: calcium imaging of an Alzheimer’s mouse model
An increasing number of faithful mouse models have been created for studying neurological disorders, including Alzheimer’s disease (AD) [120], ischemia [121], epilepsy [122], and brain trauma [123]. Designed probes can be driven in specific cell populations of disease model mice for use in in vivo imaging studies [Fig. 3a]. Human AD has been linked to mutations in numerous genetic loci [124] and is perhaps the human disease best studied in model organisms [3]. Expression in mouse of any of several AD-linked protein variants, either by transgenesis or by knock-in, produces an AD-like phenotype of varying severity. Mouse lines recapitulating the broadest range of human AD symptoms include: PS1KI, a mouse with a mutant M146V presenilin-1 gene knocked into the endogenous locus [125]; APPSweTauP301L [126], which transgenically expresses the “Swedish” allele of the Alzheimer’s precursor protein APP, as well as a mutant P301L variant of the microtubule-associated protein Tau; and the triple transgenic line 3xTg-AD, generated from PS1KI by transgenic expression of both APPSwe and TauP301L [120]. These mice show accumulation of β-amyloid (Aβ) plaques, neurofibrillary tangles, premature neuronal death, synaptic plasticity defects, and severe cognitive decline [126].
Figure 3. Imaging neurological disorders.
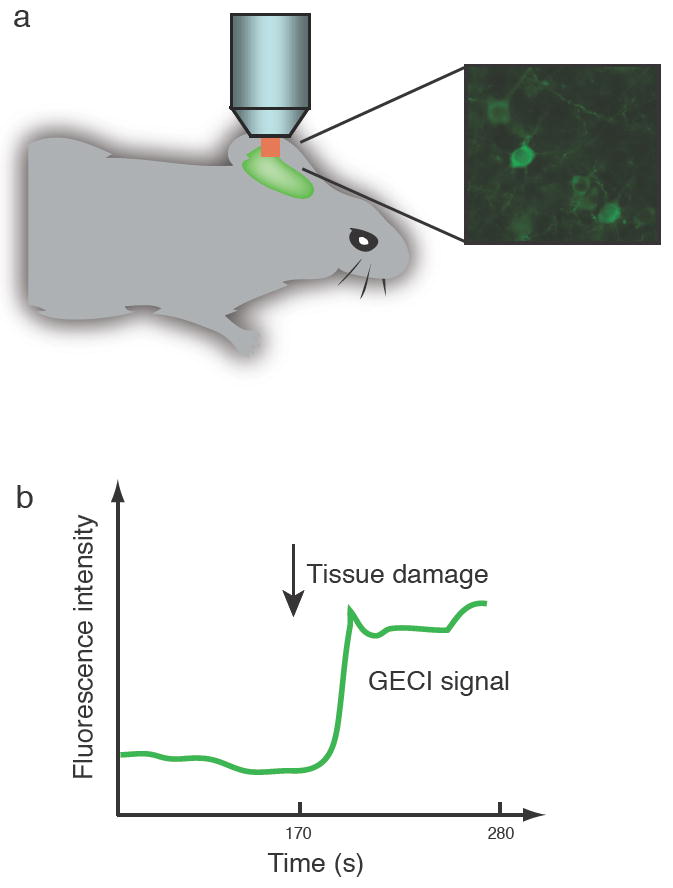
a) Neurons labeled with genetically encoded sensors can be visualized by in vivo imaging. b) Schematic representation of sensor response to acute challenge in in vivo mouse preparation.
Increased cellular calcium signaling has shown to lead to accumulation of amyloid plaque, hyper-phosphorylation of Tau, and enhanced neuronal apoptosis [127]. The similarity of this phenotype with the AD state supports the “calcium hypothesis” of AD [128]. Imaging of Ca2+ fluxes in sliced and intact brains would greatly accelerate understanding of the linkage between Ca2+ metabolism and disease [Fig. 3b]. Small molecule calcium dyes such as fura-2 and OGB-1 have been used extensively in reduced preparations [126, 129], and more recently in vivo imaging [130], of AD model mice. Calcium imaging in several strains showed that AD model mice show exaggerated IP3-evoked neuronal Ca2+ transients [129], due to presenilin mutations rather than to Aβ plaques or neurofibrillary tangles. Furthermore, the underlying mechanism for this Ca2+-induced Ca2+ release (CICR) mode of calcium dysregulation was surprisingly shown to be through ryanodine receptors in the ER rather than IP3 receptors [126]. Greater coupling between cytosolic free [Ca2+] and potassium channel activation led to greatly increased IP3-dependent membrane hyperpolarization in AD mice than in wild-type [129]. These changes were found to be age-independent and thus represent a discrete “calciumopathy” rather than a normal consequence of aging [126].
Calcium imaging in model organisms will continue to yield insights into the molecular pathologies of AD, ischemia [121], and other disorders. Small molecule Ca2+ dyes continue to improve in signal change and targetability [32, 131]. Importantly, expression of GECIs in specific cell types in model mice will reveal circuit-level dysfunctions in calcium signaling. Transgenic mouse strains expressing improved GECIs are under construction; this should allow high-signal-to-noise calcium monitoring in genetically specified neuronal populations with minimal invasiveness.
Conclusions and future directions
Many human nervous system diseases have been simulated by mouse models. Imaging the brains of these animals, both in vivo and in reduced preparations, can show modes of disease progression. Probing animals with genetically encoded sensors specific for particular primary and secondary messenger molecules may further reveal the underlying molecular basis of these physiological changes. Sensors for a variety of neurotransmitters, intracellular signaling molecules, and metabolites have been created and deployed in model organisms. Complex neurological disorders can have many etiologies, suggesting the disruption of common signaling pathways. Existing and improved genetically encoded sensors for molecules such as glutamate and calcium are likely to be applicable to myriad disease models. In addition to helping establish the molecular basis of complex phenomena such as learning and memory, these sensors can track disease markers for diagnosis, and identify potential therapeutic targets. Simultaneous imaging from several sensors will quantify flux through signaling and metabolic networks, at high spatiotemporal resolution. The rapid improvement of imaging hardware and techniques, such as random-access microscopy [132], together with iterated rounds of sensor engineering, will expand the range of brain regions and experimental conditions accessible to this approach. With advances in protein engineering methods, it seems possible to create genetically encoded sensors specific for any target molecule or event relevant to neuronal function. In future, the complete set of biochemical events producing a complex phenotype such as dementia may be revealed.
Acknowledgments
We would like to give special thanks to members of the Looger laboratory for comments and critical reading of the manuscript.
Footnotes
Publisher's Disclaimer: This is a PDF file of an unedited manuscript that has been accepted for publication. As a service to our customers we are providing this early version of the manuscript. The manuscript will undergo copyediting, typesetting, and review of the resulting proof before it is published in its final citable form. Please note that during the production process errors may be discovered which could affect the content, and all legal disclaimers that apply to the journal pertain.
References
- 1.Albright TD, Jessell TM, Kandel ER, Posner MI. Neuron. 2000;25(Suppl):S1. doi: 10.1016/s0896-6273(00)80912-5. [DOI] [PubMed] [Google Scholar]
- 2.Luo L, Callaway EM, Svoboda K. Neuron. 2008;57:634. doi: 10.1016/j.neuron.2008.01.002. [DOI] [PMC free article] [PubMed] [Google Scholar]
- 3.Bacskai BJ, et al. Proc Natl Acad Sci U S A. 2003;100:12462. doi: 10.1073/pnas.2034101100. [DOI] [PMC free article] [PubMed] [Google Scholar]
- 4.Levene MJ, Dombeck DA, Kasischke KA, Molloy RP, Webb WW. J Neurophysiol. 2004;91:1908. doi: 10.1152/jn.01007.2003. [DOI] [PubMed] [Google Scholar]
- 5.Svoboda K, Denk W, Kleinfeld D, Tank DW. Nature. 1997;385:161. doi: 10.1038/385161a0. [DOI] [PubMed] [Google Scholar]
- 6.Trachtenberg JT, et al. Nature. 2002;420:788. doi: 10.1038/nature01273. [DOI] [PubMed] [Google Scholar]
- 7.Young P, Feng G. Curr Opin Neurobiol. 2004;14:642. doi: 10.1016/j.conb.2004.08.007. [DOI] [PubMed] [Google Scholar]
- 8.Callaghan PT. Principles of Nuclear Magnetic Resonance Micropscopy. Clarendon, 1991. [Google Scholar]
- 9.Schmidt KC, Smith CB. Nucl Med Biol. 2005;32:719. doi: 10.1016/j.nucmedbio.2005.04.020. [DOI] [PubMed] [Google Scholar]
- 10.Fujimoto JG. Nat Biotechnol. 2003;21:1361. doi: 10.1038/nbt892. [DOI] [PubMed] [Google Scholar]
- 11.Herman B. Curr Protoc Immunol. 2002;Chapter 21:Unit 21.2. doi: 10.1002/0471142735.im2102s48. [DOI] [PubMed] [Google Scholar]
- 12.Paulus MJ, Gleason SS, Kennel SJ, Hunsicker PR, Johnson DK. Neoplasia. 2000;2:62. doi: 10.1038/sj.neo.7900069. [DOI] [PMC free article] [PubMed] [Google Scholar]
- 13.Helmchen F, Denk W. Nat Methods. 2005;2:932. doi: 10.1038/nmeth818. [DOI] [PubMed] [Google Scholar]
- 14.van Roessel P, Brand AH. Nat Cell Biol. 2002;4:E15. doi: 10.1038/ncb0102-e15. [DOI] [PubMed] [Google Scholar]
- 15.Mandell JW. Am J Pathol. 2003;163:1687. doi: 10.1016/S0002-9440(10)63525-0. [DOI] [PMC free article] [PubMed] [Google Scholar]
- 16.Lloyd RV. Hum Pathol. 2007;38:1103. doi: 10.1016/j.humpath.2007.05.005. [DOI] [PubMed] [Google Scholar]
- 17.Sakmann B, Neher E. Annu Rev Physiol. 1984;46:455. doi: 10.1146/annurev.ph.46.030184.002323. [DOI] [PubMed] [Google Scholar]
- 18.Dunn WB. Phys Biol. 2008;5:11001. doi: 10.1088/1478-3975/5/1/011001. [DOI] [PubMed] [Google Scholar]
- 19.Little JL. J Chromatogr A. 1999;844:1. doi: 10.1016/s0021-9673(99)00267-8. [DOI] [PubMed] [Google Scholar]
- 20.Borisov SM, Wolfbeis OS. Chem Rev. 2008;108:423. doi: 10.1021/cr068105t. [DOI] [PubMed] [Google Scholar]
- 21.Dwyer MA, Hellinga HW. Curr Opin Struct Biol. 2004;14:495. doi: 10.1016/j.sbi.2004.07.004. [DOI] [PubMed] [Google Scholar]
- 22.Ferapontova EE, Olsen EM, Gothelf KV. J Am Chem Soc. 2008;130:4256. doi: 10.1021/ja711326b. [DOI] [PubMed] [Google Scholar]
- 23.Dulla C, et al. J Neurosci Methods. 2008;168:306. doi: 10.1016/j.jneumeth.2007.10.017. [DOI] [PMC free article] [PubMed] [Google Scholar]
- 24.Feng G, et al. Neuron. 2000;28:41. doi: 10.1016/s0896-6273(00)00084-2. [DOI] [PubMed] [Google Scholar]
- 25.Hasan MT, et al. PLoS Biol. 2004;2:e163. doi: 10.1371/journal.pbio.0020163. [DOI] [PMC free article] [PubMed] [Google Scholar]
- 26.Fehr M, Lalonde S, Ehrhardt DW, Frommer WB. J Fluoresc. 2004;14:603. doi: 10.1023/b:jofl.0000039347.94943.99. [DOI] [PubMed] [Google Scholar]
- 27.Burgoyne RD. Nat Rev Neurosci. 2007;8:182. doi: 10.1038/nrn2093. [DOI] [PMC free article] [PubMed] [Google Scholar]
- 28.Ghosh A, Greenberg ME. Science. 1995;268:239. doi: 10.1126/science.7716515. [DOI] [PubMed] [Google Scholar]
- 29.Helmchen F, Imoto K, Sakmann B. Biophys J. 1996;70:1069. doi: 10.1016/S0006-3495(96)79653-4. [DOI] [PMC free article] [PubMed] [Google Scholar]
- 30.Denk W, Yuste R, Svoboda K, Tank DW. Curr Opin Neurobiol. 1996;6:372. doi: 10.1016/s0959-4388(96)80122-x. [DOI] [PubMed] [Google Scholar]
- 31.Clapham DE. Cell. 2007;131:1047. doi: 10.1016/j.cell.2007.11.028. [DOI] [PubMed] [Google Scholar]
- 32.Tsien RY. In: Monitoring Cell Calcium. Carafoli E, Klee CB, editors. Oxford University Press; USA: 1999. pp. 28–54. [Google Scholar]
- 33.Kerr JN, Denk W. Nat Rev Neurosci. 2008;9:195. doi: 10.1038/nrn2338. [DOI] [PubMed] [Google Scholar]
- 34.Stosiek C, Garaschuk O, Holthoff K, Konnerth A. Proc Natl Acad Sci U S A. 2003;100:7319. doi: 10.1073/pnas.1232232100. [DOI] [PMC free article] [PubMed] [Google Scholar]
- 35.Di Virgilio F, Steinberg TH, Swanson JA, Silverstein SC. J Immunol. 1988;140:915. [PubMed] [Google Scholar]
- 36.Tour O, et al. Nat Chem Biol. 2007;3:423. doi: 10.1038/nchembio.2007.4. [DOI] [PMC free article] [PubMed] [Google Scholar]
- 37.Mank M, Griesbeck O. Chem Rev. 2008 [Google Scholar]
- 38.Miyawaki A, et al. Nature. 1997;388:882. doi: 10.1038/42264. [DOI] [PubMed] [Google Scholar]
- 39.Romoser VA, Hinkle PM, Persechini A. J Biol Chem. 1997;272:13270. doi: 10.1074/jbc.272.20.13270. [DOI] [PubMed] [Google Scholar]
- 40.Mao T, O’Connor DH, Scheuss V, Nakai J, Svoboda K. PLoS ONE. 2008;3:e1796. doi: 10.1371/journal.pone.0001796. [DOI] [PMC free article] [PubMed] [Google Scholar]
- 41.Heim N, Griesbeck O. J Biol Chem. 2004;279:14280. doi: 10.1074/jbc.M312751200. [DOI] [PubMed] [Google Scholar]
- 42.Pologruto TA, Yasuda R, Svoboda K. J Neurosci. 2004;24:9572. doi: 10.1523/JNEUROSCI.2854-04.2004. [DOI] [PMC free article] [PubMed] [Google Scholar]
- 43.Reiff DF, et al. J Neurosci. 2005;25:4766. doi: 10.1523/JNEUROSCI.4900-04.2005. [DOI] [PMC free article] [PubMed] [Google Scholar]
- 44.Palmer AE, et al. Chem Biol. 2006;13:521. doi: 10.1016/j.chembiol.2006.03.007. [DOI] [PubMed] [Google Scholar]
- 45.Palmer AE, Jin C, Reed JC, Tsien RY. Proc Natl Acad Sci U S A. 2004;101:17404. doi: 10.1073/pnas.0408030101. [DOI] [PMC free article] [PubMed] [Google Scholar]
- 46.Ishii K, Hirose K, Iino M. EMBO Rep. 2006;7:390. doi: 10.1038/sj.embor.7400620. [DOI] [PMC free article] [PubMed] [Google Scholar]
- 47.Wang Y, et al. Neuron. 2001;29:267. doi: 10.1016/s0896-6273(01)00196-9. [DOI] [PubMed] [Google Scholar]
- 48.Yaksi E, Friedrich RW. Nat Methods. 2006;3:377. doi: 10.1038/nmeth874. [DOI] [PubMed] [Google Scholar]
- 49.Chalasani SH, et al. Nature. 2007;450:63. doi: 10.1038/nature06292. [DOI] [PubMed] [Google Scholar]
- 50.Hilliard MA, et al. EMBO J. 2005;24:63. doi: 10.1038/sj.emboj.7600493. [DOI] [PMC free article] [PubMed] [Google Scholar]
- 51.Higashijima S, Masino MA, Mandel G, Fetcho JR. J Neurophysiol. 2003;90:3986. doi: 10.1152/jn.00576.2003. [DOI] [PubMed] [Google Scholar]
- 52.Griesbeck O, Baird GS, Campbell RE, Zacharias DA, Tsien RY. J Biol Chem. 2001;276:29188. doi: 10.1074/jbc.M102815200. [DOI] [PubMed] [Google Scholar]
- 53.Deuschle K, et al. Protein Sci. 2005;14:2304. doi: 10.1110/ps.051508105. [DOI] [PMC free article] [PubMed] [Google Scholar]
- 54.Hires SA, Zhu Y, Tsien RY. Proc Natl Acad Sci U S A. 2008;105:4411. doi: 10.1073/pnas.0712008105. [DOI] [PMC free article] [PubMed] [Google Scholar]
- 55.Nagai T, Yamada S, Tominaga T, Ichikawa M, Miyawaki A. Proc Natl Acad Sci U S A. 2004;101:10554. doi: 10.1073/pnas.0400417101. [DOI] [PMC free article] [PubMed] [Google Scholar]
- 56.Souslova EA, et al. BMC Biotechnol. 2007;7:37. doi: 10.1186/1472-6750-7-37. [DOI] [PMC free article] [PubMed] [Google Scholar]
- 57.Tallini YN, et al. Proc Natl Acad Sci U S A. 2006;103:4753. doi: 10.1073/pnas.0509378103. [DOI] [PMC free article] [PubMed] [Google Scholar]
- 58.Mank M, et al. Biophys J. 2006;90:1790. doi: 10.1529/biophysj.105.073536. [DOI] [PMC free article] [PubMed] [Google Scholar]
- 59.Heim N, et al. Nat Methods. 2007;4:127. doi: 10.1038/nmeth1009. [DOI] [PubMed] [Google Scholar]
- 60.Rodriguez Guilbe MM, et al. Acta Crystallographica F. in press. [Google Scholar]
- 61.Miesenbock G, De Angelis DA, Rothman JE. Nature. 1998;394:192. doi: 10.1038/28190. [DOI] [PubMed] [Google Scholar]
- 62.Sankaranarayanan S, De Angelis D, Rothman JE, Ryan TA. Biophys J. 2000;79:2199. doi: 10.1016/S0006-3495(00)76468-X. [DOI] [PMC free article] [PubMed] [Google Scholar]
- 63.Shaner NC, et al. Nat Methods. 2008;5:545. doi: 10.1038/nmeth.1209. [DOI] [PMC free article] [PubMed] [Google Scholar]
- 64.Voglmaier SM, et al. Neuron. 2006;51:71. doi: 10.1016/j.neuron.2006.05.027. [DOI] [PubMed] [Google Scholar]
- 65.Granseth B, Odermatt B, Royle SJ, Lagnado L. Neuron. 2006;51:773. doi: 10.1016/j.neuron.2006.08.029. [DOI] [PubMed] [Google Scholar]
- 66.Zhu Y, Xu J, Stevens CF. Society for Neurosciences Abstracts. :968.7. [Google Scholar]
- 67.Ng M, et al. Neuron. 2002;36:463. doi: 10.1016/s0896-6273(02)00975-3. [DOI] [PubMed] [Google Scholar]
- 68.Bozza T, McGann JP, Mombaerts P, Wachowiak M. Neuron. 2004;42:9. doi: 10.1016/s0896-6273(04)00144-8. [DOI] [PubMed] [Google Scholar]
- 69.Samuel AD, Silva RA, Murthy VN. J Neurosci. 2003;23:373. doi: 10.1523/JNEUROSCI.23-02-00373.2003. [DOI] [PMC free article] [PubMed] [Google Scholar]
- 70.Dittman JS, Kaplan JM. Proc Natl Acad Sci U S A. 2006;103:11399. doi: 10.1073/pnas.0600784103. [DOI] [PMC free article] [PubMed] [Google Scholar]
- 71.Kim JH, et al. Neuron. 2003;40:151. doi: 10.1016/s0896-6273(03)00595-6. [DOI] [PubMed] [Google Scholar]
- 72.Bowser DN, Khakh BS. Proc Natl Acad Sci U S A. 2007;104:4212. doi: 10.1073/pnas.0607625104. [DOI] [PMC free article] [PubMed] [Google Scholar]
- 73.Li Z, et al. Proc Natl Acad Sci U S A. 2005;102:6131. doi: 10.1073/pnas.0501145102. [DOI] [PMC free article] [PubMed] [Google Scholar]
- 74.Ashby MC, et al. J Neurosci. 2004;24:5172. doi: 10.1523/JNEUROSCI.1042-04.2004. [DOI] [PMC free article] [PubMed] [Google Scholar]
- 75.Ashby MC, Maier SR, Nishimune A, Henley JM. J Neurosci. 2006;26:7046. doi: 10.1523/JNEUROSCI.1235-06.2006. [DOI] [PMC free article] [PubMed] [Google Scholar]
- 76.Pelkey KA, Yuan X, Lavezzari G, Roche KW, McBain CJ. Neuropharmacology. 2007;52:108. doi: 10.1016/j.neuropharm.2006.07.020. [DOI] [PubMed] [Google Scholar]
- 77.Jacob TC, et al. J Neurosci. 2005;25:10469. doi: 10.1523/JNEUROSCI.2267-05.2005. [DOI] [PMC free article] [PubMed] [Google Scholar]
- 78.Allen TG. Trends Neurosci. 1997;20:192. doi: 10.1016/s0166-2236(96)01039-9. [DOI] [PubMed] [Google Scholar]
- 79.Pomerleau F, Day BK, Huettl P, Burmeister JJ, Gerhardt GA. Ann N Y Acad Sci. 2003;1003:454. doi: 10.1196/annals.1300.051. [DOI] [PubMed] [Google Scholar]
- 80.Innocenti B, Parpura V, Haydon PG. J Neurosci. 2000;20:1800. doi: 10.1523/JNEUROSCI.20-05-01800.2000. [DOI] [PMC free article] [PubMed] [Google Scholar]
- 81.Okumoto S, et al. Proc Natl Acad Sci U S A. 2005;102:8740. doi: 10.1073/pnas.0503274102. [DOI] [PMC free article] [PubMed] [Google Scholar]
- 82.Tsien RY. FEBS Lett. 2005;579:927. doi: 10.1016/j.febslet.2004.11.025. [DOI] [PubMed] [Google Scholar]
- 83.Fehr M, Lalonde S, Lager I, Wolff MW, Frommer WB. J Biol Chem. 2003;278:19127. doi: 10.1074/jbc.M301333200. [DOI] [PubMed] [Google Scholar]
- 84.Lager I, Fehr M, Frommer WB, Lalonde S. FEBS Lett. 2003;553:85. doi: 10.1016/s0014-5793(03)00976-1. [DOI] [PubMed] [Google Scholar]
- 85.Lager I, Looger LL, Hilpert M, Lalonde S, Frommer WB. J Biol Chem. 2006;281:30875. doi: 10.1074/jbc.M605257200. [DOI] [PubMed] [Google Scholar]
- 86.Kaper T, Lager I, Looger LL, Chermak D, Frommer WB. Biotechnol Biofuels. 2008;1:11. doi: 10.1186/1754-6834-1-11. [DOI] [PMC free article] [PubMed] [Google Scholar]
- 87.Fehr M, Frommer WB, Lalonde S. Proc Natl Acad Sci U S A. 2002;99:9846. doi: 10.1073/pnas.142089199. [DOI] [PMC free article] [PubMed] [Google Scholar]
- 88.Hoyer S. Eur J Pharmacol. 2004;490:115. doi: 10.1016/j.ejphar.2004.02.049. [DOI] [PubMed] [Google Scholar]
- 89.Kaper T, et al. PLoS Biol. 2007;5:e257. doi: 10.1371/journal.pbio.0050257. [DOI] [PMC free article] [PubMed] [Google Scholar]
- 90.Bogner M, Ludewig U. J Fluoresc. 2007;17:350. doi: 10.1007/s10895-007-0192-2. [DOI] [PubMed] [Google Scholar]
- 91.Baieli S, Pavone L, Meli C, Fiumara A, Coleman M. J Autism Dev Disord. 2003;33:201. doi: 10.1023/a:1022999712639. [DOI] [PubMed] [Google Scholar]
- 92.Bellocchio EE, Reimer RJ, Fremeau RTJ, Edwards RH. Science. 2000;289:957. doi: 10.1126/science.289.5481.957. [DOI] [PubMed] [Google Scholar]
- 93.Gu H, et al. FEBS Lett. 2006;580:5885. doi: 10.1016/j.febslet.2006.09.048. [DOI] [PMC free article] [PubMed] [Google Scholar]
- 94.Frederickson CJ. Int Rev Neurobiol. 1989;31:145. doi: 10.1016/s0074-7742(08)60279-2. [DOI] [PubMed] [Google Scholar]
- 95.Frederickson CJ, Koh JY, Bush AI. Nat Rev Neurosci. 2005;6:449. doi: 10.1038/nrn1671. [DOI] [PubMed] [Google Scholar]
- 96.VanEngelenburg SB, Palmer AE. Curr Opin Chem Biol. 2008;12:60. doi: 10.1016/j.cbpa.2008.01.020. [DOI] [PubMed] [Google Scholar]
- 97.Asghari V, et al. J Neurochem. 1995;65:1157. doi: 10.1046/j.1471-4159.1995.65031157.x. [DOI] [PubMed] [Google Scholar]
- 98.Stadtman ER, Berlett BS. Drug Metab Rev. 1998;30:225. doi: 10.3109/03602539808996310. [DOI] [PubMed] [Google Scholar]
- 99.Jiang K, et al. Plant Physiol. 2006;141:397. doi: 10.1104/pp.106.078246. [DOI] [PMC free article] [PubMed] [Google Scholar]
- 100.Belousov VV, et al. Nat Methods. 2006;3:281. doi: 10.1038/nmeth866. [DOI] [PubMed] [Google Scholar]
- 101.Lalonde S, Ehrhardt DW, Frommer WB. Curr Opin Plant Biol. 2005;8:574. doi: 10.1016/j.pbi.2005.09.015. [DOI] [PMC free article] [PubMed] [Google Scholar]
- 102.Zhang J, Ma Y, Taylor SS, Tsien RY. Proc Natl Acad Sci U S A. 2001;98:14997. doi: 10.1073/pnas.211566798. [DOI] [PMC free article] [PubMed] [Google Scholar]
- 103.Ting AY, Kain KH, Klemke RL, Tsien RY. Proc Natl Acad Sci U S A. 2001;98:15003. doi: 10.1073/pnas.211564598. [DOI] [PMC free article] [PubMed] [Google Scholar]
- 104.Laxman B, et al. Proc Natl Acad Sci U S A. 2002;99:16551. doi: 10.1073/pnas.252644499. [DOI] [PMC free article] [PubMed] [Google Scholar]
- 105.Lu J, et al. Biochem Biophys Res Commun. 2007;362:25. doi: 10.1016/j.bbrc.2007.07.145. [DOI] [PubMed] [Google Scholar]
- 106.Mochizuki N, et al. Nature. 2001;411:1065. doi: 10.1038/35082594. [DOI] [PubMed] [Google Scholar]
- 107.Baker BJ, et al. J Neurosci Methods. 2007;161:32. doi: 10.1016/j.jneumeth.2006.10.005. [DOI] [PubMed] [Google Scholar]
- 108.Murata Y, Iwasaki H, Sasaki M, Inaba K, Okamura Y. Nature. 2005;435:1239. doi: 10.1038/nature03650. [DOI] [PubMed] [Google Scholar]
- 109.Dimitrov D, et al. PLoS ONE. 2007;2:e440. doi: 10.1371/journal.pone.0000440. [DOI] [PMC free article] [PubMed] [Google Scholar]
- 110.Chanda B, et al. Nat Neurosci. 2005;8:1619. doi: 10.1038/nn1558. [DOI] [PubMed] [Google Scholar]
- 111.Sjulson L, Miesenbock G. J Neurosci. 2008;28:5582. doi: 10.1523/JNEUROSCI.0055-08.2008. [DOI] [PMC free article] [PubMed] [Google Scholar]
- 112.Lichtman JW, Livet J, Sanes JR. Nat Rev Neurosci. 2008;9:417. doi: 10.1038/nrn2391. [DOI] [PMC free article] [PubMed] [Google Scholar]
- 113.Dalva MB, McClelland AC, Kayser MS. Nat Rev Neurosci. 2007;8:206. doi: 10.1038/nrn2075. [DOI] [PMC free article] [PubMed] [Google Scholar]
- 114.Chen BL, Hall DH, Chklovskii DB. Proc Natl Acad Sci U S A. 2006;103:4723. doi: 10.1073/pnas.0506806103. [DOI] [PMC free article] [PubMed] [Google Scholar]
- 115.White JG, Southgate E, Thomson JN, Brenner S. Philos Trans R Soc Lond B Biol Sci. 1976;275:327. doi: 10.1098/rstb.1976.0086. [DOI] [PubMed] [Google Scholar]
- 116.Cabantous S, Terwilliger TC, Waldo GS. Nat Biotechnol. 2005;23:102. doi: 10.1038/nbt1044. [DOI] [PubMed] [Google Scholar]
- 117.Feinberg EH, et al. Neuron. 2008;57:353. doi: 10.1016/j.neuron.2007.11.030. [DOI] [PubMed] [Google Scholar]
- 118.Livet J, et al. Nature. 2007;450:56. doi: 10.1038/nature06293. [DOI] [PubMed] [Google Scholar]
- 119.Walsh MK, Lichtman JW. Neuron. 2003;37:67. doi: 10.1016/s0896-6273(02)01142-x. [DOI] [PubMed] [Google Scholar]
- 120.Oddo S, et al. Neuron. 2003;39:409. doi: 10.1016/s0896-6273(03)00434-3. [DOI] [PubMed] [Google Scholar]
- 121.Murphy TH, Li P, Betts K, Liu R. J Neurosci. 2008;28:1756. doi: 10.1523/JNEUROSCI.5128-07.2008. [DOI] [PMC free article] [PubMed] [Google Scholar]
- 122.Tian GF, et al. Nat Med. 2005;11:973. doi: 10.1038/nm1277. [DOI] [PMC free article] [PubMed] [Google Scholar]
- 123.Kerschensteiner M, Schwab ME, Lichtman JW, Misgeld T. Nat Med. 2005;11:572. doi: 10.1038/nm1229. [DOI] [PubMed] [Google Scholar]
- 124.Mudher A, et al. Mol Psychiatry. 2004;9:522. doi: 10.1038/sj.mp.4001483. [DOI] [PubMed] [Google Scholar]
- 125.Guo Q, et al. Nat Med. 1999;5:101. doi: 10.1038/4789. [DOI] [PubMed] [Google Scholar]
- 126.Stutzmann GE, et al. J Neurosci. 2006;26:5180. doi: 10.1523/JNEUROSCI.0739-06.2006. [DOI] [PMC free article] [PubMed] [Google Scholar]
- 127.LaFerla FM. Nat Rev Neurosci. 2002;3:862. doi: 10.1038/nrn960. [DOI] [PubMed] [Google Scholar]
- 128.Smith IF, Green KN, LaFerla FM. Cell Calcium. 2005;38:427. doi: 10.1016/j.ceca.2005.06.021. [DOI] [PubMed] [Google Scholar]
- 129.Stutzmann GE, Caccamo A, LaFerla FM, Parker I. J Neurosci. 2004;24:508. doi: 10.1523/JNEUROSCI.4386-03.2004. [DOI] [PMC free article] [PubMed] [Google Scholar]
- 130.Eichhoff G, Busche MA, Garaschuk O. Eur J Nucl Med Mol Imaging. 2008;35(Suppl 1):S99. doi: 10.1007/s00259-007-0709-6. [DOI] [PubMed] [Google Scholar]
- 131.Yasuda R, et al. Sci STKE. 2004;2004:pl5. doi: 10.1126/stke.2192004pl5. [DOI] [PubMed] [Google Scholar]
- 132.Duemani Reddy G, Kelleher K, Fink R, Saggau P. Nat Neurosci. 2008;11:713. doi: 10.1038/nn.2116. [DOI] [PMC free article] [PubMed] [Google Scholar]
- 133.Palmer AE, Tsien RY. Nat Protoc. 2006;1:1057. doi: 10.1038/nprot.2006.172. [DOI] [PubMed] [Google Scholar]