

Abstract
Bowen-Conradi syndrome (BCS) is an autosomal-recessive disorder characterized by severely impaired prenatal and postnatal growth, profound psychomotor retardation, and death in early childhood. Nearly all reported BCS cases have been among Hutterites, with an estimated birth prevalence of 1/355. We previously localized the BCS gene to a 1.9 Mbp interval on human chromosome 12p13.3. The 59 genes in this interval were ranked as candidates for BCS, and 35 of these, including all of the best candidates, were sequenced. We identified variant NM_006331.6:c.400A→G, p.D86G in the 18S ribosome assembly protein EMG1 as the probable cause of BCS. This mutation segregated with disease, was not found in 414 non-Hutterite alleles, and altered a highly conserved aspartic acid (D) residue. A structural model of human EMG1 suggested that the D86 residue formed a salt bridge with arginine 84 that would be disrupted by the glycine (G) substitution. EMG1 mRNA was detected in all human adult and fetal tissues tested. In BCS patient fibroblasts, EMG1 mRNA levels did not differ from those of normal cells, but EMG1 protein was dramatically reduced in comparison to that of normal controls. In mammalian cells, overexpression of EMG1 harboring the D86G mutation decreased the level of soluble EMG1 protein, and in yeast two-hybrid analysis, the D86G substitution increased interaction between EMG1 subunits. These findings suggested that the D-to-G mutation caused aggregation of EMG1, thereby reducing the level of the protein and causing BCS.
Introduction
Bowen-Conradi syndrome (BCS [MIM 211180]) is a lethal autosomal-recessive disorder that was first described in the Hutterite population by Bowen and Conradi.1 As more patients have been assessed, the characteristic phenotype has been further delineated.2 It includes marked prenatal and postnatal growth retardation, microcephaly, a prominent nose with an absent glabellar angle, micrognathia, joint abnormalities including flexion contractures, camptodactyly, rocker-bottom feet, and severe psychomotor delay. Other external abnormalities are rare, and there are very few internal structural malformations. Cerebellar anomalies are not evident in magnetic resonance imaging results, and signs of metaphyseal dysplasia or other skeletal anomalies have not been identified in radiologic studies. In addition, no molecular or metabolic abnormality has been identified thus far. Most patients do not survive beyond the first year of life, as a result of complications associated with reduced mobility and failure to thrive.
To date, virtually all affected babies have been born into Hutterite families. There are, however, at least four published and four unpublished reports of non-Hutterite babies with BCS-compatible features. These include a Russian baby,3 a German baby,4 a Turkish baby,5 two Indian babies,6 and unpublished reports of Pakistani, Brazilian, Ukrainian-Italian, and American (Californian) babies. In all of these cases, either their clinical photographs did not convincingly resemble our BCS patients or inadequate views made it difficult to confirm the diagnosis. In addition, structural, central nervous system, and other malformations seen in these patients (e.g., macrocornea, sclerocornea, cortical hypoplasia in the brain) have not been observed in our patients. The features of BCS also overlap with trisomy 18 syndrome, pseudo-trisomy 18 syndrome, and cerebro-oculo-facial-skeletal syndrome (COFS). Critical differences do exist, but given the rarity of BCS in the non-Hutterite population, making a definitive clinical diagnosis can be problematic.
Among Hutterites of the Canadian Prairies, the birth prevalence of BCS is estimated to be 1/355, predicting a carrier frequency of 1 in 10 in this population.2 The Hutterites are one of the Anabaptist sects, which originated in Southern Tyrol, Austria, in the 16th century. Their history and social structure have been described previously.7,8 In brief, after years of religious persecution, they immigrated to South Dakota in the 1870s and formed three endogamous subdivisions called leuts (Dariusleut, Lehrerleut, and Schmiedeleut). They live on farming colonies located predominantly in the Canadian Prairie Provinces and the U.S. Great Plains and constitute a highly structured population isolate of about 40,000 persons. The ancestry of the majority of the contemporary Hutterite population can be traced to fewer than 100 founders.9 Their increased prevalence of BCS in comparison to that of the general population is most likely due to a founder effect in this closed population with a small number of original ancestors.
In a previous study,10 we used 389 microsatellite markers to perform a genome-wide scan on DNA from 42 Hutterite individuals, representing nine families with at least one child affected with BCS. Given an assumption that all of the Hutterite patients are homozygous for the same mutation inherited from a common ancestor, both homozygosity by descent and linkage analyses were employed, identifying a single region at chromosome band 12p13, containing the BCS locus. With the use of additional markers in the 12p13 region and the incorporation of two additional families with BCS-affected children, the BCS gene region was narrowed to a 3.5 cM region between F8VWF and D12S397, for which all of the affected children are identically homozygous.
Here, we report the identification of a NM_006331.6:c.400A→G, p.D86G defect in the EMG1-encoding gene (MIM 611531) on chromosome 12p13 as the cause of BCS in the Hutterite population. The EMG1 protein, also known as Nep1, has been identified as essential in yeast for the biogenesis of 18S ribosomal RNA and the 40S ribosome, and the D86 residue is completely conserved in all EMG1 orthologs that we have analyzed to date. Using both patient fibroblasts and model systems, we have demonstrated that the D86G mutation alters the EMG1 protein structure and results in reduced EMG1 protein levels in the BCS patients.
Subjects and Methods
Study Subjects
The DNA samples used for identification of the BCS mutation in this study were from BCS patients and their relatives and were obtained as part of the previous study mapping the BCS gene.10 Lymphoblast or fibroblast cell lines from patients were generated as part of that study. Signed informed consent was obtained from all participants. This study was approved by the Health Research Ethics Board at the University of Manitoba. Anonymous control DNA samples were from non-Hutterite Manitobans and individuals from the eastern United States.
Sequencing
For each gene to be sequenced, the coding sequence was amplified by polymerase chain reaction (PCR) with primer pairs at least 30 bp away from each intron-exon junction; exons were amplified together if they were separated by a small intron. The sequences of the oligonucleotide primers used to amplify the exons for each gene are available on request. PCR was performed in a 50 μl volume with the use of Taq polymerase (Invitrogen) in accordance with the manufacturer's instructions. All PCR reactions started with a 5 min denaturation step at 95°C, followed by 30 cycles of 1 min at 95°C, 1 min at the calculated annealing temperature,11 and 2 min at 72°C. At the end of the 30 cycles, a 5 min extension at 72°C was performed. When necessary, PCR conditions were optimized to produce specific products. The PCR products were separated by agarose gel electrophoresis, and the DNA fragments were extracted with a QIAquick Gel Extraction Kit in accordance with the supplier's instructions (QIAGEN). DNA sequencing was performed by The Centre for Applied Genomics, The Hospital for Sick Children, Toronto, Canada, with the use of the same primers that were used for PCR amplification, unless the fragment exceeded a size that allowed for accurate sequencing. In such a case, additional internal primers allowed complete sequencing of the PCR fragment. The DNA sequence was determined for both strands of all fragments.
The coding sequence of EMG1 was amplified as four fragments. Exon 1 was amplified as a 370 bp fragment with forward primer 5′-CATTTCCTGGCCCACTTTC-3′ and reverse primer 5′-CCTCTCTGCTTTCTACATCC-3′ (annealing temperature 56°C). Exons 2 and 3 were amplified together as a 502 bp fragment with forward primer 5′-GGACCACACTTGAAGAACCAC-3′ and reverse primer 5′-TTCTCCCTTTTCCTCTTCCTC-3′ (annealing temperature 60°C), and exons 4 and 5 were amplified together as a 442 bp fragment with forward primer 5′-CCTTGTTCGATGACTGGACAG-3′ and reverse primer 5′-GCATTGTTAAAATGCCTACTGC-3′ (annealing temperature 60°C). Exon 6 was amplified as a 746 bp fragment with forward primer 5′-GTTTTCCTGCCCTAAAGAAGG-3′ and reverse primer 5′-CTCTCCCCATCTAGCCAGG-3′ (annealing temperature 60°C). DNA sequencing of these fragments was performed as described above.
Detection Strategies for APOBEC1 and EMG1 Mutations
The NM_001644.3:c.96G→A, p.W21X mutation in APOBEC1 creates an AvrII site. For detection of the mutation, a 295 bp region of exon 3 was amplified by PCR with forward primer 5′-GGGGAGCAGGAAAAGATTTC-3′ and reverse primer 5′-GGACAAGAACCAGGTGATGG-3′ (annealing temperature 59°C). A 20 μl aliquot of the PCR product was digested with 10 U of AvrII at 37°C for 1.5 hr. The 206 bp and 89 bp products generated in the presence of the c.96A→G mutation samples were separated from the 295 bp product on 10% polyacrylamide gels and visualized with ethidium bromide.
For detection of the c.400A→G, p.D86G mutation in EMG1, a 104 bp region of exon 2-intron 2 was amplified with forward primer 5′-GAAGACATATGAGCTACTCAACTG-3′ and reverse primer 5′-GAGTTACCTGGTGGGTGGTA-3′ (annealing temperature 56°C). The reverse primer contained a single A→G (bolded in oligonucleotide sequence) substitution that introduced a KpnI site into the resulting PCR product only in the presence of the c.400A→G mutation. A 25 μl aliquot of the PCR product was digested with 10 U of KpnI at 37°C for 2 hr. The 82 bp and 22 bp products generated in the presence of the A→G mutation were separated from the undigested 104 bp PCR product onto an 8% polyacrylamide gel and visualized as above.
RNA Analyses
Total RNA was isolated from fibroblasts or lymphoblasts with Trizol Reagent in accordance with the instructions of the manufacturer (Invitrogen). For examination of gene expression in the candidate region, 1 μg of total RNA from patient and control lymphoblasts was reverse transcribed with Omniscript reverse transcriptase, in accordance with the manufacturer's instructions (QIAGEN). For each gene, cDNA was PCR amplified with two sets of forward and reverse primers that were specified to recognize as many of the transcripts of the gene as possible. The primer sequences are available upon request.
RNA blotting analysis of RNA was performed on 7 μg of total fibroblast RNA from two BCS-affected patients and one unaffected control.12 Twenty microliters of RNA samples were mixed with 20 μl of glyoxal loading dye (Ambion) and denatured at 55°C for 30 min. The samples were spun briefly in a centrifuge and immediately loaded onto a 1.2% agarose gel made with 1× tris-borate ethylenediaminetetraacetic acid (EDTA) buffer (TBE buffer). The samples were then separated by gel electrophoresis at 70 V for 2 hr and 30 min in 1× TBE buffer. The RNA was then transferred to the Bright Star positive nylon membrane (Ambion) via the Genie electrophoretic blotter (Idea Scientific) at 12 V for 90 min in 1× TBE buffer in accordance with the manufacturer's instructions. The agarose gel and the nylon membrane were examined under UV light, and both 18S and 28S rRNA positions were marked on the membrane as size markers. The membrane was then UV cross-linked and prehybridized overnight at 68°C with ExpressHyb solution (BD Biosciences). The glyceraldehyde-3-phosphate dehydrogenase (GAPDH) and EMG1 cDNA probes were labeled with 32P (PerkinElmer) to a specific activity of at least 1 × 10⁹ dpm/μg with the Rediprime II DNA labeling system (GE Healthcare) and purified with ProbeQuant G-50 Micro Columns (GE Healthcare). The membrane was incubated overnight at 68°C with 20 ml of fresh ExpressHyb solution containing denatured probe. After hybridization, the membrane was washed with wash solution 1 (2 × SSC [300 mM NaCl, 30 mM sodium citrate], 0.1% sodium dodecyl sulfate [SDS]), followed by wash solution 2 (0.1 × SSC [15 mM NaCl, 1.5 mM sodium citrate], 0.1% SDS), then exposed to BioMAX MS (Kodak) film for 7 hr at −80°C (EMG1) or for 2 hr at room temperature (GAPDH).
The levels of EMG1 mRNA in different human adult and fetal tissues were determined by semiquantitative PCR with the use of Human Multiple Tissue cDNA panels I and II (Clontech Laboratories), in accordance with the manufacturer's instructions. In brief, 5 ng of cDNA from different tissues was amplified by PCR with forward primer 5′-GGCCAGTCTGGAGACAGTCAAAGGTA-3′ and reverse primer 5′-CCCATACTTCCTCAAAGGCTGTGGT-3′, for amplification of EMG1, and with control primers supplied with the cDNA panels, for amplification of GAPDH. All amplifications were performed with Titanium Taq DNA Polymerase (Clontech Laboratories) in a 50 μl volume at 95°C for 1 min, 22–38 cycles at 95°C for 30 s and at 68°C for 3 min, followed by final extension at 68°C for 3 min. Aliquots were collected at different cycle numbers, and the amplified products were separated in a 2% agarose gel and visualized by ethidium bromide staining.
Bioinformatics
Protein orthologs of EMG1 from various species were identified with the use of the yeast Emg1 protein sequence (NP_013287.1) as a query in a BLAST search of the nonredundant protein sequences.13 Protein sequences for human (NP_006322.3), mouse (NP_038564.1), Arabidopsis (NP_191259.1), Plasmodium (XP_679765.1), Drosophila (XP_001355221.1), and Aspergillus (XP_755005.1) orthologs were selected for multiple alignment. In addition, through the performance of a PSI BLAST iteration after the initial BLAST search, a more distantly related ortholog was identified in Sulfolobus (YP_254757.1) and included in the alignment. A multiple alignment of these sequences was performed with ClustalW.14
Comparative Molecular Modeling of Human EMG1
A three-dimensional comparative molecular model of human 18S ribosome assembly protein EMG1 (residues 25–243) was built with the SWISS-MODEL server,15–17 with the use of the 2.0 Å resolution crystal structure of yeast Emg1 monomer (Protein Data Bank [PDB] code 2v3j) as a template. A model of homodimeric human EMG1 was constructed by superimposing the modeled human EMG1 protein onto the homologous subunits of the 2.2 Å resolution crystal structure of homodimeric ribosome biogenesis protein NEP1-like from Methanocaldococcus jannaschii (PDB code 3BBE) with the Dali pairwise comparison server.18 For optimization of the structural geometry, the modeled human EMG1 homodimer was placed in a primitive lattice (P1) and subjected to 1000 steps of conjugate gradient energy minimization, as implemented in the Crystallography and Nuclear magnetic resonance System (CNS) version 1.21.19 Unit cell parameters were set sufficiently large enough that intermolecular contacts were avoided during minimization. The overall quality of the model was assessed with the WHATCHECK20 and PROCHECK21 routines available from the SWISS-MODEL server.15–17 Finally, the 2.0 Å crystallographic structure of yeast Emg1 in complex with the methyl donor substrate S-adenosyl-methionine (SAM) (PDB code 2v3k) was used for placing SAM molecules into the homologous binding sites of the modeled human EMG1 homodimer by superimposing the coordinates of the yeast Emg1:SAM complex onto each of the monomers of the human EMG1 homodimer with the use of the Dali pairwise comparison server.18 S-adenosyl-L-homocysteine (SAH) molecules bound to the ribosome biogenesis protein NEP1-like ortholog from M. jannaschii (PDB code 3BBE) were also placed into the homologous binding sites of modeled human EMG1 homodimer with the use of the Dali pairwise comparison server.18
Vector Construction
Mammalian expression vectors containing the wild-type and D86G-mutated EMG1 cDNA sequences were constructed via a PCR-based strategy. In brief, total RNA isolated from normal or patient fibroblasts was reverse transcribed with Superscript (Invitrogen). The coding sequence was amplified with oligonucleotide primers that added BamHI and XhoI sites onto the 5′ and 3′ ends, respectively. The PCR products were isolated from agarose gels with the use of a QIAquick kit and digested with BamHI and XhoI to generate the 755 bp insert. The fragments were ligated with BamHI- and XhoI-digested pcDNA3.1 (Invitrogen), generating pcDNAEmg1 and pcDNAEmg1-D86G constructs. For the generation of constructs that had an HA tag added to the C terminus of EMG1, these vectors were used as the templates for PCR amplificaton with Phusion polymerase (New England Biolabs) with forward primer 5′-GTGTGGTACCACCATGGCCGCGCCCAGTGATGGATTC-3′ and reverse primer 5′-TGTAGCGGCCGCATGACCCCCCATACTTCCTCAAAGGC-3′ (annealing temperature 65°C). The products were restriction-enzyme digested with KpnI and NotI and cloned into KpnI- and NotI-digested pMH plasmid (Roche Applied Science) for the generation of pMH-EMG1 and pMH-EMG1-D86G plasmids. The full EMG1 coding region was sequenced for confirmation of the presence of only the desired A-to-G substitution in the pMH-EMG1-D86G vector. pRCMVβ-gal was purchased from Invitrogen.
Cell Culture, Transfections, and Protein Isolation
Fibroblasts and baby hamster kidney (BHK) cells were maintained in minimal essential medium (alpha modification) containing 10% fetal bovine serum and 100 U penicillin; 100 μg streptomycin per mL (Invitrogen). Transfections were performed with 4 μg of plasmid DNA per 30 mm dish with the use of Lipofectamine 2000 (Invitrogen), per the manufacturer's specifications. For isolation of soluble and insoluble fractions, cells were collected into 1.5 ml tubes and lysed in a modified radio immunoprecipitation assay (RIPA) buffer (1% tert-Octylphenoxy [poly]oxyethelene ethanol [IGEPAL]; 0.5% sodium deoxycholate; 0.1% SDS; 1.9 mM NaH2PO4; 8.1 mM Na2HPO4; 150 mM NaCl). RIPA-insoluble protein was then separated by centrifugation for 10 min at 10000 × g, the supernatant was removed, and the pellet was resuspended in RIPA buffer and sonicated for 5 s. For isolation of cytoplasmic and nuclear fractions, cells were first lysed in Triton buffer (50 mM Tris pH 7.4; 1 mM EDTA; 150 mM NaCl; 1% Triton) and fractions were then separated by centrifugation at 2000 × g for 10 min. The supernatant was removed, and the pellet was resuspended in nuclear lysis buffer (50 mM Tris pH 7.4; 10 mM EDTA; 1% SDS) and sonicated. All lysis buffers were supplemented with protease inhibitors (SIGMA). The protein concentration was determined with the Bradford (Bio-Rad) or the bicinchoninic acid (Fisher Scientific) assay.
Immunoblot Analysis
Aliquots of the cell lysates (20–25 μg of protein) were separated in a 10% gel by SDS-polyacrylamide gel electrophoresis (SDS-PAGE) and transferred to a nitrocellulose membrane in N-cyclohexyl-3-aminopropanesulfonic acid (CAPS) buffer pH 11 at 100 V for 1 hr at 4°C via a modified method.22 Proteins were detected with an EMG1 antibody or a fibrillarin antibody (both from Aviva Systems Biology), at a dilution of 1:2000, or with an HA tag antibody (Applied Biological Materials), at a dilution of 1:10000, in 5% skim milk powder in Tris-buffered saline Tween (TBST) (20 mM Tris pH 7.4; 0.15 M NaCl; 0.1% Tween). Blots were then washed three times with TBST, incubated with horseradish peroxidase (HRP)-conjugated secondary donkey anti-rabbit or donkey anti-mouse antibody at a dilution of 1:20000, washed, and visualized with Immobilon western chemiluminescent HRP substrate (Millipore).
Yeast Two-Hybrid Analysis
For fusions of human EMG1 with either the Gal4-activation or the DNA-binding domain, the EMG1 coding sequence was amplified by PCR with primers C2fBam5 (5′-GTCAGGATCCTGGCCGCGCCCAGTGATGGATTCAAG-3′) and C2fPst3 (5′-TCAGCTGCAGTCAAATGACCCCCCATACTTCCTCAAAGG-3′), with a fetal heart cDNA library used as a template. The PCR products were digested with BamHI and PstI and inserted into plasmids pGAD424 and pGBT9 (Clontech), resulting in plasmids pGAD424-HsEMG1 and pGBT-HsEMG1. For the introduction of the D86G mutation (GAT→GGT) into these constructed plasmids, site-specific PCR-directed in vitro mutagenesis was performed with primers C2f-D86G-1 (5′-GGAAGCGCGGCCAGGTATCACCCACCAGA-3′) and C2f-D86G-2 (5′-TCTGGTGGGTGATACCTGGCCGCGCTTCCC-3′), resulting in plasmids pGAD424-HsEMG1-D86G and pGBT9-HsEMG1-D86G.
The two hybrid plasmids pGAD and pGBT, containing human EMG1 or EMG1-D86G, were cotransformed into the yeast host strain PJ69-4A (MATa, trp1-901, leu2-3,112, ura3-52, his3-200, Δgal4, Δgal80, ade2::GAL2-ADE2, LYS2::GAL1-HIS3, met2::GAL7-lacZ).23 Reporter gene activation was determined by growth assays on dropout medium lacking histidine or by measurement of β-galactosidase activity.
Results
Characterization of Candidate Genes
The candidate interval bounded by F8VWF and D12S397, based on NCBI Build 36.2, is 1.9 Mbp in size and contains 59 genes that have been demonstrated or predicted to encode proteins (see Table S1, available online).
The expression of the 59 genes in the candidate interval was assessed in order to screen for alterations in the level of a gene transcript(s) that might indicate the presence of a mutation. Total RNA from patient and normal lymphoblasts was reverse transcribed and used as a template for PCR amplification of transcripts from each of the genes. Of the 59 genes, 48 were amplified from total lymphoblast-derived cDNA, and the products were the same size in both normal and BCS lymphoblasts (Table S1). We were unable to amplify cDNA-representing transcripts (no transcript; NT) for six of the genes, and five of the genes were not analyzed (NA) (Table S1) because they had not yet been predicted to exist in the region at the time that the expression analyses were performed. Although no attempt was made to quantify the expression of these genes, there were no obvious differences in the PCR products that would suggest a difference between BCS and normal lymphoblasts. In the absence of any obvious differences in the level or size of the PCR products produced from the transcripts, we moved to sequencing the genes in the candidate interval.
Sequencing of Candidate Genes
The order of priority for sequencing genes in the candidate interval was established by ranking the 59 candidate BCS genes as poor, medium, or good (Table S1) candidates on the basis of published information about their function and previous associations with disease, as well as database information on their expression profile and sequence similarities. In making this assessment, we assumed, because of the clear neurological deficits in BCS patients, that the causative gene would normally be expressed in the brain and would have a vital function. If there was no available information about the function of the gene, it was automatically ranked as a good BCS candidate. The ranking of the genes was reassessed on an ongoing basis, allowing incorporation of new information.
We sequenced all of the 20 genes ranked as good candidates and the 13 genes ranked as medium candidates, as well as two of the 26 genes ranked as poor candidates. The coding sequences and the adjacent intron-exon junctions were sequenced from the DNA of one affected patient, with the assumption that all patients would be homozygous for the identical mutation. The DNA sequence of both strands of all PCR products was determined by direct sequencing, and NT_009759.15 or NT_009714.16 was used as the reference sequence for comparison. We identified 59 known and six novel single-nucleotide polymorphisms (SNPs) in the course of sequencing (Table S1). Only those SNPs at the ends of the interval were analyzed, and they were found to completely segregate with disease (data not shown); we assumed that the remaining SNPs, which were closer to the middle of the interval, would segregate with disease as well. The SNPs identified during sequencing thus could not be used to reduce the minimal BCS interval. We then assessed the potential for each of these SNPs to cause BCS.
Of the 59 known SNPs that were identified, all but six were located within introns or were synonymous changes. These six nonsynonymous changes were considered unlikely to be the cause of BCS, because of their presence in the known SNP database. Also, PLEKHG6 rs740842 (c.251G→A, p.A35T) and DPPA3 rs2024320 (c.229G→C, p.E51Q) were frequently detected in various populations and therefore could not be the cause of BCS. In addition, EMG1 rs17857448 (c.269G→T, p.R42S), and NANOG rs2889552 (c.256C→A, p.A16E) were located in nonconserved regions of these proteins and therefore would be unlikely to cause disease. LEPREL2 rs5705068 (g.6792285_6792286insG) was in the cDNA sequence NM_014262.3 and the alternate contig assembly NW_001838050.1 and is probably an error in the reference contig sequence NT_009759.15. The remaining change, APOBEC1 rs34275479 (c.96G→A, p.W21X), was considered a poor candidate to cause disease, because a mouse knockout of Apobec1 exhibited only a minor change in lipoprotein levels24 and the mutation was found outside the Hutterite population and in five of 414 random alleles tested in our laboratory, again making it unlikely to be the cause of BCS.
The six novel SNPs identified during this study included five that were found within the introns. The remaining SNP, c.400A→G, p.D86G in EMG1 (Figure 1A), destroys an EcoRV site. However, because this method of detection is not specific, we developed an assay in which a KpnI site was created in the presence of the EMG1 mutation (Figure 1B). This mutation completely segregated with disease in the BCS families but was not found in any of 414 alleles examined in DNA samples from non-Hutterites. To further evaluate the EMG1 variation, we looked at the conservation of the D86 residue in orthologs to EMG1. In a multiple alignment of protein sequences derived from distantly related orthologs, including even Sulfolobus, a member of Archaea, D86 was found to be completely conserved. In fact, the D86 residue was found in the most highly conserved region of the EMG1 protein (Figure 1C).
Figure 1.
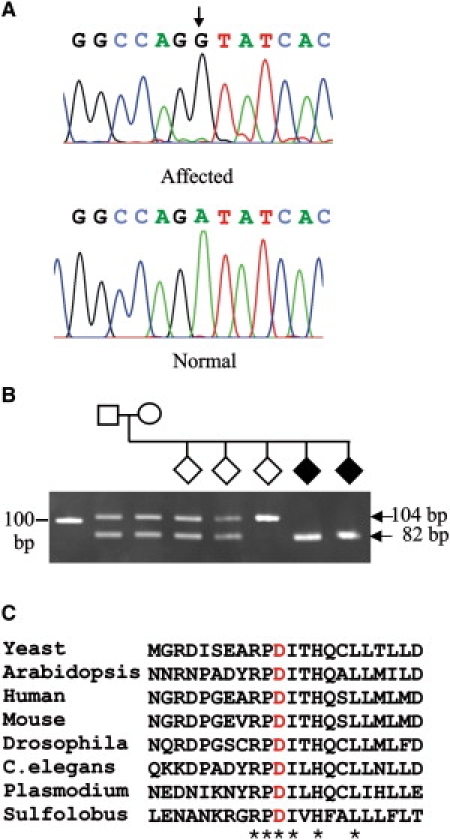
Analysis of the EMG1 Mutation Causing BCS
(A) Sequence chromatograms of a BCS-affected patient (top) and a normal control (bottom). The position of the A→G mutation is indicated by an arrow.
(B) Detection of the c.400A→G mutation in a Hutterite family. The region of EMG1 containing the c.400A→G mutation was amplified by PCR from the DNA samples of a family with BCS-affected children with the use of a primer that created a KpnI site only in the presence of the mutation. The samples were analyzed by agarose gel electrophoresis. The affected children (black diamonds) have only the 82 bp fragment, whereas the parents and two of the siblings are heterozygous for c.400A→G, as indicated by the presence of both 104 bp and 82 bp fragments, and one child is homozygous for normal EMG1, as indicated by the presence of only the 104 bp fragment.
(C) Protein sequence alignment via Clustal W of the region of the EMG1 protein containing the c.400A→G, p.D86G mutation. The residues that are completely conserved in all orthologs are indicated with an asterisk, and the Asp (D) that is mutated in BCS is shown in red.
Modeling of Human EMG1
A comparative molecular model of the human EMG1 protein was built with the SWISS-MODEL server, initially with the use of the crystallographic structure of the yeast Emg1 monomer (PDB code 2v3j) as a template. Human EMG1 is 52% identical (65% similar) to the yeast Emg1 (also known as Nep1), according to BLAST (BLOSUM62 scoring matrix). The highest degree of sequence conservation occurs between residues that make up the core α/β knot fold that is characteristic of SPOUT-class methyltransferases25 and an additional β-α-β insertion that appears unique to Emg1 proteins and may be involved in RNA binding.26,27 This conserved region does not include the N terminus (approximately 24 amino acids); these N-terminal residues are poorly conserved between eukaryotic Emg1 proteins and are absent from their archaeal orthologs.26 Thus, only residues 25–243 of human EMG1 were included in the molecular model. Although demonstrated biochemically, the biological dimer of yeast Emg1 could not be identified in the crystal structure.26 Thus, for the building of a homodimeric model of human EMG1, the modeled monomers of the protein were superimposed onto the homologous monomer positions of the crystal structure of homodimeric ribosome-biogenesis protein NEP1-like from Methanocaldococcus jannaschii (PDB code 3BBE) via the Dali server. Although human EMG1 and M. jannaschii Nep1 share only 29% sequence identity (49% similarity), according to BLAST (BLOSUM62 scoring matrix), the structural folds of these proteins are highly conserved, as indicated by the high Dali Z score of 22.1 and a root mean square deviation (RMSD) of ∼2.1 Å for 181 equivalent α-carbon positions for each monomer. This high degree of structural similarity allowed for the construction of a homodimeric model of human EMG1 with very few bad contacts at the dimer interface, even before energy minimization. Energy minimization easily relieved all steric clashes between side chains within the dimer interface, possibly moving these side chains to positions that would be adopted naturally during dimerization. The final energy-minimized model of dimeric human EMG1 had good stereochemical properties, according to WHATCHECK and PROCHECK. With the use of comparison values typical for a 2.0 Å crystal structure, a Ramachandran plot of the energy-minimized dimer showed that 95.7% of residues had ϕ, ψ angles within core and allowed regions, 2.4% had ϕ, ψ angles within generously allowed regions, and only 1.9% (seven residues) had disallowed ϕ, ψ angles. Residues with disallowed ϕ, ψ angles were found to reside in loop structures on the surface of the model, one of which was not resolved in the crystal structure of yeast Emg1 (residues 56–64 of yeast Emg1). Finally, the binding of methyl donors into the preformed binding pocket of Emg1 proteins was previously found not to induce conformational changes in the proteins.27 In accordance with this finding, the modeled human EMG1 homodimer (Figure 2A) contained preformed binding pockets for methyl donors into which SAM and SAH could be fit without altering the conformations of these substrates from what was determined crystallographically for the yeast Emg1-SAM26 and Nep1-SAH27 complexes. The human EMG1 model clearly showed that D86 formed hydrogen bonds with R84 and therefore stabilized it (Figure 2B). The model also showed that R84 was present in the positively charged RNA-binding groove of the EMG1 dimer (Figure 2C).
Figure 2.
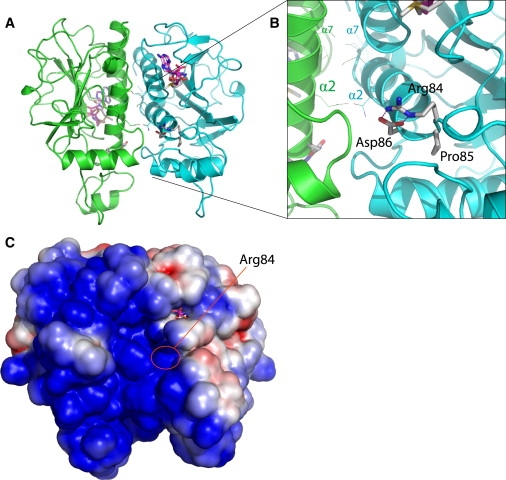
Comparative Molecular Model of the Human EMG1 Homodimer
(A) Ribbon diagram of the modeled homodimer, with the individual monomers colored green and blue. Methyl donors are drawn as sticks.
(B) Close-up view, showing the hydrogen-bonding interactions of D86 with R84 occurring at the N terminus of α helix 2. The two parallel α helices from each monomer (α helices 2 and 7) that form the core of the dimer interface are labeled α2 and α7 for each monomer.
(C) Electrostatic-potential map of the solvent-accessible surface of the human EMG1 homodimer model. The map shows that the model predicts a positively charged region (blue) that is homologous to the RNA-binding groove of Nep1, and R84 is located in the center of this groove. Red indicates a negative charge.
EMG1 Expression
The expression of EMG1 in normal adult tissues was first examined by RNA blot analysis. The primary signal was detected at approximately 1 kb, as expected on the basis of the size of the mRNA identified in human. However, a larger band at approximately 1.7 kb could also be detected on longer exposures (data not shown). Expression was detected in most tissues examined, although the strongest signals were in heart, liver, and stomach, followed by kidney and brain. Given the prominent neurological involvement in BCS, we had expected strong expression in the brain. To determine whether the expression might be greater before birth, we compared the expression of EMG1 in human adult and fetal tissues, using semiquantitative PCR analysis (Figure 3). EMG1 expression was similar or higher in most adult tissues, but in the brain, fetal expression appeared higher than that in the adult.
Figure 3.
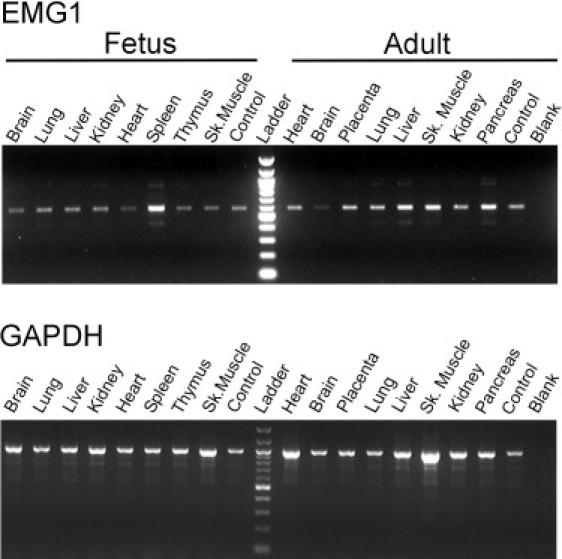
Expression of EMG1 in Adult and Fetal Tissues
Five nanograms of cDNA from various tissues was amplified by PCR with the use of EMG1- (top panel) or GAPDH-specific primers (bottom panel). Samples were taken at different cycle numbers, separated on a 2% agarose gel, and stained with ethidium bromide. The results for the samples taken at 26 cycles are shown for both EMG1 and GAPDH. Control cDNA was provided with each panel, and the PCR reaction was performed in the absence of cDNA for the blank. Each panel was normalized to the expression levels of four housekeeping genes: GAPDH, beta-actin, alpha-tubulin, and phospholipase A2.
Analysis of the Effects of the EMG1 Mutation
As a first step in assessing the effect of the c.400A→G, p.D86G change, we examined the level of EMG1 expression by RNA blot, using total RNA prepared from BCS patient and control fibroblasts. The level of expression was the same in the patient and control fibroblasts (Figure 4A), indicating that the mutation did not have any effect at the RNA level.
Figure 4.
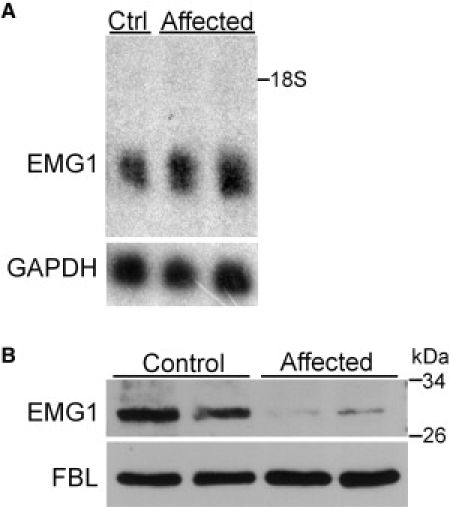
EMG1 mRNA Expression and Protein Levels in Unaffected Control and Patient Fibroblasts
(A) RNA analysis. Seven micrograms of total RNA isolated from unaffected control (Ctrl) fibroblasts or BCS-affected patient fibroblasts were separated on 1.2% agarose gel and transferred to a nylon membrane. The membrane was UV cross-linked and probed with labeled EMG1 (top panel) and GAPDH (bottom panel) cDNA probes. Film was exposed to the membrane for 7 hr at −80°C (EMG1) or for 2 hr at room temperature (GAPDH). EMG1 is 1068 bp and GAPDH is 1310 bp; 18S rRNA position is marked.
(B) Immunoblot analysis of EMG1 protein levels. Twenty-five micrograms of nuclear lysates from unaffected control fibroblasts and BCS-affected patient fibroblasts were separated on a 10% gel by SDS-PAGE, and protein was detected by immunoblot with an EMG1 antibody (top panel). The blot was then stripped and reprobed for fibrillarin (FBL), a nuclear protein, so that equal loading was ensured (bottom panel).
To evaluate the effect of the c.400A→G, p.D86G mutation at the protein level, we compared the endogenous levels of EMG1 in patient and normal fibroblasts. The nuclear fraction of fibroblast lysates was used for protein immunoblotting, because EMG1 is concentrated in the nucleus and was most easily detected by the EMG1 antibody in this fraction (data not shown). The level of EMG1 was found to be dramatically reduced in the BCS-affected patient as compared to normal fibroblasts, although the patient fibroblasts did not have a complete EMG1 deficiency (Figure 4B). Fibrillarin, a nucleolar protein, was used as a loading control.
Determination of the Mechanism of D86G-Induced Alterations
For further assessment of the consequences of the D86G substitution at the protein level, constructs encoding HA-tagged forms of wild-type EMG1 or D86G-containing EMG1, as well as empty vector plasmid as a negative control, were transiently expressed in BHK cells. In this cell line, the level of detectable RIPA-soluble EMG1 protein was much lower when the mutation was present, reflecting the endogenous levels in fibroblasts. However, in the RIPA-insoluble fraction, levels were similar between the wild-type and D86G-containing EMG1, indicating that D86G-containing EMG1 preferentially associates with the insoluble fraction (Figure 5).
Figure 5.
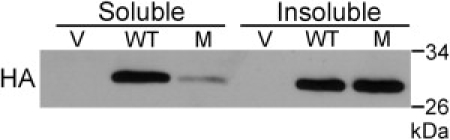
Transient Expression of D86G Mutant and Wild-Type EMG1 in BHK Cells
The RIPA-soluble fraction from BHK cells transiently expressing HA-tagged EMG1 was separated from the insoluble fraction by centrifugation. The insoluble fraction was then resuspended in RIPA, sonicated before loading of approximately 20 μg of protein, and separated in a 10% gel by SDS-PAGE. Protein was then transferred to a nitrocellulose membrane and detected by immunoblot with an HA antibody. Cells were cotransfected with pRCMVβ-gal to serve as a transfection control; loading was therefore corrected for both protein concentration and β-galactosidase activity. Abbreviations are as follows: V, vector control; WT, wild-type protein; M, mutant D86G protein.
Dimerization of EMG1-D86G
The human and the yeast Emg1 proteins strongly interacted with themselves in the yeast two-hybrid system, suggesting that EMG1 functions as a dimer or multimer. With this same system used for examination of the effect of the D86G mutation on interaction of EMG1 subunits, a 10-fold increase in the interaction between the mutant subunits as compared to the wild-type subunits was detected (Figure 6). The increased interaction affinity was indeed due to the D86G mutation, because dimers between the EMG1 wild-type subunit and the D86G mutant subunit had an increased interaction as compared to the dimer between wild-type subunits (Figure 6).
Figure 6.
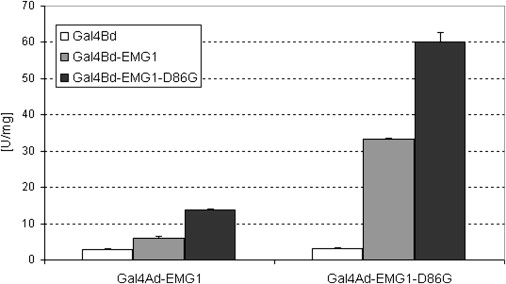
Yeast Two-Hybrid Analysis of Dimerization of EMG1-D86G
Interactions between wild-type EMG1 and the D86G mutant monomers, as well as each monomer with itself, were analyzed in the yeast two-hybrid system. Wild-type and mutant EMG1 were fused to the Gal4-activation or DNA-binding domain and tested against each other by coexpression in the two-hybrid yeast strain PJ69-4A. For quantification of binding affinity, β-galactosidase activity was measured. Data are from two independent yeast clones and the error bars represent standard deviation. A two-tailed, independent t test between Ad-EMG1+BdEMG1 and Ad-EMG1-D86G+Bd-EMG1-D86G showed that β-gal transcriptional activity in the mutant dimer was significantly higher with p = 0.0012.
Discussion
Among Hutterites of the Canadian Prairies, the gene causing BCS is referred to anecdotally as the Hutterite gene, probably because of the severity and high frequency of BCS in this population. This severity, coupled with the profound neurological impairment in BCS patients, suggests that the causative gene has a fundamental function that could affect neurological development. The carrier frequency for BCS is about 1 in 10 in the Hutterites, leading to an incidence of about 1 in 355 live births.2 Given the endogamous and isolated nature of the Hutterite population, we previously postulated that all patients with BCS were homozygous by descent and, therefore, that BCS was caused by a single mutation.10 We then reduced the minimal interval for the disease-causing gene to a 1.9 Mb region on 12p13.3,10 which was gene-rich and included numerous genes that were viewed as good candidates to cause BCS. After sequencing of the candidate genes, 59 known and six novel SNPs were identified (Table S1). Of the known SNPs, all caused synonymous changes, were localized within introns, were detected outside the Hutterite population, or were found in nonconserved regions of the protein. The only novel SNP located in a coding region, c.400A→G in EMG1, segregated completely with disease, caused a nonsynonymous change in a highly conserved region of the protein, and was not found in any of 414 non-Hutterite alleles. Our approach of assuming homozygosity by descent therefore proved to be successful, because all of the BCS patients were homozygous for a 1.9 Mb region, all patients shared the c.400A→G change in EMG1, and this variant was not found in any non-Hutterite controls, supporting our original hypothesis. The identification of a defect in the EMG1 gene that is essential for growth and mitosis in yeast28 was also consistent with our expectation that the gene responsible for BCS would have a fundamental function.
Very little is known about EMG1 in humans, because the function of the EMG1 protein has been investigated only in yeast. The gene is essential in yeast, and through study of the effects of Emg1 deficiency, it has been shown that these yeast have reduced production of 18S rRNA and 40S ribosomes.28,29 Yeast Emg1 is a component of the small subunit (SSU) processome30 and plays an essential role in the biogenesis of the ribosomal 40S subunit. In particular, it aids in the maturation of 18S rRNA, where it is thought to participate in a methylation event, using SAM as a methyl donor.28,29,31 In eukaryotes, synthesis and assembly of the ribosomal subunits is a complicated process involving hundreds of factors. The precursor 35S rRNA must undergo many modifications during maturation into 5.8S, 25S, and 18S rRNA.32 Bioinformatic analysis has identified EMG1 as a member of the SPOUT superfamily of methyltransferases, of which all of the characterized members bind and modify tRNA or rRNA by methylation of the ribose 2′-OH group, guanine N1, or uridine N3.25 It has also been shown to play a role in the removal of snR57, the snoRNA component of the snoRNP responsible for the 2′-OH ribose methylation of G1570 in 18S rRNA, as well as the recruitment of ribosomal protein RPS19 to the maturing ribosome.31 Ribosomal biogenesis and the cell cycle are tightly linked, with a checkpoint at the G1/S boundary ensuring sufficient ribosome levels before cell division.33,34 Notably, depletion of SSU processome components in yeast is known to cause cell-cycle arrest in G1.35 In the absence of EMG1, the cell may therefore be unable to produce sufficient 40S ribosomal subunits to sustain normal proliferation.
In order to better understand the possible effects of a D86G substitution on the structure and function of the protein, we built a model of human EMG1 based on the yeast monomer and the archaebacterial dimer crystal structures. Bioinformatic analysis of the Saccharomyces cerevisiae ortholog of EMG1 identified the yeast equivalent of D86 as a “potentially functionally important” residue.25 Crystal-structure examination of the Methanocaldococcus jannaschii ortholog of EMG1 has also suggested a role for the archaebacterial equivalent of D86. D86 strongly hydrogen bonds arginine (R) 84, another conserved residue, and orients it, allowing it to bind to RNA.27 It has also been shown that mutating the yeast equivalent of R84 severely reduces RNA binding,26,27 providing further evidence of an essential role for D86 in the binding and subsequent modification of the 18S rRNA.
In solution, EMG1 is present as a homodimer26,27 and D86 is positioned near the interface between the two subunits. Two parallel α helices (α2 and α7) form the core of the dimer interface (Figure 2A). D86 is located at the N terminus of α7 and accepts two hydrogen-bonding interactions from R84, rigidly holding this latter residue in position (Figure 2B). Our model suggests multiple reasons that D86G causes functional disruption of human EMG1. First, the R84 ortholog in Nep1 (R54) has been implicated in the RNA-binding activity of this protein.27 The residue is centrally located in a positively charged groove on the Nep1 homodimer, and our model predicted this RNA-binding groove to be present in the human EMG1 homodimer (Figure 2C). Thus, the D86G substitution could disrupt the otherwise rigidly held conformation of R84 and reduce its contribution to RNA binding, a hypothesis that is supported by the finding that an alanine mutation of R88 in yeast Nep1 (R84 in human EMG1) abolishes the ability of Nep1 to bind RNA.27 Second, introduction of a glycine at position 86 of human EMG1 may result in local misfolding of the N terminus of the α7 helix. The high conformational flexibility that would result from the introduction of a glycine in this position could mitigate the stabilizing effect of proline (P) 85, a residue type that has a rigidly constrained ϕ angle and is often found at the beginning of α helices. Although D86 does not appear to participate directly in the dimer interface, local misfolding on the N terminus of the α7 helix could deform the dimerization interface and possibly expose core hydrophobic residues, thereby reducing the ability of the protein to dimerize correctly. This may explain the observed aberrant dimerization in the D86G protein (Figure 6). Incorrect dimerization would also affect the formation of the RNA-binding groove and could potentially reduce protein solubility and stability. This latter hypothesis is supported by our finding that human EMG1 containing the D86G substitution preferentially associated with a RIPA-insoluble fraction when overexpressed in BHK cells (Figure 5). Taken together, these results suggest that D86 is responsible for stabilizing R84, a residue that appears to be important for RNA binding and may be involved in maintaining proper secondary structure that is required for correct dimerization and protein stability.
The human EMG1 model clearly demonstrated a critical role for D86 in maintaining the structure and the function of the protein. Therefore, we examined patient and control fibroblasts to assess whether the defect had an effect on either EMG1 expression or EMG1 protein levels. RNA blot analysis of total fibroblast RNA did not show any difference in EMG1 expression between patients and a control. However, immunoblots created of nuclear extracts from fibroblasts with the use of an EMG1 antibody showed that endogenous EMG1 levels were substantially reduced in BCS patients as compared to those of controls (Figure 4). EMG1 was not detected in the cytoplasmic fraction (data not shown). Thus, the defect caused by the c.400A→G mutation was present not at the RNA level, but at the protein level. Overexpression of HA-tagged EMG1 in BHK cells showed that the D86G protein was preferentially associating with an insoluble fraction (Figure 5). These results may indicate that the D86G EMG1 aggregated, leading to its degradation. In the overexpressing model, it is possible that the rate of overexpression was so high that it overwhelmed the proteasome and therefore allowed us to see the accumulation in the RIPA-insoluble fraction. In the fibroblasts, endogenous EMG1 was expressed at much lower levels, and although D86G EMG1 may have aggregated, the cell was able to degrade it more quickly and the accumulation seen in the BHK cells was not apparent. It is important to note that the D86G substitution causes a partial deficiency of EMG1 in BCS patients. Immunoblots of patient fibroblasts showed that although EMG1 was reduced in comparison to normal controls, protein was still present in the nuclear fraction (Figure 4B). This remaining protein is presumably functional, because a complete deficiency would probably be lethal much earlier on, as indicated by the necessity for Emg1 in yeast. It is possible that the presence of some functional EMG1 in BCS patients allows the assembly of enough ribosomes to promote cell division and proliferation during fetal development but limits neurological development, leading to the CNS symptoms seen in BCS patients.
The notion that EMG1 might play a role in fetal brain development is supported by its expression pattern. PCR with EMG1-specific primers on a semiquantitative multiple-tissue cDNA panel showed that the gene is ubiquitously expressed. However, it appeared to be decreased in the adult brain in comparison to the fetal brain (Figure 3), which may indicate a role for EMG1 in neurological development. This feature of a broadly expressed gene having a cell-type-specific phenotype is not unique among ribosomal proteins. Mutations in the mouse Rps19 and Rps20 ribosomal ssu proteins, which play a role in pigmentation, cause different phenotypic outcomes depending on cell type. The mutations also have opposite effects during embryogenesis and postnatal development.36 Further investigation is for the determination of EMG1's role in specific cell types and at different stages of development.
The association of defects in ribosomal RNA synthesis with human disease is not new, although there is at present no single unifying factor linking them clinically. The ribosomal biogenesis diseases vary in phenotype, mode of inheritance, and severity. Patients with Diamond-Blackfan anemia (DBA [MIM 105650]), Shwachman-Diamond syndrome (SDS [MIM 260400]), dyskeratosis congenita (DC [MIM 305000]), and cartilage-hair hypoplasia (CHH [MIM 250250]), all of which are caused by defects in genes related to ribosome biogenesis, display bone marrow failure (reviewed in 37). This feature has not been observed in Treacher Collins syndrome (TCS [MIM 154500]), a disease implicating rDNA transcription,38 or in BCS. Mode of inheritance varies as well: for example, TCS is autosomal dominant, whereas DC is X-linked recessive, in contrast with BCS, which is autosomal recessive. It is interesting to note that 25% of patients with DBA carry mutations in the gene encoding RPS19,39 the ribosomal protein also implicated in the function of EMG1.31 Although the two diseases do share some features, such as craniofacial abnormalities and mental retardation, DBA is extremely variable, the same mutation frequently being associated with varying degrees of severity of the disease.40 It will be interesting to more closely compare the phenotype and natural history of BCS with other disorders resulting from defects in ribosome biogenesis, but this has not been done to date, because the babies with BCS largely have succumbed at a very early age or have been cared for at home and thus have not been systematically available for long-term followup.
Our finding that D86G EMG1 causes BCS will have an immediate impact on the Hutterite population, because accurate carrier testing and prenatal diagnosis for individuals at risk can now be offered. Whether BCS exists outside the Hutterite population is yet to be determined. We have analyzed the coding sequence of EMG1 in four non-Hutterite patients that had some similarities to patients with BCS, but no mutations were found. In the case individuals for whom enough material was available and the parents were known to be consanguineous, we were also able to demonstrate that they were not homozygous in the 12p13 region, suggesting that these cases have a different molecular basis (data not shown). Nonetheless, it is possible that other disease-causing mutations exist within EMG1, resulting in similar phenotypes. Disorders such as pseudo-trisomy 18 mimic BCS, both within the Hutterite population and in other communities, and EMG1 gene testing will assist in the workup of patients with this phenotype. In the long term, EMG1 studies will help us to better understand the pathogenesis of BCS and other ribosomal biogenesis diseases. The finding that EMG1 is only partially deficient in BCS patients is encouraging for the possibility of a future treatment for the disease.
Supplemental Data
Supplemental Data include one table and are available with this article online at http://www.ajhg.org/.
Supplemental Data
Web Resources
The URLs for data presented herein are as follows:
NCBI SNP database, http://www.ncbi.nlm.nih.gov/SNP/
Online Mendelian Inheritance in Man (OMIM), http://www.ncbi.nlm.nih.gov/omim/
Acknowledgments
We are especially grateful to the families for their participation in this research study. We also thank Roberta Butturini, Cynthia Curry, Michael Innes, Shubha Phadke, Sergio Pena, and Emma Wakeling, who were involved in identifying and screening non-Hutterite patients for possible BCS. This work was supported by a grant from the Manitoba Institute for Child Health to The Centre for the Investigation of Genetic Disease and grant, MOP-62786 from the Canadian Institutes of Health Research (to C.R.G., B.T.R., K.W., and T.Z.). Financial support from the Winnipeg Rh Institute Foundation (to T.Z.) is greatly appreciated. Research was conducted with the use of facilities of the Manitoba Institute of Child Health in the John Buhler Research Centre. R.L. was supported by a studentship from the Manitoba Institute of Child Health. J.A. was supported by graduate studentships from the Manitoba Health Research Council and the Canadian Institutes of Health Research.
References
- 1.Bowen P., Conradi G.J. Syndrome of skeletal and genitourinary anomalies with unusual facies and failure to thrive in Hutterite sibs. Birth Defects Orig. Artic. Ser. 1976;12:101–108. [PubMed] [Google Scholar]
- 2.Lowry R.B., Innes A.M., Bernier F.P., McLeod D.R., Greenberg C.R., Chudley A.E., Chodirker B., Marles S.L., Crumley M.J., Loredo-Osti J.C. Bowen-Conradi syndrome: A clinical and genetic study. Am. J. Med. Genet. A. 2003;120:423–428. doi: 10.1002/ajmg.a.20059. [DOI] [PubMed] [Google Scholar]
- 3.Beemer F.A., Gerards L.J. [A newborn infant with the Bowen-Conradi syndrome; a fatal hereditary disorder] Tijdschr. Kindergeneeskd. 1982;50:54–57. [PubMed] [Google Scholar]
- 4.Kato R. [Hutterite syndrome, Bowen-Conradi type] Ryoikibetsu Shokogun Shirizu. 2001;33:825. [PubMed] [Google Scholar]
- 5.Aynaci F.M., Mocan H., Erduran E., Gedik Y. Hypospadias as a new congenital anomaly in Bowen-Conradi syndrome. Genet. Couns. 1994;5:369–371. [PubMed] [Google Scholar]
- 6.Gupta A., Phadke S.R. Bowen-Conradi syndrome in an Indian infant: First non Hutterite case. Clin. Dysmorphol. 2001;10:155–156. doi: 10.1097/00019605-200104000-00016. [DOI] [PubMed] [Google Scholar]
- 7.Hostetler J.A. History and relevance of the Hutterite population for genetic studies. Am. J. Med. Genet. 1985;22:453–462. doi: 10.1002/ajmg.1320220303. [DOI] [PubMed] [Google Scholar]
- 8.Hostetler J., Huntington G.E. Harcourt Brace College Publishers; Fort Worth: 1996. The Hutterites in North America. [Google Scholar]
- 9.Mange A.P. Growth and inbreeding of a human isolate. Hum. Biol. 1964;36:104–133. [PubMed] [Google Scholar]
- 10.Lamont R.E., Loredo-Osti J., Roslin N.M., Mauthe J., Coghlan G., Nylen E., Frappier D., Innes A.M., Lemire E.G., Lowry R.B. A locus for Bowen-Conradi syndrome maps to chromosome region 12p13.3. Am. J. Med. Genet. A. 2005;132:136–143. doi: 10.1002/ajmg.a.30420. [DOI] [PubMed] [Google Scholar]
- 11.Wu D.Y., Ugozzoli L., Pal B.K., Qian J., Wallace R.B. The effect of temperature and oligonucleotide primer length on the specificity and efficiency of amplification by the polymerase chain reaction. DNA Cell Biol. 1991;10:233–238. doi: 10.1089/dna.1991.10.233. [DOI] [PubMed] [Google Scholar]
- 12.Kevil C.G., Walsh L., Laroux F.S., Kalogeris T., Grisham M.B., Alexander J.S. An improved, rapid Northern protocol. Biochem. Biophys. Res. Commun. 1997;238:277–279. doi: 10.1006/bbrc.1997.7284. [DOI] [PubMed] [Google Scholar]
- 13.Altschul S.F., Gish W., Miller W., Myers E.W., Lipman D.J. Basic local alignment search tool. J. Mol. Biol. 1990;215:403–410. doi: 10.1016/S0022-2836(05)80360-2. [DOI] [PubMed] [Google Scholar]
- 14.Thompson J.D., Higgins D.G., Gibson T.J. CLUSTAL W: Improving the sensitivity of progressive multiple sequence alignment through sequence weighting, position-specific gap penalties and weight matrix choice. Nucleic Acids Res. 1994;22:4673–4680. doi: 10.1093/nar/22.22.4673. [DOI] [PMC free article] [PubMed] [Google Scholar]
- 15.Arnold K., Bordoli L., Kopp J., Schwede T. The SWISS-MODEL workspace: A web-based environment for protein structure homology modelling. Bioinformatics. 2006;22:195–201. doi: 10.1093/bioinformatics/bti770. [DOI] [PubMed] [Google Scholar]
- 16.Guex N., Peitsch M.C. SWISS-MODEL and the Swiss-PdbViewer: An environment for comparative protein modeling. Electrophoresis. 1997;18:2714–2723. doi: 10.1002/elps.1150181505. [DOI] [PubMed] [Google Scholar]
- 17.Kopp J., Schwede T. The SWISS-MODEL Repository: New features and functionalities. Nucleic Acids Res. 2006;34:D315–D318. doi: 10.1093/nar/gkj056. [DOI] [PMC free article] [PubMed] [Google Scholar]
- 18.Holm L., Park J. DaliLite workbench for protein structure comparison. Bioinformatics. 2000;16:566–567. doi: 10.1093/bioinformatics/16.6.566. [DOI] [PubMed] [Google Scholar]
- 19.Brunger A.T., Adams P.D., Clore G.M., DeLano W.L., Gros P., Grosse-Kunstleve R.W., Jiang J.S., Kuszewski J., Nilges M., Pannu N.S. Crystallography & NMR system: A new software suite for macromolecular structure determination. Acta Crystallogr. D Biol. Crystallogr. 1998;54:905–921. doi: 10.1107/s0907444998003254. [DOI] [PubMed] [Google Scholar]
- 20.Hooft R.W., Vriend G., Sander C., Abola E.E. Errors in protein structures. Nature. 1996;381:272. doi: 10.1038/381272a0. [DOI] [PubMed] [Google Scholar]
- 21.Laskowski R.A., MacArthur M.W., Moss D.S., Thornton J.M. PROCHECK: A program to check the stereochemical quality of protein structure coordinates. J. Appl. Cryst. 1993;26:283–291. [Google Scholar]
- 22.Towbin H., Staehelin T., Gordon J. Electrophoretic transfer of proteins from polyacrylamide gels to nitrocellulose sheets: Procedure and some applications. 1979. Biotechnology. 1992;24:145–149. [PubMed] [Google Scholar]
- 23.James P., Halladay J., Craig E.A. Genomic libraries and a host strain designed for highly efficient two-hybrid selection in yeast. Genetics. 1996;144:1425–1436. doi: 10.1093/genetics/144.4.1425. [DOI] [PMC free article] [PubMed] [Google Scholar]
- 24.Nakamuta M., Chang B.H., Zsigmond E., Kobayashi K., Lei H., Ishida B.Y., Oka K., Li E., Chan L. Complete phenotypic characterization of apobec-1 knockout mice with a wild-type genetic background and a human apolipoprotein B transgenic background, and restoration of apolipoprotein B mRNA editing by somatic gene transfer of Apobec-1. J. Biol. Chem. 1996;271:25981–25988. doi: 10.1074/jbc.271.42.25981. [DOI] [PubMed] [Google Scholar]
- 25.Tkaczuk K.L., Dunin-Horkawicz S., Purta E., Bujnicki J.M. Structural and evolutionary bioinformatics of the SPOUT superfamily of methyltransferases. BMC Bioinformatics. 2007;8:73. doi: 10.1186/1471-2105-8-73. [DOI] [PMC free article] [PubMed] [Google Scholar]
- 26.Leulliot N., Bohnsack M.T., Graille M., Tollervey D., Van T.H. The yeast ribosome synthesis factor Emg1 is a novel member of the superfamily of alpha/beta knot fold methyltransferases. Nucleic Acids Res. 2008;36:629–639. doi: 10.1093/nar/gkm1074. [DOI] [PMC free article] [PubMed] [Google Scholar]
- 27.Taylor A.B., Meyer B., Leal B.Z., Kotter P., Schirf V., Demeler B., Hart P.J., Entian K.D., Wohnert J. The crystal structure of Nep1 reveals an extended SPOUT-class methyltransferase fold and a pre-organized SAM-binding site. Nucleic Acids Res. 2008;36:1542–1554. doi: 10.1093/nar/gkm1172. [DOI] [PMC free article] [PubMed] [Google Scholar]
- 28.Liu P.C., Thiele D.J. Novel stress-responsive genes EMG1 and NOP14 encode conserved, interacting proteins required for 40S ribosome biogenesis. Mol. Biol. Cell. 2001;12:3644–3657. doi: 10.1091/mbc.12.11.3644. [DOI] [PMC free article] [PubMed] [Google Scholar]
- 29.Eschrich D., Buchhaupt M., Kotter P., Entian K.D. Nep1p (Emg1p), a novel protein conserved in eukaryotes and archaea, is involved in ribosome biogenesis. Curr. Genet. 2002;40:326–338. doi: 10.1007/s00294-001-0269-4. [DOI] [PubMed] [Google Scholar]
- 30.Bernstein K.A., Gallagher J.E., Mitchell B.M., Granneman S., Baserga S.J. The small-subunit processome is a ribosome assembly intermediate. Eukaryot. Cell. 2004;3:1619–1626. doi: 10.1128/EC.3.6.1619-1626.2004. [DOI] [PMC free article] [PubMed] [Google Scholar]
- 31.Buchhaupt M., Meyer B., Kotter P., Entian K.D. Genetic evidence for 18S rRNA binding and an Rps19p assembly function of yeast nucleolar protein Nep1p. Mol. Genet. Genomics. 2006;276:273–284. doi: 10.1007/s00438-006-0132-x. [DOI] [PubMed] [Google Scholar]
- 32.Fromont-Racine M., Senger B., Saveanu C., Fasiolo F. Ribosome assembly in eukaryotes. Gene. 2003;313:17–42. doi: 10.1016/s0378-1119(03)00629-2. [DOI] [PubMed] [Google Scholar]
- 33.Bernstein K.A., Bleichert F., Bean J.M., Cross F.R., Baserga S.J. Ribosome biogenesis is sensed at the Start cell cycle checkpoint. Mol. Biol. Cell. 2007;18:953–964. doi: 10.1091/mbc.E06-06-0512. [DOI] [PMC free article] [PubMed] [Google Scholar]
- 34.Dez C., Tollervey D. Ribosome synthesis meets the cell cycle. Curr. Opin. Microbiol. 2004;7:631–637. doi: 10.1016/j.mib.2004.10.007. [DOI] [PubMed] [Google Scholar]
- 35.Bernstein K.A., Baserga S.J. The small subunit processome is required for cell cycle progression at G1. Mol. Biol. Cell. 2004;15:5038–5046. doi: 10.1091/mbc.E04-06-0515. [DOI] [PMC free article] [PubMed] [Google Scholar]
- 36.McGowan K.A., Li J.Z., Park C.Y., Beaudry V., Tabor H.K., Sabnis A.J., Zhang W., Fuchs H., de Angelis M.H., Myers R.M. Ribosomal mutations cause p53-mediated dark skin and pleiotropic effects. Nat. Genet. 2008;40:963–970. doi: 10.1038/ng.188. [DOI] [PMC free article] [PubMed] [Google Scholar]
- 37.Liu J.M., Ellis S.R. Ribosomes and marrow failure: Coincidental association or molecular paradigm? Blood. 2006;107:4583–4588. doi: 10.1182/blood-2005-12-4831. [DOI] [PubMed] [Google Scholar]
- 38.Dixon J., Trainor P., Dixon M.J. Treacher Collins syndrome. Orthod. Craniofac. Res. 2007;10:88–95. doi: 10.1111/j.1601-6343.2007.00388.x. [DOI] [PubMed] [Google Scholar]
- 39.Draptchinskaia N., Gustavsson P., Andersson B., Pettersson M., Willig T.N., Dianzani I., Ball S., Tchernia G., Klar J., Matsson H. The gene encoding ribosomal protein S19 is mutated in Diamond-Blackfan anaemia. Nat. Genet. 1999;21:169–175. doi: 10.1038/5951. [DOI] [PubMed] [Google Scholar]
- 40.Campagnoli M.F., Ramenghi U., Armiraglio M., Quarello P., Garelli E., Carando A., Avondo F., Pavesi E., Fribourg S., Gleizes P.E. RPS19 mutations in patients with Diamond-Blackfan anemia. Hum. Mutat. 2008;29:911–920. doi: 10.1002/humu.20752. [DOI] [PubMed] [Google Scholar]
Associated Data
This section collects any data citations, data availability statements, or supplementary materials included in this article.