

Abstract
This protocol describes a cell/hydrogel molding method for precise and reproducible biomimetic fabrication of three-dimensional (3D) muscle tissue architectures in vitro. Using a high aspect ratio soft lithography technique, we fabricate polydimethylsiloxane (PDMS) molds containing arrays of mesoscopic posts with defined size, elongation and spacing. On cell/hydrogel molding, these posts serve to enhance the diffusion of nutrients to cells by introducing elliptical pores in the cell-laden hydrogels and to guide local 3D cell alignment by governing the spatial pattern of mechanical tension. Instead of ultraviolet or chemical cross-linking, this method utilizes natural hydrogel polymerization and topographically constrained cell-mediated gel compaction to create the desired 3D tissue structures. We apply this method to fabricate several square centimeter large, few hundred micron-thick bioartificial muscle tissues composed of viable, dense, uniformly aligned and highly differentiated cardiac or skeletal muscle fibers. The protocol takes 4–5 d to fabricate PDMS molds followed by 2 weeks of cell culture.
Introduction
Tissue engineering technology classically combines living cells and biomaterials with the primary goal of creating functional tissue substitutes for the repair of diseased and damaged organs1. This technology is also utilized to generate biomimetic three-dimensional (3D) tissue culture systems for fundamental studies of cell–matrix interactions2, tissue morphogenesis3,4 and structure–function relationships5. A 3D tissue culture environment allows individual cells to assume a shape and exhibit matrix adhesions that are more in vivo-like than those formed in a two-dimensional (2D) environment2. Furthermore, compared with conventional 2D cultures in a large extracellular bath, dense 3D cultures with confined extracellular space can amplify local autocrine and paracrine actions of cells6 and, in addition, directly affect the function of electrically active tissues, such as nerve and muscle7,8.
3D bioartificial muscle tissues
The physiological and pathophysiological functions of various tissues in the body are critically dependent on the particular spatial arrangement of cells as well as the extracellular matrix in 3D (ref. 9). For example, native skeletal muscle contains long parallel muscle bundles composed of densely packed and highly aligned myofibers. This anisotropic tissue structure directly determines the contractile force and passive mechanical stiffness of the muscle10. Similarly, efficient pumping of the heart relies on the spatially and temporally coordinated electromechanical activity that is uniquely governed by the specialized intercellular connections11 and complex 3D alignment of cardiac fibers and sheets12,13. To be able to study these intricate 3D structure–function relationships in vitro or to restore native function in vivo, bioartificial muscle tissues need to contain a relatively large volume of densely packed, differentiated muscle fibers that can be locally aligned in desired directions using well-controlled and reproducible methodologies.
Aligning one or two muscle cell layers can be readily achieved by a number of techniques that use parallel microgrooves14,15, electrospun micro- and nano-fibers16,17, micropatterned protein lines18–20 or mechanical stretch16,21. In contrast, creating uniform 3D cell alignment of many muscle cell layers over a large area is considerably harder to achieve. One potential approach is to manipulate a polymer scaffold microstructure to provide topographical cues for orienting 3D cell growth. We, for example, utilized sucrose leaching techniques to fabricate poly(lactic-co-glycolic) acid scaffolds with oriented pores that guided the 3D alignment of cardiac cells over few square cm area5. Others used laser-drilled poly(glycerol sebacate) membranes22 or collagen matrices with oriented pores23 to achieve similar results. Despite the relatively simple fabrication processes, the use of anisotropic polymer scaffolds for the formation of thick and aligned 3D bioartificial muscle tissues is suboptimal because (1) the polymer phase represents an obstacle to dense and spatially continuous muscle cell growth, (2) no methods exist to precisely vary the local cell alignment and tissue thickness by controlling the polymer scaffold structure, (3) the rigidity of the polymer scaffold may prevent or dampen the macroscopic contractions of bioartificial muscle and (4) eventual biodegradation of the polymer may adversely affect the established cellular alignment.
Use of hydrogels in muscle tissue engineering
In comparison with polymer scaffolds, naturally derived hydrogels (e.g., collagen, fibrin) have several properties that make them well-suited for the engineering of functional muscle tissues, including: (1) rapid polymerization that enables spatially uniform cell seeding, (2) significant compaction that yields high cell density, (3) abundant cell attachment sites that facilitate cell spreading and (4) high mechanical compliance that permits macroscopic tissue contractions and allows the application of tensile forces to align cells in 3D (refs. 24,25). Thus far, muscle cells in hydrogel systems have been aligned by constraining cell growth to one direction using a bundle or ring geometry24,26–29. These and similar methods for fabricating pseudo-1D muscle geometries are unsuitable for the generation of larger and more complex muscle tissue structures in which cell alignment needs to be varied in a controllable manner over different spatial scales.
However, approaches that utilize photolithographic patterning of hydrogels enable a relatively fast layer-by-layer assembly of cells into free-standing 3D structures with controllable geometry and size30. These methods mainly utilize synthetic31 or modified natural hydrogels32, both of which possess limited ability to support muscle cell spreading and growth. In addition, the use of photosensitive cross-linkers and ultraviolet radiation for hydrogel polymerization may adversely affect the viability, proliferation and differentiation of embedded cells33,34. As muscle cells significantly compact natural hydrogels and undergo spontaneous contractions in culture, a hydrogel-based methodology for the fabrication of bioartificial muscle tissues should provide robust mechanical support for cell growth and function, while allowing cell-mediated hydrogel remodeling to occur without a loss in 3D cell alignment.
Mesoscopic hydrogel molding for engineering of bioartificial muscle
Here we present details of a hydrogel molding method developed in our laboratory35 (Fig. 1a) to fabricate relatively large and thick muscle tissue constructs in which 3D tissue geometry and local muscle fiber alignments can be precisely varied. Specifically, a high aspect ratio (height/width of 5–10) soft lithography technique has been optimized to create polydimethylsiloxane (PDMS) tissue molds containing an array of elongated, mesoscopic-sized posts with typical dimensions of 1.2 mm × 0.2 mm × 1.5 mm (length × width × height). These posts are one to two orders of magnitude taller (up to 2.5 mm) than the photolithographic features typically used in microfluidic36 and other biological applications37. A mixture of muscle cells and fibrin gel is then cultured for two weeks in the PDMS molds to create a muscle sheet with elliptical pores formed around the posts. Through cell-mediated gel compaction and anchoring at the ends of the posts, a strain field is formed within the hydrogel that guides local 3D cell alignments along the pore boundaries. The pores serve to increase the diffusion of oxygen and nutrients to embedded cells, allowing the formation of 100- to 400-μm-thick, dense and viable muscle tissues. The PDMS molds are reusable, thereby allowing the reproducible fabrication of a large number of identical 3D tissue replicas.
Figure 1.

Fabrication of bioartificial muscle tissue constructs. (a) The SU-8 photoresist-coated silicon wafer was exposed to UV light through (b) a predesigned photomask. Scale bar, 2 mm (inset, 500 μm). (c) Optical profile of the resulting master wafer. (d) Negative replica PDMS mold cast off the master wafer. Scale bar, 1 mm. (inset: vertical cross-section, scale bar, 500 μm). (e) PDMS tissue mold cast off the negative replica PDMS. Scale bar, 1 mm (inset: vertical cross-section, scale bar, 500 μm). Note the high aspect ratio and mesoscopic size of the PDMS posts. (f) Cell–hydrogel solution was injected into the PDMS tissue mold using a micropipetteand incubated at 37 °C to allow (g) hydrogel polymerization and (h) submerged in culture medium for a 2-week culture. A pinned Velcro frame served as an anchor for hydrogel. Scale bars in f–h, 5 mm.
As we have previously shown, this approach enables 3D alignment of muscle cells over a relatively large area (>1 cm2) and the design of complex tissue geometries, such as abrupt changes in muscle fiber orientation35. The natural enzymatic action of thrombin on fibrinogen38 during hydrogel polymerization has no adverse effects on embedded cells. The abundant cell adhesion sites present in fibrin gel facilitate the interaction between the cells and the extracellular matrix (ECM), and, subsequently, the structural and biochemical remodeling of the ECM by the cells. The facilitated ECM remodeling, along with the topographical and mechanical cues provided by the PDMS mold, guide the proper 3D assembly and integration of cells into a functional, aligned bioartificial muscle tissue. Long-term spontaneous contractions of differentiated muscle fibers are adequately supported by the relatively high compliance of fibrin gel39. In contrast, collagen gel-based tissues made using this method disintegrate during long-term culture due to vigorous tissue contractions35. In the case of noncontractile tissues, such as engineered tendon nets made by molding smooth muscle cells and collagen gel around 3 mm × 3 mm square posts, the resulting tissue structure can be stable for 6–8 weeks40.
Importantly, the computer-aided design of photomasks used to fabricate the template wafers enables precise variations in tissue mold parameters, such as overall mold dimensions, post height, length, width, orientation and spacing, which in turn determine the resulting tissue size, thickness, porosity, local and overall myofiber alignment as well as the dimensions of the formed muscle bundles. In addition, the resulting tissue properties are also determined in a highly complex manner using the characteristics of cell–gel mixture. Therefore, precise fabrication of a desired tissue structure currently requires that appropriate dimensions of the tissue mold are determined empirically. Accurate control of tissue structures based solely on the mold dimensions will necessitate the development of advanced computer models that robustly predict the process of cell-mediated gel compaction using realistic descriptions of cell proliferation, differentiation, cell–cell and cell–matrix interactions41.
Potential applications of the methodology
As this method provides precise control of the engineered 3D tissue structure, it could be applied to construct planar in vitro analogues of various muscle architectures found in vivo. In particular, the computer-aided design of tissue molds using structural data from native muscle, as obtained using a variety of modern imaging modalities (e.g., diffusion tensor magnetic resonance imaging42, CT scanning43), would allow the design of more realistic muscle tissue structures. By incorporating different cell types and applying genetic and pharmacological manipulations, this methodology would allow systematic studies of the individual and combined roles of 3D structure, cellular composition and gene and protein expression in muscle development, physiology and pathology. Our ongoing study is focused on applying this method to create functional, differentiated skeletal and cardiac muscle tissues starting from stem cell-derived myogenic progenitor cells. Stacking multiple stem cell-derived muscle tissues in vitro31 or during implantation44 to form a thicker and stronger bioartificial muscle patch may eventually enable the application of this methodology to the burgeoning field of regenerative medicine.
Experimental design
Photolithographic patterning of high aspect ratio mesoscopic features
A protocol based on the standard UV photolithography techniques has been developed to create well-defined, high aspect ratio photoresist features. Multiple layers of SU-8 photoresist are spin-coated on a master silicon wafer to a final thickness of up to 2.5 mm. After extensive soft-baking to remove residual solvent, the template is patterned by selective exposure to ultraviolet light through a transparency photomask (Fig. 1b). The resulting photoresist features typically have a width of no less than 0.2 mm and a height-to-width aspect ratio between 5:1 and 10:1 (Fig. 1c). Creating taller and higher aspect ratio features has not been possible using this protocol. The use of X-ray lithography45 is recommended if this is to be attempted.
Replication of photoresist features in PDMS elastomer
PDMS tissue molds replicating the high aspect ratio photoresist features of the patterned master wafer are created using a double-casting method46. A negative replica PDMS template (Fig. 1d) is first molded off the master wafer and then silanized to make it nonadhesive to further application of PDMS. The silanized template is then used to mold a final set of PDMS structures (Fig. 1e) that can be directly utilized as tissue molds. One advantage of using the double-casting method is that one master wafer can be used to create several negative replica PDMS templates, each of which can be used to generate a large number of identical tissue molds, which in turn can be reused multiple times for the tissue culture. The relatively fragile master wafer is thus protected from being damaged by frequent use. As PDMS elastomer can be cast with sub-0.1-μm fidelity47, all PDMS tissue molds have dimensions virtually identical to those of the original master wafer.
Molding of cell–hydrogel tissue networks
PDMS tissue molds are rendered hydrophilic by oxygen plasma treatment and coated with 0.2% (wt/vol) solution of pluronic F-127 to prevent hydrogel adhesion. AVelcro frame is pinned within the tissue mold (Fig. 1f) to anchor the hydrogel. The frame provides mechanical tension during gel compaction as well as facilitates handling and transfer of the resulting tissue constructs. A mixture of fibrin gel, Matrigel and muscle cells is then polymerized within the PDMS molds at 37 °C (Fig. 1g). The hydrogel-containing PDMS molds are immersed in culture medium (Fig. 1h) and cultured in static conditions for 2 weeks to allow the formation of viable, dense and aligned bioartificial muscle tissues.
Materials
Reagents
Mold fabrication
Sulfuric acid (95–98% (vol/vol), ACS grade) (Sigma, cat. no. 258105)
 Highly hazardous in case of skin or eye contact, ingestion or inhalation. Handle with care under a chemical hood.
Hydrogen peroxide (30% (vol/vol) solution, ACS grade) (VWR, cat. no.JT2186)
Corrosive and an oxidizer. Handle with care under a chemical hood. Avoid inhalation and contact with skin or eyes.Deionized water.
SU-8 100 photoresist (Microchem)
Polypropylene glycol monomethyl ether acetate (PGMEA) (Aldrich, cat. no. 537543)
Toxic. Handle with care under a chemical hood.Isopropyl alcohol (EMD chemicals, cat. no. PX1830)
(Tridecafluoro-1,1,2,2-tetrahydrooctyl)-1-trichlorosilane (United Chemical Technologies, cat. no. T2492) referred to below as ‘silane’
Highly corrosive. Avoid inhalation and contact with skin or eyes.PDMS base and curing agent (Sylgard 184, Dow Corning)
Dow Corning 200 Fluid 20 Cst (Dow Corning)
Hydrogel patterning and cell culture
Fibrinogen from bovine plasma (Sigma, cat. no. F4753)
Thrombin from bovine plasma (Sigma, cat. no. T6200)
Matrigel (BD Biosciences, cat. no. 356234)
Pluronic F-127 (Invitrogen, cat. no. P6867)
70% (vol/vol) Ethanol
Tissue culture water (Sigma, cat. no. W3500)
Powder DMEM (Gibco, cat. no. 31600034)
Liquid 1× DMEM (Gibco, cat. no. 10567)
Penicillin–streptomycin (Gibco, cat. no. 15140)
Gentamicin (Gibco, cat. no. 15750)
Penicillin G potassium salt (Sigma, cat. no. P7794)
Fetal bovine serum (Gibco, cat. no. 16000-044)
Heat-inactivated horse serum (Hyclone, cat. no. SH30074)
Chicken embryo extract (US Biologicals, cat. no. C3999)
Aminocaproic acid (Sigma, cat. no. A7824)
Trypsin (US Biologicals, cat. no. 22715)
Collagenase Type 2 (Worthington, cat. no. LS004176)
Histological analysis
1 × Dulbecco's phosphate buffered saline (DPBS) without CaCl2 and MgCl2 (Gibco, cat. no. 14190)
Tissue-Tek Optimal Cutting Temperature (O.C.T.) compound (Electron Microscopy Sciences, cat. no. 62550-01)
16% (wt/vol) Paraformaldehyde (Electron Microscopy Sciences, cat. no. 15710)
Methanol (ACS grade) (EMD Chemicals, cat. no. MX0485)
Acetone (VWR, cat. no. BDH2002)
Triton X-100 (Sigma, cat. no. X100)
Fluoromount G (Electron Microscopy Sciences, cat. no. 17984-25)
Chicken serum (Sigma, cat. no. C5405)
Rabbit polyclonal anti-myogenin (Santa Cruz, cat. no. sc-576)
Mouse monoclonal anti-α-actinin (sarcomeric) (Sigma, cat. no. A7811)
Rabbit polyclonal anti-connexin 43 (Cx 43) (Zymed, cat. no. 71-0700)
Mouse monoclonal anti-vimentin (Sigma, cat. no. V6630)
Alexa Fluor 488/594 chicken anti-mouse IgG (Invitrogen, cat. no.A21200/21201)
Alexa Fluor 488/594 chicken anti-rabbit IgG (Invitrogen, cat. no. A21441/21422)
4′,6-Diamidino-2-phenylindole dihydrochloride (DAPI) (Sigma, cat. no.D9542)
Phalloidin, fluorescein isothiocyanate (FITC) labeled (Sigma, cat. no. P5282)
Equipment
Mold fabrication
Silicon wafers (3″ diameter) (Wafer World, cat. no. 1182)
6″ digital caliper (Carrera Precision, cat. no. CP5906)
Nontissue culture treated Petri dishes, 60 mm (BD Falcon, cat. no. 351007) and 100 mm in diameter (BD Falcon, cat. no. 351029)
Fine needles (27 gauge) (BD, cat. no. 305109)
Wafer tweezers (SPI Supplies, cat. no. 0S4WF-XD)
Cutting pliers
Spin-coater (PWM32, Headway Research)
Programmable hotplate (PMC DataPlate 720 series Barnstead International)
Photoplotted transparency photomasks (prepared by Advanced Reproductions from CAD files provided by the user)
Glass plate (6″ × 6″ × 0.08″ square) (United Scientific)
Mask aligner with UV illuminator (Karl Suss MA6/BA6, Suss Microtec)
Vacuum desiccator (SPI Supplies, cat. no. 01922-AB)
Chemical fume hood
Hydrogel patterning and cell culture
6- or 12-well tissue culture-treated plates (sterile) (BD Falcon, cat. no. 353046 or 353043)
Eppendorf tubes (autoclaved) (Eppendorf, cat. no. 2236320-4)
Velcro tapes (Velcro)
Surgical scissors (Fine Science Tools)
Minute pins (Fine Science Tools, cat. no. 26002-20)
Plasma asher (K-1050X, Emitech)
Stereomicroscope (SM-4T, AmScope)
Sonicator (1510, Branson)
CO2 water-jacketed incubator (Nuaire)
Biosafety cabinet
Histological analysis
Cryostat (HM505E, Microm)
Tissue-Tek cryomolds (15 mm × 15 mm × 5 mm) (Electron Microscopy Sciences, cat. no. 4566)
Superfrost plus micro slides (VWR, cat. no. 48311-703)
22 mm × 22 mm glass coverslips (Electron Microscopy Sciences, cat.no. 72198-10)
Upright and inverted confocal microscopes (LSM 510, Zeiss)
Inverted microscope (TE-2000U, Nikon)
Reagent Setup
1× cardiac culture medium (sterile). Composition: DMEM, 10% (vol/vol) heat-inactivated horse serum, 2% (vol/vol) chicken embryo extract, 100 U ml−1 penicillin G and 1 mg ml−1 aminocaproic acid.
 All media can be stored at 4 °C for up to 2 weeks. Note that culture media contain the only source of calcium ions that are required for fibrin gelation. The mixed cell–gel solution that is injected into tissue molds contains a final calcium concentration of 1.8 mM.
2× cardiac culture medium (sterile) for making cell–hydrogel mixture. Contains 2× DMEM (made from powder DMEM), 20% (vol/vol) heat-inactivated horse serum, 4% (vol/vol) chicken embryo extract and 200 U ml−1 penicillin G
1× skeletal myoblast growth medium (sterile). Contains DMEM, 10% (vol/vol) fetal bovine serum, 50 U ml−1 penicillin G, 50 μg ml−1 streptomycin, 5 μg ml−1 gentamicin and 1 mg ml−1 aminocaproic acid.
2× skeletal myoblast growth medium (sterile) for making cell–hydrogel mixture. Contains 2× DMEM (made from powder DMEM), 20% (vol/vol) fetal bovine serum, 100 U ml−1 penicillin G, 100 μg ml−1 streptomycin and 10 μg ml−1 gentamicin.
Skeletal myoblast differentiation medium (sterile). Contains DMEM, 3% (vol/vol) horse serum, 50 U ml−1 penicillin G, 50 μg ml−1 streptomycin, 5 μg ml−1 gentamicin and 1 mg ml−1 aminocaproic acid.
Matrigel: Prepare 100 μl aliquots, store at −20 °C.
Fibrinogen: Prepare 10 mg ml−1 stock solution in DPBS (containing no Ca2+) by dissolving at 37 °C, and store at 4 °C.
Thrombin: Prepare 50 U ml−1 stock solution in 0.1% (wt/vol) bovine serum albumin (BSA) in DPBS (containing no Ca2+), store 50 μl aliquots at −20 °C.
Cell preparation: neonatal rat ventricular myocytes (NRVMs). Dissociate NRVMs from the ventricles of 2-d-old Sprague–Dawley rats using trypsin and collagenase. Resuspend in 1 × cardiac culture medium (further details can be found in refs. 48,49). Apply one 45-min differential preplating step to enrich the fraction of cardiac myocytes.
Cell preparation: neonatal rat skeletal myoblasts (NRSKMs). Dissociate NRSKMs from the hind limbs of 2-d-old Sparague–Dawley rats using collagenase. Resuspend in 1 × skeletal myblast growth medium. Further details can be found in ref. 35. Apply two sequential 45-min preplatings to enrich the fraction of skeletal myoblasts.
Procedure
Preparation of silicon wafers
-
1
Place a programmable hotplate inside a fume hood and heat to 80 °C.
-
2
To improve photoresist adhesion, ‘Piranha Etch’ silicon wafers to remove traces of carbon residue. In the chemical fume hood, at room temperature (25 °C), prepare 200 ml Piranha Etching solution by pouring 150 ml of concentrated sulfuric acid into a clean beaker followed by 50 ml of hydrogen peroxide. Strong effervescence should be observed.
Piranha Etch will rapidly corrode almost all carbon-based compounds including any exposed skin. Please exercise caution and use appropriate safety equipment such as nitrile or rubber gloves, lab coat and safety goggles. -
3
Place the beaker of Piranha Etching solution on the hotplate.
-
4
Using a wafer tweezer, gently submerge up to 4 silicon wafers into the Piranha Etching solution. For maximum effectiveness, place silicon wafers back-to-back and submerge two wafers at a time. Allow to etch for 15 min.
-
5
Using a wafer tweezer, carefully remove the wafers from the Piranha Etching solution and wash sequentially in two large (1 liter) volumes of deionized water. Air-dry each wafer.
-
6
Dispose of the Piranha Etching solution according to the laboratory safety guidelines.
 Piranha-etched wafers can be stored for several months at room temperature in clean covered Petri dishes until needed.
 -
7
Reset the hotplate to 200 °C and place the etched silicon wafers on the hotplate face-up. Dehydrate the wafers for 10 min. Let cool to room temperature (25 °C).
 Silicon wafers need to be dehydrated before use to maximize the adhesion of photoresist.
Preparation of photoresist layer
-
8
Place the dehydrated silicon wafer on a clean sheet of aluminum foil and pour 2–3 ml SU-8 100.
-
9
Spin-coat SU-8 100 using the following protocol at room temperature. First ramp up to 500 rpm at 100 rpm s−1, maintain for 10 s. Then ramp up to 1,000 rpm at 300 rpm s−1, maintain for 30 s. Finally ramp down to 0 rpm at 300 rpm s−1. This will result in a 250 μm thick photoresist layer.
-
10
Soft-bake the wafer on a hotplate at 65 °C for 15 min, followed by maintenance at 95 °C for 2 h.
-
11
Turn off the hotplate and cool the wafer and hotplate to room temperature.
-
12
For taller features (up to 2.5 mm), layer SU-8 100 sequentially by reiterating Steps 8–11.
-
13
On spin-coating the final layer onto the wafer, carry out a final, longer soft-bake at 95 °C for at least 10 h (or overnight).
-
14
Turn off the hotplate and cool the wafer and hotplate to room temperature. The thickness of the photoresist layer can be estimated using a caliper. The photoresist layer should be hard, and no indentations should be left by the tweezers or caliper.

Aligning and exposing photoresist layer
-
15
Tape the transparency photomasks to a glass plate (6″ × 6″ square). Tape semi-circular pieces of aluminum foil to cover all areas of the wafer not covered by the photomasks (Fig. 2a). Load the glass photomask and a photoresist-coated wafer into the mask aligner and align them to be in the center of the wafer.
-
16
Expose the wafers using 365 nm UV light at 12 mW cm−2. To prevent overheating of the photoresist, the exposure should be carried out in 1-min steps interrupted by 2-min breaks for a total exposure duration as specified in Table 1.
Use UV-safe glasses or a face shield when working with strong UV light sources.
Figure 2.
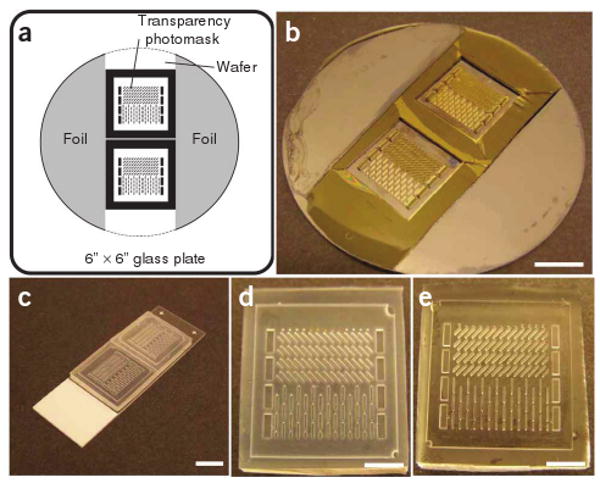
Fabrication of PDMS tissue molds. (a) Schematics of the position of two photomasks and aluminum foil on the glass plate. Dashed line shows the desired position of the wafer. (b) A resulting SU-8 master wafer (after Step 21). Scale bar, 1 cm. (c) Silanized negative PDMS templates cast off the SU-8 master (after Step 27). Scale bar, 1 cm. (d) A close-up view of a silanized negative PDMS template. Scale bar, 5 mm. (e) A close-up view of a resulting PDMS tissue mold cast off the negative PDMS template (after Step 31). Scale bar, 5 mm. Note that this specific PDMS mold has two adjacent areas with an abrupt change in the post direction.
TABLE 1.
Exposure times that have been empirically found to produce stable photoresist features with no lift-off during PGMEA development.
| Feature height (mm) | Total exposure time (min) |
|---|---|
| 1.0 | 6 |
| 1.2 | 8 |
| 1.5 | 12 |
| 2.0 | 24 |
PGMEA, polypropylene glycol monomethyl ether acetate.
Postexposure bake and development
-
17
Perform postexposure bake (PEB) by placing the exposed wafer on a programmable hotplate set to 40 °C for at least 24 h. This long duration, low-temperature PEB allows the photoresist to cross-link while minimizing the diffusion of photo-crosslinker through the resin, thus maintaining high feature fidelity.
-
18
Let the wafer cool by ramping down the temperature at 10 °C h to room temperature. This slow cooling prevents cracks in the wafer, as cross-linked SU-8 exerts significant stress on the silicon substrate due to differential expansion and contraction.
-
19
Immerse the wafer in PGMEA developer overnight.
-
20
Discard the used developer and immerse the wafer in fresh PGMEA for another hour.
-
21
Rinse the wafer with isopropyl alcohol and air-dry.
If a white residue is seen during the wash with isopropyl alcohol, the development is incomplete. Let the wafer develop for another 1–2 h. The SU-8 master (Fig. 2b) is now complete, and can be stored for several months at room temperature under clean, dry conditions.
Casting negative PDMS templates
-
22
Silanize the SU-8 master under vacuum overnight by placing it in a vacuum desiccator, in the presence of two microscope slides containing approximately 500 μl of silane.
Silane is highly corrosive. Wear gloves and use glass transfer pipettes, not plastic pipettes. Avoid inhalation of silane vapors when opening the vacuum desiccator. -
23
Prepare 20 g of PDMS solution by mixing PDMS base, PDMS curing agent and Dow Corning 200 Fluid in a 10:1:1 ratio. Degas for 1 h in a vacuum desiccator.
-
24
Place the SU-8 master face-up in a clean, nontissue culture-treated 100-mm diameter Petri dish and pour approximately 35 ml PDMS on top of the template wafer. The wafer should be completely submerged in PDMS. Degas for 1 h in a vacuum desiccator. Remove the trapped air bubbles using fine needle (27 G).
-
25
Cure PDMS in an oven at 80 °C for at least 4 h.
-
26
Let PDMS cool to room temperature and then carefully break the edges of the Petri dish with a pair of cutting pliers. Remove the shards of the Petri dish and then gently peel the resulting negative replica PDMS template from the template wafer.
The relatively fragile master wafer can be readily damaged at this point. Exercise great caution when subjecting the wafer to stress. -
27
Cut the PDMS template down to the patterned areas of interest. Place the PDMS template face-up on a clean glass slide and silanize as described in Step 22. At this point, the transparent PDMS template should become more opaque (Fig. 2c,d).
The PDMS templates (Fig. 2d) can be stored for several months at room temperature under clean, dry conditions.
Casting PDMS tissue molds
-
28
Prepare 35 g of PDMS solution as described in Step 23.
-
29
Place the silanized PDMS template in a clean, nontissue culture-treated 60-mm Petri dish and add approximately 15 ml prepared PDMS solution. The PDMS template should be completely submerged in PDMS solution, producing the base of the PDMS mold.
-
30
Use fine needles (27 G) to carefully remove air bubbles from the void spaces in the PDMS template and transfer to a vacuum desiccator to degas for 1 h.
It is very important that all air bubbles be removed from the void spaces in the PDMS master so that they can be filled with PDMS. Bubbles can be easily detected visually because of their refractive effect, which is distinct from the filled void spaces. -
31
Cure PDMS and peel it off the template as explained in Steps 25 and 26.
Resulting PDMS tissue molds (Fig. 2e) can be stored for several months at room temperature under clean, dry conditions.
Preparation of PDMS tissue molds for cell–hydrogel molding
-
32
Place PDMS molds in the plasma asher and set the power to 100 W.
-
33
Plasma-treat under oxygen for 1 min.
-
34
Remove the PDMS molds from the plasma asher and immerse them in deionized water.
The PDMS molds need to be made hydrophilic to allow filling with the cell–hydrogel solution. The plasma-treated PDMS molds can be stored in deionized water for up to 2 weeks at room temperature under clean conditions. -
35
Cut Velcro tape into a square frame and pin it to the base of the PDMS mold. The Velcro frame is typically 0.5 mm thick and 2 mm wide on each side. The Velcro frame should be in contact with the PDMS base at all points along its perimeter. Use a minimum of four pins (as depicted in Fig. 1f) to ensure that contact is achieved.
-
36
Immerse the PDMS molds with the pinned Velcro frames in a clean 100-mm Petri dish filled with 70% (vol/vol) ethanol and leave it exposed to UV in a biological hood overnight.
-
37
Rinse PDMS molds with tissue culture water twice and dry with a nitrogen gun.
Perform Steps 37–39 in a biological hood to keep the PDMS mold sterile. -
38
Immerse the sterilized PDMS molds in 0.2% (wt/vol) pluronic solution for 1 h. The coating with pluronic solution will prevent the adhesion of hydrogel to the PDMS molds.
-
39
Rinse and store the PDMS molds in sterile tissue culture grade water.
The PDMS molds can be stored in sterile tissue culture grade water for up to 24 h at room temperature in a biological hood before cell-hydrogel molding.
Molding of cell-hydrogel mixture
-
40
Prepare cells for culture using one of our previously published cell isolation protocols35,48,49.
Perform Steps 40, 43-48 in a biological hood to maintain sterility. -
41
Place 2× cardiac culture medium or 2× skeletal myoblast growth medium, Matrigel, fibrinogen (10 mg ml−1) and thrombin (50 U ml−1) stock solutions on ice.
-
42
Calculate the volume of each ingredient in the cell-hydrogel mixture.
Define V as the total volume of cell-hydrogel mixture. Use 2 mg ml−1 hydrogel as the working concentration of fibrinogen. Use 0.4 unit of thrombin per mg fibrinogen to initiate the fibrin gel polymerization.
Calculate V = volume of cell-hydrogel mixture per mold × number of molds (≤4).
For a mold with dimensions of 20 mm × 20 mm × 1.5 mm (length × width × height), the volume of cell/hydrogel mixture is 500 μl. The rapid cross-linking of the fibrinogen by thrombin limits the maximum number of molds that can be consecutively filled with the same cell-hydrogel mixture at room temperature to 4.
-
Volume of fibrinogen solution:
Vfibriogen = V × 2 mg ml−1 / 10 mg ml−1 = 0.2 V
-
Volume of 2× medium:
V2×medium = Vfibriogen = 0.2 V
-
Volume of Matrigel:
VMatrigel = 10% × V= 0.1 V
-
Volume of thrombin:
Vthrombin = (V × 2 mg ml−1 × 0.4U mg−1) / 50 U ml−1 = 0.016 V
-
Volume of cell solution in 1× medium:
Vcells = V − Vfibriogen − V2×medium − VMatrigel − Vthrombin = 0.484 V
-
-
43
Prepare hydrogel mixture by adding 2× medium, Matrigel and fibrinogen solutions in an Eppendorf tube on ice.
-
44
Re-suspend centrifuged NRVM and NRSKM pellets in their corresponding 1× culture media to obtain total volumes of 0.484 V. Add cell solution into the hydrogel mixture on ice and gently mix.
-
45
Dry PDMS molds with nitrogen and place them in the wells of a 6- or 12-well tissue culture plate.
-
46
Add thrombin into the cell-hydrogel mixture to initiate polymerization. Quickly inject the cell-hydrogel mixture into PDMS molds using a pipette under a stereomicroscope.
At the specified thrombin concentration, fibrin gel polymerizes within 10-15 min at room temperature and 30-40 min on ice. Injecting the cell-hydrogel mixture in a liquid state is critical for forming a uniform distribution of cells on molding. -
47
Add several drops of culture medium next to the mold in each well to provide moisture and place the tissue culture plate with molds in an incubator (37 °C, 5% CO2) for 45 min.
-
48
Gently add culture medium in each well until PDMS molds are fully immersed. Place the plate back in the incubator for long-term culture.
Tissue culture
-
49
Change the culture medium every other day. For NRSKMs, switch from growth medium to differentiation medium on culture day 4 to promote the fusion of myoblasts into myotubes. Perform the step in a biological hood.
Assessment of engineered muscle tissues
-
50
The resulting muscle tissue constructs can be structurally assessed at various time points during culture using the following options: option A, analysis of cell alignment; option B, immunohistological assessment of cellular content, differentiation and connectivity; and option C, assessment of cross-sectional cell distribution.
(A) Analysis of cell alignment
Immerse the molds with tissue constructs in a tissue culture plate containing DPBS for 10 min. Repeat the step two additional times using fresh DPBS solution.
Incubate tissue constructs in 4% (wt/vol) paraformaldehyde at 4 °C for 2 h.
Rinse tissue constructs as described in Step 50A(i).
Incubate tissue constructs in 0.5% (vol/vol) Triton X-100 in DPBS at room temperature for 30 min.
Rinse tissue constructs as described in Step 50A(i).
Incubate tissue constructs in a blocking solution (20% (vol/vol) chicken serum and 1% (wt/vol) BSA in DPBS) at room temperature for 2 h.
Rinse tissue constructs as described in Step 50A(i).
Incubate tissue constructs with FITC-labeled phalloidin (50 μg ml−1 in DPBS) in low light at room temperature for 2 h.
-
Rinse tissue constructs as described in Step 50A(i). Keep the stained constructs covered to avoid exposure to light.
The stained tissue constructs can be stored in DPBS for 1 week at 4 °C before imaging. -
Image tissue constructs while they are in the tissue molds at ×5 magnification using an upright confocal microscope. Phalloidin staining allows visualization of filamentous actin in the cells.
Analyze the confocal fluorescence images using an intensity gradient algorithm adapted from Karlon et al.50 written in Matlab19. Obtain a cell orientation vector in each 50 μm × 50 μm subregion. Plot the histogram showing the angle distribution of all orientation vectors. Calculate the mean angle and the s.d. of all the angles. Use the s.d. value as a quantitative measure of the degree of cell alignment.
(B) Immunostaining of tissue constructs
Immerse the molds with tissue constructs in a tissue culture plate containing DPBS for 10 min. Repeat the step two additional times using fresh DPBS solution.
Fix tissue constructs. If staining for myogenin or vimentin, incubate tissue constructs in 4% (wt/vol) paraformaldehyde (PFA) at 4 °C for 2 h. If staining for connexin 43, incubate tissue constructs in 50% methanol/50% acetone (vol/vol) at room temperature for 10 min. Choose either method of fixing if staining for sarcomeric α-actinin.
Rinse tissue constructs as described in Step 50B(i).
If fixing was carried out using PFA in Step 50B(ii), incubate tissue constructs in 0.5% (vol/vol) Triton X-100 in DPBS at room temperature for 30 min. Otherwise, proceed to Step 50B(v).
Rinse tissue constructs as described in Step 50B(i).
Incubate tissue constructs in a blocking solution (20% (vol/vol) chicken serum and 1% (wt/vol) BSA in DPBS) at room temperature for 2 h.
Rinse tissue constructs as described in Step 50B(i).
Incubate tissue constructs in primary antibodies (1% (vol/vol) solution in DPBS) at 4 °C overnight.
Rinse tissue constructs as described in Step 50B(i).
Incubate tissue constructs with fluorophore-conjugated secondary antibodies (0.5% (vol/vol) solution in DPBS) and nuclear stain DAPI (100 μg ml−1 in DPBS) at room temperature for 2 h, covered by aluminum foil.
Rinse tissue constructs as described in Step 50B(i). Cover the stained constructs with aluminum foil to avoid exposure to light.
-
In dark conditions, gently remove tissue constructs attached to Velcro frame from the PDMS molds using forceps and immerse in DPBS. Use surgical scissors to separate tissue constructs from Velcro frames. Keep tissue constructs in DPBS when cutting.
The hydrogel-based tissue constructs without Velcro frames collapse in air, so it is important to always handle tissues in DPBS. In dark conditions, place a drop of Fluoromount G solution on a glass slide and carefully transfer the tissue constructs cut out of the Velcro frames onto the Fluoromount G drop. Gently place a glass coverslip on top. Leave the mounted tissue constructs covered and away from light at room temperature overnight.
-
Seal the edges of the glass coverslip using nail polish.
The mounted tissue constructs can be stored for 1 week at 4 °C in dark and dry conditions before imaging. -
Image the stained and mounted tissue constructs at ×40 magnification using an inverted confocal microscope to visualize the cells.
(C) Assessment of cross-sectional cell distribution
Immerse the molds with tissue constructs in a tissue culture plate containing DPBS for 10 min. Repeat the step for additional two times using fresh DPBS solution.
Fix tissue constructs in 4% (wt/vol) paraformaldehyde at 4 °C for 2 h.
Rinse tissue constructs as in Step 50C(i).
Cut one side of the Velcro frame using surgical scissors. Fill two-thirds of the volume in cryomolds with the Tissue-Tek O.C.T. compound. Transfer tissue constructs with the Velcro frame onto the O.C.T. compound. Use a pair of tweezers to position tissue constructs within the O.C.T. compound.
Place cryomolds on dry ice until O.C.T. compound becomes translucent. Fill the rest of the volume in cryomolds with O.C.T. compound. Leave cryomolds on dry ice until O.C.T. compound becomes opaque and solid.
-
Remove the frozen block from the cryomold and mount it on the cryostat. Start sectioning from the side without the Velcro frame. When the Velcro frame is visible, cut the mounted block using a scalpel to remove the two parallel sides of the frame. Collect 20-μm thick sections on superfrost plus slides.
Although the Velcro frame facilitates tissue embedding, it needs to be removed during sectioning to allow smooth passage of the blade that yields intact sections. The slides with cryosections can be stored for 1-2 weeks at 4 °C before staining. Rinse slides with DPBS thrice, leaving them immersed in DPBS for 5 min during each rinse.
Permeabilize cells in 0.1% (vol/vol) Triton X-100 in DPBS for 10 min.
Rinse sections as described in Step 50C(vii).
Incubate slides in a blocking solution (20% (vol/vol) chicken serum and 1% (wt/vol) BSA in DPBS) at room temperature for 1 h.
Rinse the sections as described in Step 50C(vii).
Incubate in primary antibodies (1% (vol/vol) solution in DPBS) at room temperature for 1 h.
Rinse the sections as described in Step 50C(vii).
Incubate in fluorophore-conjugated secondary antibodies (0.5% (vol/vol) solution in DPBS) and nuclear stain DAPI (100 μg ml−1 in DPBS) in dark at room temperature for 1 h.
Rinse the sections as described in Step 50C(vii).
Gently place a drop of Fluoromount G on the stained sections followed by a glass coverslip on top. Leave the mounted slides in dark at room temperature overnight.
-
Seal the edges of the glass coverslip with nail polish.
Mounted sections can be stored for 1-2 weeks at 4 °C under dark and dry conditions before imaging. Image the stained sections at ×20 or ×40 magnification using an inverted confocal microscope to assess the cross-sectional cell distribution.
![]()
Steps 1-7, preparation of silicon wafers: 1 h
Steps 8-14, preparation of photoresist layer: 24-36 h
Steps 15 and 16, aligning and exposing photoresist layer: 30 min-1 h
Steps 17–21, postexposure bake and development: 40-48 h
Steps 22–27, casting negative replica PDMS templates: 5 h
Steps 28–31, casting PDMS tissue molds: 5 h
Steps 32–39, preparation of PDMS molds for cell-hydrogel patterning: 14 h
Steps 40–48, patterning of cell–hydrogel mixture: isolation of NRSKMs, 4 h; isolation of NRVMs, 20 h; preparation of cell–hydrogel mixture, 30 min; injection of cell-hydrogel mixture into molds, 5 min per mold × the number of molds; incubation, 45 min.
Step 49, tissue culture: 2 weeks.
Structural assessment of engineered muscle tissues:
Step 50A: analysis of cell alignment: (ii) fixation, 2 h; (iv) permeabilization 30 min; (vi) blocking, 2 h; (viii) incubation with phalloidin, 2 h; (i, iii, v, vii, ix) total washing time 2.5 h; (x, xi) imaging and analysis, 1 h per construct.
Step 50B: immunostaining of tissue constructs: (ii) fixation, 2 h (with PFA) or 10 min (with methanol/acetone); (iv) permeabilization 30 min; (vi) blocking, 2 h; (viii) incubation in primary antibodies, 12 h; (x) incubation in secondary antibodies, 2 h; (i, iii, v, vii, ix, xi) total rinsing time 3 h; (xii-xiv) mounting, 10 h; (xv) imaging, 30 min per construct.
Step 50C: assessment of cross-sectional cell distribution: (ii) fixation, 2 h; (iv-vi) cryosectioning 2 h; (viii) permeabilization 10 min; (x) blocking, 1 h; (xii) incubation in primary antibodies, 1 h; (xiv) incubation in secondary antibodies, 1 h; (i, iii, vii, ix, xi, xiii, xv) total rinsing time 1.5 h; (xvi, xvii) mounting, 10 h; (xviii) imaging, 30 min per slide.
![]()
Troubleshooting advice can be found in Table 2.
TABLE 2.
Troubleshooting table.
| Step | Problem | Possible reason | Solution |
|---|---|---|---|
| 14 | Photoresist thickness is inconsistent | The hotplate is inadequately leveled | Level the hotplate before soft baking the SU-8 |
| Photoresist is too soft | The soft bake time is insufficient | Increase the soft bake time by 2–5 h | |
| 21 | Features lift off silicon substrate on development | The total exposure time is insufficient | Increase the total exposure time by 20–50% |
| Features appear malformed—usually elliptical in shape instead of rectangular | The soft bake time is insufficient, leading to retention of solvent in the photoresist and diffusion of the cross-linker | Use a longer soft bake time | |
| The wafer is heated excessively during UV exposure or postexposure bake | Reduce the duration of each exposure, increase the cool-off interval between exposures and ensure that the wafer is baked at the appropriate temperature | ||
| 46 | Cell–hydrogel solution does not readily fill the PDMS mold during injection | Plasma treatment is insufficient to render the PDMS mold fully hydrophilic | Increase the time of plasma treatment |
| Cell–hydrogel mixture is partially polymerized as the time between adding thrombin and injection is too long | Decrease the number of molds to be filled by the same cell–hydrogel mixture | ||
| 48 | Cell–hydrogel mixture in the mold disintegrates on the addition of culture medium | Thrombin is not mixed well within the cell–hydrogel solution to produce uniform cross-linking of fibrinogen. Incomplete mixing may also result in an uneven distribution of calcium ions, potentially creating points of weakness in the gel | Pipette up and down an increased number of times after adding thrombin into the cell–hydrogel solution to ensure adequate mixing |
| 49 | The formed NRSKM bundles disintegrate 1 or 2 days after the onset of spontaneous twitching | The working concentration of fibrinogen (2 mg ml−1) is too low to withstand the contractions of the differentiated myotubes | Increase the concentration of fibrinogen up to 4 mg ml−1. Higher concentrations inhibit cell spreading and alignment |
| The particular design of the post array does not result in the desired cell alignment | The layout of the post array does not give rise to the adequate strain field required to induce the desired cell alignment | Either increase post length or decrease post spacing to increase the degree of cell alignment | |
| Alternatively, the fibrinogen concentration is too high to permit cell spreading and alignment | Alternatively, lower the concentration of fibrinogen in the gel | ||
| The formed constructs detach from the Velcro frame | The volume of cell–gel solution adsorbed onto the Velcro frame is insufficient to yield strong anchoring | Use pipette tip to evenly spread cell–gel solution onto the entire Velcro frame after injection | |
| Fibrin gel adheres to the PDMS molds | Coating with pluronic solution is insufficient to prevent gel adhesion | Make sure that pluronic solution has wetted the entire PDMS surface | |
| Increase pluronic coating time by 1 h and pluronic concentration to 1% (wt/vol) | |||
| Cells settle to the bottom of the gel during hydrogel polymerization | Hydrogel polymerization takes too long, which permits the cells to precipitate at the bottom | Increase relative thrombin concentration (per mg fibrinogen) | |
| Gelation at 37 °C can also accelerate the polymerization | |||
| 50A(x) and B(xv) | Intensity of immunostaining decreases with depth below the tissue surface | Penetration of antibodies may not be sufficient to reach cell layers below the tissue surface | Apply antibodies while stirring on an orbital shaker and/or increase the incubation time by 1–2 h |
NRSKM, Neonatal rat skeletal myoblasts; PDMS, polydimethylsiloxane.
Anticipated Results
For the initial cell seeding density of 5 × 10⁶ NRVMs or 10 × 106 NRSKMs per ml of hydrogel, cell-mediated gel compaction reaches steady state within 8-13 d of culture (Fig. 3). After two weeks of culture, a 3D network of interconnected muscle tissue bundles is formed with the dimensions and spatial distribution that are directly controlled through the precise fabrication of the PDMS molds (Fig. 4). Specifically, this method allows for the independent control of the muscle construct thickness, overall porosity, bundle diameter, and global and local cell alignment in a reproducible manner, by controlling the thickness of the PDMS mold, the length-to-width ratio of the hexagonal post and the initial porosity before gel compaction35. To quantitatively characterize the overall degree and spatial distribution of cell alignment, we have constructed maps of local cell alignment angles within the tissue constructs (Fig. 5). The average deviation of all the alignment angles from the mean angle has been used as a quantitative measure of the degree of cell alignment. The presence of elongated pores in the obtained muscle constructs significantly increases the degree of overall cell alignment compared with the nonporous cell per hydrogel sheet made in molds of identical dimensions but without posts (Fig. 5b).
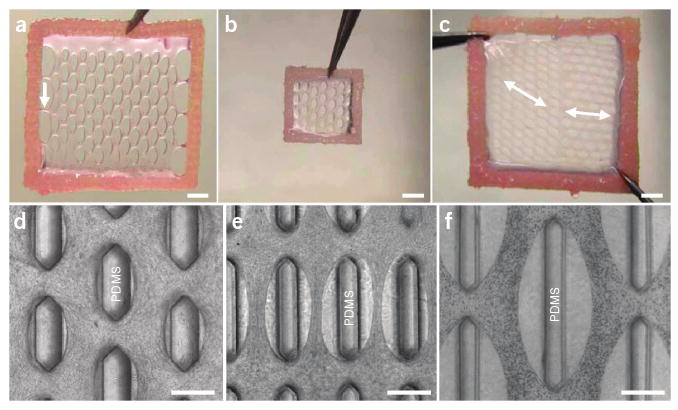
Figure 3.

Compaction of cell–hydrogel mixture with time in culture. (a) Neonatal rat skeletal myoblasts were uniformly distributed upon seeding. (b) Hydrogel compaction around the posts was clearly visible after 2 d of culture and (c) reached steady state at culture day 8 (i.e., after 4 d of differentiation). (d) Uniformly seeded neonatal rat cardiomyocytes yielded hydrogel compaction at (e) a slower rate reaching steady state (f) at culture day 13. Scale bars, 500 μm (insets: 200 μm).
Figure 4.
Control of tissue construct dimensions and structure. (a) A 14 mm × 14 mm tissue network after 2 weeks of culture. White arrow, a side connection to the Velcro frame. (b) A 7 mm × 7 mm tissue network. (c) A 14 mm × 14 mm tissue network with an abrupt change in pore directions (white double arrows). (d–f) Phase contrast images of tissue networks with different pore geometry and distribution. Scale bars, 2 mm in (a–c), 500 μm in (d–f).
Figure 5.

Analysis of muscle cell alignment in tissue constructs. (a) Muscle cell alignment map in a tissue construct. Inset, the same image of F-actin (green) without the overlaid map. Directions of cell alignment in 50 μm × 50 μm subregions (blue squares) were obtained as previously described35. Yellow square, nine subregions with corresponding alignment directions. Bottom panel, histogram of angles of cell alignment relative to the horizontal direction (0°). The standard angle deviation is a quantitative measure of the overall degree of cell alignment. (b) The muscle tissue construct made in a PDMS mold of identical dimensions but without the posts. Note the less aligned cells (a larger angle deviation). Scale bars, 200 μm.
Immunohistological analysis reveals that the resulting 3D muscle bundles are composed of densely packed, evenly distributed and uniformly aligned muscle cells (Fig. 6). Specifically, aligned NRSKMs in tissue bundles (Fig. 6a,b) fuse into multinucleated myogenin positive myotubes, develop distinct cross-striations and spontaneously twitch after the onset of differentiation (see Supplementary Video 1). Similarly, aligned NRVMs in tissue bundles (Fig. 6c,d) show distinct cross-striations, interconnect through connexin-43 gap junctions, spontaneously contract in a synchronous manner (see Supplementary Video 2) and develop directional differences (anisotropy) in the conduction velocity of electrical propagation (data not shown).
Figure 6.

Assessment of cell differentiation and distribution within the muscle tissue constructs. (a) After 2 weeks of culture, neonatal rat skeletal muscle tissue constructs contain dense, aligned and striated myotubes with a significant nuclear expression of myogenin (white arrows). Top panels, single color confocal images. (b) Immunostained cryosection showing differentiated myotubes evenly distributed throughout the tissue thickness. (c) After 2 weeks of culture, neonatal rat cardiac muscle tissue constructs contain dense, aligned and striated cardiomyocytes with a significant intercellular expression of connexin 43 (white arrows). Top panels, single color confocal images. (d) Nonmyocytes (green, white arrows) are interspersed between the aligned cardiomyocytes (red). Scale bars, 20 μm.
Supplementary Material
Acknowledgments
We thank Ava Krol and Lisa Satterwhite for their assistance with cell isolation. This study is supported by a national science scholarship from the Singapore Agency for Science, Technology and Research (A*STAR) to B.L.; an American Heart Association predoctoral fellowship (No. 0715178U) to N.B. (Nima Badie); and NIH grants HL080469 from the National Heart, Lung, and Blood Institute and AR055226 from the National Institute of Arthritis and Musculoskeletal and Skin Diseases to N.B. (Nenad Bursac).
Footnotes
Author Contributions W.B. and B.L. contributed equally to this work. W.B., B.L. and N.B. (Nenad Bursac) jointly developed the protocol; B.L. optimized the fabrication of PDMS tissue molds; W.B. carried out the cell–hydrogel molding experiments and structural assessment of the resulting tissue constructs; N.B. (Nima Badie) developed the program for the analysis of cell alignment. All authors contributed the preparation of the paper.
Note: Supplementary information is available via the HTML version of this article.
References
- 1.Langer R, Vacanti JP. Tissue engineering. Science. 1993;260:920–926. doi: 10.1126/science.8493529. [DOI] [PubMed] [Google Scholar]
- 2.Cukierman E, Pankov R, Stevens DR, Yamada KM. Taking cell–matrix adhesions to the third dimension. Science. 2001;294:1708–1712. doi: 10.1126/science.1064829. [DOI] [PubMed] [Google Scholar]
- 3.Nelson CM, Vanduijn MM, Inman JL, Fletcher DA, Bissell MJ. Tissue geometry determines sites of mammary branching morphogenesis in organotypic cultures. Science. 2006;314:298–300. doi: 10.1126/science.1131000. [DOI] [PMC free article] [PubMed] [Google Scholar]
- 4.Yamada KM, Cukierman E. Modeling tissue morphogenesis and cancer in 3D. Cell. 2007;130:601–610. doi: 10.1016/j.cell.2007.08.006. [DOI] [PubMed] [Google Scholar]
- 5.Bursac N, Loo Y, Leong K, Tung L. Novel anisotropic engineered cardiac tissues: studies of electrical propagation. Biochem Biophys Res Commun. 2007;361:847–853. doi: 10.1016/j.bbrc.2007.07.138. [DOI] [PMC free article] [PubMed] [Google Scholar]
- 6.Yoshioka J, et al. Cardiomyocyte hypertrophy and degradation of connexin43 through spatially restricted autocrine/paracrine heparin-binding EGF. Proc Natl Acad Sci USA. 2005;102:10622–10627. doi: 10.1073/pnas.0501198102. [DOI] [PMC free article] [PubMed] [Google Scholar]
- 7.Padmawar P, Yao X, Bloch O, Manley GT, Verkman AS. K+ waves in brain cortex visualized using a long-wavelength K+-sensing fluorescent indicator. Nat Methods. 2005;2:825–827. doi: 10.1038/nmeth801. [DOI] [PubMed] [Google Scholar]
- 8.Cascio WE, Yan GX, Kleber AG. Early changes in extracellular potassium in ischemic rabbit myocardium. The role of extracellular carbon dioxide accumulation and diffusion. Circ Res. 1992;70:409–422. doi: 10.1161/01.res.70.2.409. [DOI] [PubMed] [Google Scholar]
- 9.Engler AJ, Humbert PO, Wehrle-Haller B, Weaver VM. Multiscale modeling of form and function. Science. 2009;324:208–212. doi: 10.1126/science.1170107. [DOI] [PMC free article] [PubMed] [Google Scholar]
- 10.Lieber RL. Skeletal Muscle Structure, Function and Plasticity: The Physiological Basis of Rehabilitation. Lippincott Williams & Wilkins; Philadelphia, Pennsylvania: 2002. [Google Scholar]
- 11.Kleber AG, Rudy Y. Basic mechanisms of cardiac impulse propagation and associated arrhythmias. Physiol Rev. 2004;84:431–488. doi: 10.1152/physrev.00025.2003. [DOI] [PubMed] [Google Scholar]
- 12.Costa KD, Takayama Y, McCulloch AD, Covell JW. Laminar fiber architecture and three-dimensional systolic mechanics in canine ventricular myocardium. Am J Physiol. 1999;276:H595–H607. doi: 10.1152/ajpheart.1999.276.2.H595. [DOI] [PubMed] [Google Scholar]
- 13.LeGrice IJ, et al. Laminar structure of the heart: ventricular myocyte arrangement and connective tissue architecture in the dog. Am J Physiol. 1995;269:H571–H582. doi: 10.1152/ajpheart.1995.269.2.H571. [DOI] [PubMed] [Google Scholar]
- 14.Bien H, Yin L, Entcheva E. Cardiac cell networks on elastic microgrooved scaffolds. IEEE Eng Med Biol Mag. 2003;22:108–112. doi: 10.1109/memb.2003.1256279. [DOI] [PubMed] [Google Scholar]
- 15.Zhao Y, Zeng H, Nam J, Agarwal S. Fabrication of skeletal muscle constructs by topographic activation of cell alignment. Biotechnol Bioeng. 2009;102:624–631. doi: 10.1002/bit.22080. [DOI] [PMC free article] [PubMed] [Google Scholar]
- 16.Liao I, Liu J, Bursac N, Leong K. Effect of electromechanical stimulation on the maturation of myotubes on aligned electrospun fibers. Cell Mol Bioeng. 2008;1:133–145. doi: 10.1007/s12195-008-0021-y. [DOI] [PMC free article] [PubMed] [Google Scholar]
- 17.Zong X, et al. Electrospun fine-textured scaffolds for heart tissue constructs. Biomaterials. 2005;26:5330–5338. doi: 10.1016/j.biomaterials.2005.01.052. [DOI] [PubMed] [Google Scholar]
- 18.Bursac N, Parker KK, Iravanian S, Tung L. Cardiomyocyte cultures with controlled macroscopic anisotropy: a model for functional electrophysiological studies of cardiac muscle. Circ Res. 2002;91:e45–e54. doi: 10.1161/01.res.0000047530.88338.eb. [DOI] [PubMed] [Google Scholar]
- 19.Badie N, Bursac N. Novel micropatterned cardiac cell cultures with realistic ventricular microstructure. Biophys J. 2009;96:3873–3885. doi: 10.1016/j.bpj.2009.02.019. [DOI] [PMC free article] [PubMed] [Google Scholar]
- 20.Clark P, Coles D, Peckham M. Preferential adhesion to and survival on patterned laminin organizes myogenesis in vitro. Exp Cell Res. 1997;230:275–283. doi: 10.1006/excr.1996.3429. [DOI] [PubMed] [Google Scholar]
- 21.Simpson DG, Majeski M, Borg TK, Terracio L. Regulation of cardiac myocyte protein turnover and myofibrillar structure in vitro by specific directions of stretch. Circ Res. 1999;85:e59–e69. doi: 10.1161/01.res.85.10.e59. [DOI] [PubMed] [Google Scholar]
- 22.Engelmayr GC, Jr, et al. Accordion-like honeycombs for tissue engineering of cardiac anisotropy. Nat Mater. 2008;7:1003–1010. doi: 10.1038/nmat2316. [DOI] [PMC free article] [PubMed] [Google Scholar]
- 23.Kroehne V, et al. Use of a novel collagen matrix with oriented pore structure for muscle cell differentiation in cell culture and in grafts. J Cell Mol Med. 2008;12:1640–1648. doi: 10.1111/j.1582-4934.2008.00238.x. [DOI] [PMC free article] [PubMed] [Google Scholar]
- 24.Powell CA, Smiley BL, Mills J, Vandenburgh HH. Mechanical stimulation improves tissue-engineered human skeletal muscle. Am J Physiol Cell Physiol. 2002;283:C1557–C1565. doi: 10.1152/ajpcell.00595.2001. [DOI] [PubMed] [Google Scholar]
- 25.Syedain ZH, Weinberg JS, Tranquillo RT. Cyclic distension of fibrin-based tissue constructs: evidence of adaptation during growth of engineered connective tissue. Proc Natl Acad Sci USA. 2008;105:6537–6542. doi: 10.1073/pnas.0711217105. [DOI] [PMC free article] [PubMed] [Google Scholar]
- 26.Huang YC, Dennis RG, Larkin L, Baar K. Rapid formation of functional muscle in vitro using fibrin gels. J Appl Physiol. 2005;98:706–713. doi: 10.1152/japplphysiol.00273.2004. [DOI] [PubMed] [Google Scholar]
- 27.Rhim C, et al. Morphology and ultrastructure of differentiating three-dimensional mammalian skeletal muscle in a collagen gel. Muscle Nerve. 2007;36:71–80. doi: 10.1002/mus.20788. [DOI] [PubMed] [Google Scholar]
- 28.Zimmermann WH, et al. Tissue engineering of a differentiated cardiac muscle construct. Circ Res. 2002;90:223–230. doi: 10.1161/hh0202.103644. [DOI] [PubMed] [Google Scholar]
- 29.Black LD, Meyers JD, Weinbaum JS, Shvelidze YA, Tranquillo RT. Cell-induced alignment augments twitch force in fibrin gel-based engineered myocardium via gap junction modification. Tissue Eng Part A. 2009 doi: 10.1089/ten.tea.2008.0502. in press. [DOI] [PMC free article] [PubMed] [Google Scholar]
- 30.Tsang VL, Bhatia SN. Three-dimensional tissue fabrication. Adv Drug Deliv Rev. 2004;56:1635–1647. doi: 10.1016/j.addr.2004.05.001. [DOI] [PubMed] [Google Scholar]
- 31.Liu Tsang V, et al. Fabrication of 3D hepatic tissues by additive photopatterning of cellular hydrogels. FASEB J. 2007;21:790–801. doi: 10.1096/fj.06-7117com. [DOI] [PubMed] [Google Scholar]
- 32.Gonen-Wadmany M, Oss-Ronen L, Seliktar D. Protein-polymer conjugates for forming photopolymerizable biomimetic hydrogels for tissue engineering. Biomaterials. 2007;28:3876–3886. doi: 10.1016/j.biomaterials.2007.05.005. [DOI] [PubMed] [Google Scholar]
- 33.Fedorovich NE, et al. The effect of photopolymerization on stem cells embedded in hydrogels. Biomaterials. 2009;30:344–353. doi: 10.1016/j.biomaterials.2008.09.037. [DOI] [PubMed] [Google Scholar]
- 34.Williams CG, Malik AN, Kim TK, Manson PN, Elisseeff JH. Variable cytocompatibility of six cell lines with photoinitiators used for polymerizing hydrogels and cell encapsulation. Biomaterials. 2005;26:1211–1218. doi: 10.1016/j.biomaterials.2004.04.024. [DOI] [PubMed] [Google Scholar]
- 35.Bian W, Bursac N. Engineered skeletal muscle tissue networks with controllable architecture. Biomaterials. 2009;30:1401–1412. doi: 10.1016/j.biomaterials.2008.11.015. [DOI] [PMC free article] [PubMed] [Google Scholar]
- 36.Whitesides GM. The origins and the future of microfluidics. Nature. 2006;442:368–373. doi: 10.1038/nature05058. [DOI] [PubMed] [Google Scholar]
- 37.Legant WR, et al. Microfabricated tissue gauges to measure and manipulate forces from 3D microtissues. Proc Natl Acad Sci USA. 2009;106:10097–10102. doi: 10.1073/pnas.0900174106. [DOI] [PMC free article] [PubMed] [Google Scholar]
- 38.Andreatta RH, Liem RK, Scheraga HA. Mechanism of action of thrombin on fibrinogen. I. Synthesis of fibrinogen-like peptides, and their proteolysis by thrombin and trypsin. Proc Natl Acad Sci USA. 1971;68:253–256. doi: 10.1073/pnas.68.2.253. [DOI] [PMC free article] [PubMed] [Google Scholar]
- 39.Cummings CL, Gawlitta D, Nerem RM, Stegemann JP. Properties of engineered vascular constructs made from collagen, fibrin, and collagen-fibrin mixtures. Biomaterials. 2004;25:3699–3706. doi: 10.1016/j.biomaterials.2003.10.073. [DOI] [PubMed] [Google Scholar]
- 40.Shi Y, Rittman L, Vesely I. Novel geometries for tissue-engineered tendonous collagen constructs. Tissue Eng. 2006;12:2601–2609. doi: 10.1089/ten.2006.12.2601. [DOI] [PubMed] [Google Scholar]
- 41.Semple JL, Woolridge N, Lumsden CJ. In vitro, in vivo, in silico: computational systems in tissue engineering and regenerative medicine. Tissue Eng. 2005;11:341–356. doi: 10.1089/ten.2005.11.341. [DOI] [PubMed] [Google Scholar]
- 42.Helm P, Beg MF, Miller MI, Winslow RL. Measuring and mapping cardiac fiber and laminar architecture using diffusion tensor MR imaging. Ann N Y Acad Sci. 2005;1047:296–307. doi: 10.1196/annals.1341.026. [DOI] [PubMed] [Google Scholar]
- 43.Ou P, et al. Three-dimensional CT scanning: a new diagnostic modality in congenital heart disease. Heart. 2007;93:908–913. doi: 10.1136/hrt.2006.101352. [DOI] [PMC free article] [PubMed] [Google Scholar]
- 44.Shimizu T, et al. Polysurgery of cell sheet grafts overcomes diffusion limits to produce thick, vascularized myocardial tissues. FASEB J. 2006;20:708–710. doi: 10.1096/fj.05-4715fje. [DOI] [PubMed] [Google Scholar]
- 45.Pérennès F, Marmiroli B, Tormen M, Matteucci M, Di Fabrizio E. Replication of deep x-ray lithography fabricated microstructures through casting of soft material. J Microlith Microfab Microsyst. 2006;5:011007. [Google Scholar]
- 46.Tan JL, et al. Cells lying on a bed of microneedles: an approach to isolate mechanical force. Proc Natl Acad Sci USA. 2003;100:1484–1489. doi: 10.1073/pnas.0235407100. [DOI] [PMC free article] [PubMed] [Google Scholar]
- 47.McDonald JC, Whitesides GM. Poly(dimethylsiloxane) as a material for fabricating microfluidic devices. Acc Chem Res. 2002;35:491–499. doi: 10.1021/ar010110q. [DOI] [PubMed] [Google Scholar]
- 48.Bursac N, et al. Cardiac muscle tissue engineering: toward an in vitro model for electrophysiological studies. Am J Physiol. 1999;277:H433–H444. doi: 10.1152/ajpheart.1999.277.2.H433. [DOI] [PubMed] [Google Scholar]
- 49.Pedrotty DM, et al. Structural coupling of cardiomyocytes and noncardiomyocytes: quantitative comparisons using a novel micropatterned cell pair assay. Am J Physiol Heart Circ Physiol. 2008;295:H390–H400. doi: 10.1152/ajpheart.91531.2007. [DOI] [PMC free article] [PubMed] [Google Scholar]
- 50.Karlon WJ, Covell JW, McCulloch AD, Hunter JJ, Omens JH. Automated measurement of myofiber disarray in transgenic mice with ventricular expression of ras. Anat Rec. 1998;252:612–625. doi: 10.1002/(SICI)1097-0185(199812)252:4<612::AID-AR12>3.0.CO;2-1. [DOI] [PubMed] [Google Scholar]
Associated Data
This section collects any data citations, data availability statements, or supplementary materials included in this article.