

Abstract
Disease networks are increasingly explored as a complement to networks centered around interactions between genes and proteins. The quality of disease networks is heavily dependent on the amount and quality of phenotype information in phenotype databases of human genetic diseases. We explored which aspects of phenotype database architecture and content best reflect the underlying biology of disease. We used the OMIM-based HPO, Orphanet, and POSSUM phenotype databases for this purpose and devised a biological coherence score based on the sharing of gene ontology annotation to investigate the degree to which phenotype similarity in these databases reflects related pathobiology. Our analyses support the notion that a fine-grained phenotype ontology enhances the accuracy of phenome representation. In addition, we find that the OMIM database that is most used by the human genetics community is heavily underannotated. We show that this problem can easily be overcome by simply adding data available in the POSSUM database to improve OMIM phenotype representations in the HPO. Also, we find that the use of feature frequency estimates—currently implemented only in the Orphanet database—significantly improves the quality of the phenome representation. Our data suggest that there is much to be gained by improving human phenome databases and that some of the measures needed to achieve this are relatively easy to implement. More generally, we propose that curation and more systematic annotation of human phenome databases can greatly improve the power of the phenotype for genetic disease analysis.
Introduction
The human genome is defined by the complete DNA sequence and by the functional relationships between all human genes. Similarly, the human phenome can be viewed as the sum of all human phenotypes and the relationships that exist between the various diseases and traits. By correlating networks of genes and phenotypes,1,2 we can investigate disease pathobiology at the whole-phenome scale.1–13 Such analyses build on the premise that phenotypic overlap is a good predictor of genetic relationships, and their success relies on the quality and amount of the phenotype data.5,8,11–13
The importance of using adequate phenotype information is obvious both for clinical diagnosis and for proper disease classification for research studies. The concept of disease families that can be organized into phenotype networks has spurred new interest into more precise and more comprehensive phenotype annotation.14–17 For example, mutations in proteins involved in ciliary functioning result in overlapping phenotypes, collectively referred to as ciliopathies.18 The realization that features such as retinopathy and kidney cysts are indicative of disturbed cilium function has enabled the identification of ciliary diseases based only on their phenotype,16,19,20 as well as the identification of novel ciliopathy genes.21 This and other examples suggest that much can be learned from disease comparisons on a phenome-wide scale. Such phenotype comparisons will need to become more sophisticated as correlations are sought between genetic variants and phenotypic features in ever greater detail, up to the level of individual genotype-phenotype mappings across the genome and across populations.22
Here we analyzed three human phenotype data sets to investigate which characteristics of the disease phenotype descriptions in the available databases would maximize their utility. We examined OMIM (Online Mendelian Inheritance in Man)23 phenotype descriptions that had been converted into structured form by using a recently developed phenotype ontology called the HPO24 (Human Phenotype Ontology). In addition we performed analyses on the diagnosis-oriented Orphanet25 and POSSUM (Pictures Of Standard Syndromes and Undiagnosed Malformations)26 databases. By using the sharing of Gene Ontology annotation as a measure of biological coherence between diseases, we investigated the degree to which phenotype similarity in these databases reflects shared pathobiology for different treatments of the phenotype data. It is important to note that differences in information content and structure of the HPO, POSSUM, and Orphanet databases preclude comparing them directly with each other, so comparisons were always between different treatments of data from a single database. To remove biases that remain even when comparing treatments within one database, all results were expressed relative to random permutations of the phenotypes in that database.
We find that a fine-grained phenotype ontology improves phenome representation, as does inclusion of feature frequency estimates. In addition, we find that the OMIM database that is most used by the community is heavily underannotated, at least for the purpose of systematic phenotype comparisons. We show that this problem can easily be overcome by simply adding data available in the POSSUM database to improve phenotype representations in the structured HPO implementation of OMIM. Our data suggest that there is much to be gained by improving human phenome databases and that some of the measures needed to achieve this are relatively easy to implement. Although manual curation and systematic annotation of disease phenotypes may require substantial investment, we feel that this is justified and necessary to realize the full potential of systematic genotype-phenotype correlations and phenomics.
Material and Methods
Data Sets
In order to compare databases for the relationships between their phenotype content and the underlying genetic architecture, we first needed to formalize phenotype descriptions. Several current disease phenotype databases already define their own standardized feature terms. The diagnosis-oriented LDDB (London Dysmorphology Database),27 Orphanet,25 and POSSUM26 databases all use a controlled vocabulary to systematically annotate disease phenotypes with features, an approach that facilitates differential diagnosis. We used Orphanet and POSSUM in our analyses as examples of such structured human phenome databases. However, the largest phenotype database available, the OMIM,23 is intended to serve more as an information repository than as a diagnostic tool. As such, it does not use a controlled vocabulary. To enable phenotype comparisons to be conducted for this database, previous efforts have employed text mining to convert the free text records into feature lists, with terms defined in external vocabularies.8,11 In this study, we used another recent conversion of OMIM phenotype data, which uses a manually curated systematic hierarchical vocabulary (or ontology) to describe OMIM phenotypes.24 This ontology, known as the Human Phenotype Ontology (HPO), was used by its creators to annotate OMIM phenotypes with feature lists based on annotation taken from the OMIM database itself, converting it into a structured phenotype database. The HPO is comprehensive, with more than 8000 terms organized into a deep hierarchical structure (Table 1). We used HPO version 1.4, downloaded on December 18, 2008, restricting ourselves to the 4345 syndromes that also had OMIM text descriptions (excluded records listed in Table S3 available online).
Table 1.
Overview of the Considered Syndrome Databases
|
OMIM |
||||
|---|---|---|---|---|
| Orphaneta | POSSUM | HPOb | MimMinerc | |
| Num. syndromes | 2070 | 3167 | 4779 | 5948 |
| Num. features in ontology | 864 | 1115 | 8275 | 1368d |
| Feature ontology depth: max. (median) | 4 (2) | 2 (2) | 13 (6) | 15 (5) |
| Median num. features per syndrome: original (expanded)e | 13 (25) | 22 (34) | 7 (20) | 8 (22) |
| Num. syndromes mapped to disease genes | 668 | 924 | 2053 | 2055 |
| Num. disease genes | 1038f | 986 | 2019 | 1937 |
| Reference | 25 | 26 | 24 | 11 |
Only the feature-annotated Orphanet syndromes were included in this analysis. There were a total of 7435 syndrome IDs in the full Orphanet database. However, Orphanet uses clinical syndrome definitions, which are broader than the locus-based syndromes in databases such as OMIM. As a result, multiple IDs associated with the same clinical syndrome are not separately annotated with features.
The Human Phenotype Ontology contains phenotype annotation for a subset of OMIM syndromes as well as some OMIM genes. We restricted ourselves to the 4345 syndrome records with text descriptions.
The MimMiner text-mining conversion of the OMIM database is listed for comparison, but was not used in this study.
The “Anatomy” (A) and “Pathological Conditions, Signs, and Symptoms” (C23) parts of the MeSH ontology were used in the MimMiner approach.
The number in parentheses refers to the median number of features per syndrome after the syndrome feature vectors are expanded to include the feature's ontological ancestors in the feature vector.
The Orphanet database used originally contained 569 disease genes, but this number was expanded to 1935 via syndrome-to-gene mappings from the OMIM database. 1038 of these were associated with feature-annotated syndromes.
The POSSUM and Orphanet phenotype data were received upon request from the Murdoch Children's Research Institute in Melbourne, Australia, and the INSERM in Paris, France, respectively. The POSSUM data (database version 5.7.3) were received in August 2007 whereas the Orphanet data were received in July 2008 (the Orphanet database undergoes continuous development and does not make versioned releases).
All disease to gene mappings were based on the mapping of OMIM IDs to HUGO gene symbols in OMIM's MorbidMap and GeneMap files. The POSSUM and Orphanet diseases were mapped to genes through their associated OMIM IDs.
Cluster Biological Coherence Score Calculation Procedure
We used a cluster-based approach because we are interested in the degree to which phenotypically similar diseases share pathogenetic mechanisms, as proposed by the syndrome family concept.3 We calculated phenotypic distances between syndromes based on their feature vectors. This approach is described in detail in Van Driel et al. (2006).11 In brief, we first used the hierarchical relationships between features in the relevant feature ontology to supplement the feature vectors with their more general ancestor features, and subsequently calculated the phenotypic distances between all syndrome pairs by using the cosine similarity metric, which uses the angle between the two feature vectors as distance measure.
After calculating the phenotypic distances between syndromes, we hierarchically clustered the phenotypes by using average linkage. We then partitioned the resulting dendrogram into clusters by using the “Dynamic Tree Cut” algorithm,28 which creates comparable cluster sizes across different dendrograms (data not shown). This algorithm requires a minimum cluster size as parameter, which we arbitrarily set to five syndromes in order to prevent the creation of large numbers of trivially small clusters, while also avoiding the forcing of dissimilar syndromes into oversized clusters.
Upon partitioning the syndromes into clusters, we then calculated the average biological coherence of the clusters by by using the “Gene Ontology” (GO) gene function annotation29 (version 1.642) as genetic relatedness measure (the gene to GO mapping was downloaded from the Ensembl database30 version 46 on August 28, 2007). We considered several different measures of gene function similarity such as shared biochemical pathways, shared protein domains, and protein-protein interactions, and we chose to use GO annotation because it directly reflects many different kinds of functional relatedness and has the largest and most dense coverage of genes (Table S1).
Cluster biological coherence was calculated as follows. First, we retrieved the GO terms associated with the disease genes underlying cluster syndromes. These GO terms were then pooled across all genes causing the same syndrome, resulting in a set of GO terms annotated to the syndrome. To incorporate ontological relationships between GO terms into the comparison, we added all term ancestors to the GO term set, excluding the root terms for the three GO categories. This approach has been shown to work as well as more complicated approaches.31 For each syndrome pair, we determined the GO term overlap between the two syndromes:
| (1) |
where Sp(i,j) is the pairwise GO term overlap score for diseases i and j, n is the number of GO terms meeting the specified criteria, and Gi and Gj are the sets of GO terms associated with diseases i and j, respectively. For each cluster, the mean pairwise overlap was used as the biological coherence score for that cluster:
| (2) |
where Sc is the genetic cohesiveness score for cluster c, Sp(i,j) is the GO overlap score for diseases i and j, and n is the number of disease pairs in the cluster. The mean biological coherence score across all clusters was used as the overall cluster biological coherence score for the database:
| (3) |
where S is the overall genetic cohesiveness score for the phenotype data set, Sc is the genetic cohesiveness score for cluster c, and n is the number of clusters in the phenotype data set.
Randomizations
We did not compare the cluster biological coherence scores between data sets directly because the many differences between the databases would make it hard to determine which aspects of the database did cause the variation in the biological coherence score. Instead, we compared the scores of the actual data sets to those of randomly permuted data sets. Randomization was done by reshuffling the features over the diseases, while maintaining the phenotypic structure of the data sets. Thus, feature frequencies in the data sets and feature distributions across diseases were maintained, and only the feature assignment to diseases was randomized. In this randomization approach, disease to gene mappings are maintained, correcting for biases resulting from the sharing of genes between diseases, variation in number of genes per disease, and function annotation bias of genes, because these remain identical across both actual and randomized data sets. As final biological coherence measure, we used the ratios of the cluster biological coherence scores of the actual data sets to those of 30 randomized variants. These ratios were used as performance metric for evaluating effect of weighting schemes or other database properties. All ratio comparisons were done with the nonparametric two-sided Wilcoxon rank sum test with continuity correction as implemented in the R statistical software package.
HPO Supplementation Analyses
The OMIM disease phenotype annotation used by the HPO was supplemented with feature annotation from the POSSUM database. We excluded the more detailed skeletal features—those with feature IDs above 746—which were added later to the POSSUM database in order to better describe the skeletal abnormalities that this database is oriented toward. This supplementation resulted in the increase in median number of features per disease from 14 to 38 for those diseases that could be supplemented. We performed the comparisons between the original and the supplemented HPO data sets by using only the 1950 syndromes that could be supplemented with at least one POSSUM feature. The supplemented feature vectors were further processed analogously to the original feature vectors.
HPO Feature Ontology Truncation Procedure
The HPO feature ontology contains more than 8000 features organized into a deep hierarchical structure with a median feature depth of 6 and a maximum depth of 13. We mapped all features located at a depth level of five or higher (i.e., four or more steps from the root of the HPO ontology) to their more general ancestor features at the fourth level, resulting in a set of 1833 more broadly defined features. Where a deep feature had multiple ancestors at this level, it was mapped to all of them. Syndrome feature vectors were modified with this feature mapping, with deeper features being replaced with their appropriate fourth-level ancestor features. All features were registered only once per feature vector, regardless of how many deeper features they replaced. These modified feature vectors were further processed analogously to the full ontology-based feature vectors.
Orphanet Feature Occurrence Frequency Weighting Scheme
Orphanet features are annotated with occurrence frequency estimates. These frequency estimates are divided into three classes: Very Frequent, Frequent, and Occasional. To investigate the effect of incorporating feature frequency estimates on syndrome clustering, we weighted these three frequency classes with the weights 1.0, 0.1, and 0.01, respectively. We contrasted this scheme with one in which the assignment order was reversed, assigning a weight of 1.0 to the Occasional frequency class and 0.01 to the Very Frequent class. These weighted feature vectors were further processed analogously to the unweighted feature vectors.
Inverse Document Frequency Weighting Scheme
Features in feature vectors were weighted via the inverse document frequency algorithm (Equation 4), which assigns higher weights to features occurring in fewer syndromes:
| (4) |
where Fidf is the IDF-weighted feature score, n is the total number of phenotypes, nf is the number of phenotypes with the feature, and F is the original feature score. In this scheme, weights increase logarithmically with rarity. All weights were subsequently rescaled to the 0–1 range. These weighted feature vectors were further processed analogously to the unweighted feature vectors.
Statistical Analysis
Biological coherence scores were compared between data sets via the Wilcoxon signed rank test with continuity correction as implemented in the R statistical software package. This test does not assume normally distributed data.
Results
Incomplete Phenotype Descriptions Impair Phenome Coherence
The median number of phenotype features per disease in the OMIM-based HPO phenotype annotation (7) is much less than it is for the POSSUM and Orphanet databases (22 and 13, respectively) (Table 1). We reasoned that increasing phenotype annotation in the HPO might aid the discovery of biological relationships between diseases in that database. We investigated this by supplementing the OMIM disease annotation with features from the POSSUM database, thus increasing the HPO disease annotation almost 3-fold from 14 features per disease to 38 features per disease. We then hierarchically clustered all HPO phenotypes based on their feature similarities, creating a disease network that we could link to the biological function of disease genes. The biological coherence of resulting HPO phenotypic clusters was measured by the degree to which disease genes shared GO function annotation. In brief, GO terms were pooled across genes per disease, and the mean degree of GO annotation overlap between all disease pairs in a cluster was used as the cluster biological coherence score. The mean score over all clusters was used as the final biological coherence score for the data set (see Material and Methods for more detailed description of procedure).
Enriching the OMIM annotation in the HPO with POSSUM annotation does indeed lead to improved phenotypic clustering of known syndrome families (Figure 1). The 12 annotated subtypes of Ehlers-Danlos syndrome and of Charcot-Marie-Tooth disease segregate better (Figure 1A) and the detection of similarity between the phenotypically more diverse ciliopathies is also increased (Figure 1B). With enriched phenotype descriptions, the HPO disease similarity matrix reflects underlying genetic relationships to a much greater degree (Figure 2A; p < 10−16, two-sided Wilcoxon signed rank test). We conclude that the OMIM database from which the HPO phenotype annotation was taken is currently greatly underannotated and that this affects its performance on detecting biological relationships between disease phenotypes.
Figure 1.
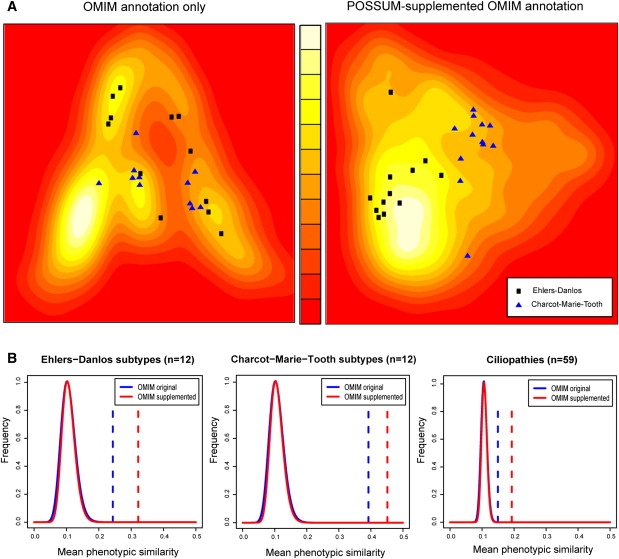
Comprehensively Annotated Syndromes Cluster Better than Sparsely Annotated Syndromes
(A) The Ehlers-Danlos and Charcot-Marie-Tooth syndrome families overlap in the phenome landscape of the OMIM data set, but separate when the phenotype descriptions are supplemented with POSSUM annotation. The phenome landscapes were created with multidimensional scaling of the HPO feature-based OMIM distance matrices (left), supplemented with POSSUM annotation (right). The more similar the annotations of two syndromes are, the closer they are on the landscape. The background colors indicate the density of syndromes in that region of the landscape. Lighter colors represent higher densities.
(B) Mean phenotypic similarity is consistently greater for the POSSUM-supplemented OMIM data set (red dashed lines) than for the original OMIM data set (blue dashed lines). Besides Ehlers-Danlos (n = 12) and Charcot-Marie-Tooth (n = 12), the more phenotypically diverse family of ciliopathies is also shown (n = 59; Table S2). Continuous lines show the distributions of mean distances for randomly composed syndrome families of equivalent size (n = 107) for the original and supplemented OMIM data sets.
Figure 2.
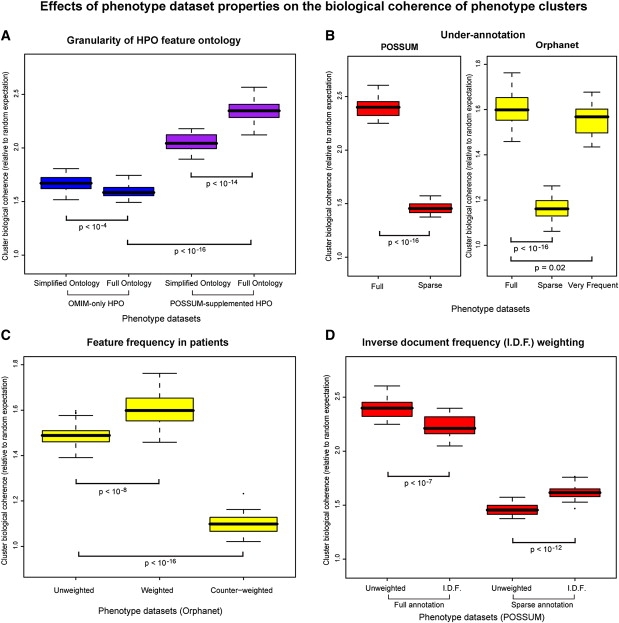
Biological Coherence of Phenotypic Clusters for Different Data Sets and Conditions
The box plots show relative enrichment of shared GO terms for genes associated with diseases within clusters compared to randomly permutated phenotype data sets (n = 30). Box limits show the 25th and 75th percentiles, whiskers extend out up to 1.5× the box range, and points outside this range are plotted individually.
(A) The full HPO ontology results in biologically more coherent phenotype clusters than a simplified HPO ontology containing only more general features, but only when the OMIM phenotypes are supplemented with POSSUM annotation (purple boxes).
(B) Artificial underannotation of the POSSUM and Orphanet databases by randomly halving the syndrome feature lists (“sparse”) leads to strong reductions in cluster biological coherence. However, limiting the Orphanet syndrome descriptions to just the very frequent features has limited impact on cluster coherence, despite the strong reduction in the average number of features per syndrome to just 57% of the original.
(C) Weighting Orphanet features according to their prevalence within affected patients improves the biological coherence of clustered phenotypes. Counter-weighting them by assigning higher weights to less frequently occurring features abolishes the biological coherence of the resulting phenotype clusters almost completely.
(D) Weighting annotated features according to their specificity (number of syndromes they occur in) via the inverse document frequency (I.D.F.) weighting scheme diminishes cluster biological coherence for well-annotated POSSUM syndromes, but improves it for underannotated syndromes.
We further demonstrated this point by artificially underannotating the well-annotated POSSUM and Orphanet syndromes, through the random elimination of half the annotated features per syndrome. As expected, the performance of POSSUM and Orphanet is much reduced when half of the annotated features are randomly removed (Figure 2B; p < 10−16 in both cases, two-sided Wilcoxon signed rank test). These results underline the importance of complete phenotype descriptions for phenotype-based disease analysis and highlight the limitations of using the OMIM database for such analyses.
Detailed Feature Ontologies Improve Phenome Coherence
We then asked whether one would require a highly detailed feature ontology as recently developed in HPO in order to accurately reflect the biology that underlies inherited diseases. Such feature ontologies organize disease features into a hierarchical structure, with deeper features becoming progressively more specific. The HPO has a comprehensive feature ontology containing more than 8000 features, in contrast to the POSSUM and Orphanet ontologies that both contain about a thousand features each (Table 1). It also has the deepest ontology, with a median feature depth of 6 (as opposed to 2 for the POSSUM and Orphanet ontologies) and a maximum depth of 13 (as opposed to 2 and 4 for POSSUM and Orphanet, respectively).
To investigate the benefits of such a highly detailed ontology, we first hierarchically clustered all HPO phenotypes based on their feature similarities. This created a disease network that we could link to the biological function of disease genes. We then repeated the analysis by using a simplified version of HPO truncating the feature tree at three steps from the root of the ontology. This procedure reduced the HPO feature set from a total of 8275 to just 1833 features.
Surprisingly, an initial comparison indicated that the highly detailed feature ontology of HPO did not improve the degree to which phenotype clustering reflects biological relationships between disease genes (Figure 2A). In fact, the use of more detailed feature definitions had a slightly detrimental effect (p < 10−4, two-sided Wilcoxon signed rank test). However, this is likely an artifact of the previously noted underannotation of diseases in OMIM. To confirm this, we repeated the experiment with the HPO disease annotation that had been supplemented with features from the POSSUM database (Figure 2A). As could be expected, the detailed phenotype ontology did indeed improve phenome representation. The full HPO feature ontology performed better on biological coherence of phenotype clusters relative to the simplified ontology (p < 10−14, two-sided Wilcoxon signed rank test). This result highlights two effects: first, detailed and comprehensive feature ontologies such as HPO enable improved phenotype description; and second, underannotation of disease phenotypes severely limits the benefits of such detailed feature ontologies.
Using Feature Occurrence Frequency Can Improve Phenome Coherence
We then asked whether all phenotypic features are of equal importance to the overall disease phenotype. We first restricted the phenotype descriptions to those features that occur very frequently in the respective diseases. Even though this leads to a considerable reduction of features per syndrome (median 57% of original features), the biological coherence scores remained high (Figure 2B). This result shows that the core phenotypic features that occur most commonly in a disease best reflect the underlying biological relationships.
Consistent with this, we found that if we emphasized commonly occurring features and assigned lower weights to infrequent features, a more biologically relevant phenotype clustering was obtained (Figure 2C; p < 10−8, two-sided Wilcoxon signed rank test). By contrast, emphasizing infrequent features by assigning them higher weights almost completely abolished any recognizable biological coherence of phenotype clusters (Figure 2C; p < 10−16, two-sided Wilcoxon signed rank test). Thus, whereas the weighting of phenotypic features based on their frequency of occurrence improves disease classification, emphasizing features that are not part of the core phenotype may have a severe detrimental effect. This result clearly argues for the systematic curation of phenotype data. More specifically, the inclusion of feature frequencies appears to be a requirement for optimal phenotype representation, a feature that is currently available only in Orphanet.
Emphasizing Rare Features Is Detrimental to Phenome Coherence
It has previously been suggested that those features that occur in many diseases will be too general to discriminate between diseases, and too common to aid in specifying the pattern of features that defines a disease family. Rarer features might be more informative for the underlying biology.8,11 We investigated this assumption for the systematically annotated POSSUM database. In contrast to previous studies,8,11 we find that a weighting scheme that uses the standard “inverse document frequency” (or IDF) score is detrimental to the biological coherence of similar phenotypes (Figure 2D; p < 10−7, two-sided Wilcoxon signed rank test). Interestingly, this holds only for fully annotated syndromes because underannotated syndromes do benefit from emphasizing rarer features (Figure 2D; p < 10−12, two-sided Wilcoxon signed rank test). This explains previous results, which were based on text mining of less well-annotated phenotypes. We conclude that overall phenotypic similarity is generally more indicative of underlying genetic relationships than the sharing of specific features that are observed in a few syndromes or diseases only.
Discussion
Here, we have used a biological coherence score based on the sharing of GO annotation between diseases. We use this scoring system to identify database characteristics that enable a better clustering of related disease phenotypes. GO annotation is currently the most comprehensive description of protein function. Nevertheless, other more specific measures of the similarity between gene products exist, such as shared biochemical pathways,32 shared protein domains,33 and protein-protein interactions. These support the general trends we observe based on the GO annotation, although smaller effects are less visible (Table S1 and Figures S1, S2, and S3).
Our analysis of the OMIM-based HPO, POSSUM, and Orphanet structured disease phenotype databases highlights three areas where improvements of phenotype annotation are required. First, the disease phenotypes in the frequently used OMIM database are underannotated, and this severely impairs the degree to which its phenotypes reflect underlying disease pathology. There is therefore a strong need to increase the phenotype annotation in OMIM, for instance by transferring annotation from other more comprehensive sources such as the POSSUM database. Although this can be done manually, the use of feature ontologies can greatly facilitate this process by enabling the automated transfer of annotation between databases. The HPO provides such a feature ontology for the OMIM database, which makes it easy to transfer annotation from another structured phenotype database. With it we have shown that the number of features per disease in OMIM can easily be increased, and this should much improve its applicability for phenome-scale analyses. Our second major finding is that a simple score of the frequency of feature occurrence per disease, as is implemented in Orphanet, refines the phenotype description and improves database performance. Third, the use of detailed and comprehensive feature ontologies such as the HPO can further improve phenotype descriptions, but only if the phenotypes are not underannotated. In addition to these database-related findings, our analysis also highlights a potential pitfall for phenome-scale analyses as emphasizing phenotype features that are rare in the databases does not allow one to cluster diseases more efficiently. These findings have implications for future and perhaps current database design.
Clearly, current human phenotype databases were intended as repositories, as tools for accurate clinical diagnosis of syndromes, and to provide references to a selection of the pertinent literature for specific genetic diseases and syndromes. One could therefore argue that our plea for improvement is demanding something that lies outside the original scope for which these databases were designed. In contrast, we would argue that our ability to compare and group genes based on their sequence and function has proven to be of immense use for genome scientists. We therefore believe that the human phenome deserves a representation that allows scientists to be similarly inquisitive and creative in distilling biologically relevant patterns.
Further down the line, we need to improve the collection of phenotype data as well as their storage. Although curators can standardize phenotype recording in databases, such efforts could be greatly assisted by the standardization of phenotype recording in the clinic.15,16 Such standardized reporting would require controlled feature vocabularies, of which there are several in existence24–27 or under development.34 Given the difficulties of designing feature vocabularies and their importance in phenotype analysis, it might be beneficial to unify terminology across vocabularies. Ultimately, a complete human phenome description incorporating all human phenotypic variation14—including molecular phenotypes35—would be most desirable for correlating phenotype variation to genetic variation. Such analyses could even be performed at the level of individual genomes and phenotypes once sufficient data from initiatives such as the Personal Genome Project become available.22 We believe that the time is ripe for the allocation of substantial resources to improve human phenome annotation on the one hand and to foster the more systematic storage of such data in human phenotype databases on the other.
Supplemental Data
Supplemental Data include three figures and three tables and can be found with this article online at http://www.cell.com/AJHG.
Supplemental Data
Web Resources
The URLs for data presented herein are as follows:
Ensembl database, http://www.ensembl.org/
HPO main website, http://www.human-phenotype-ontology.org/
HPO download, http://bioportal.bioontology.org/ontologies/40381
GO main website, http://www.geneontology.org/
GO download, http://bioportal.bioontology.org/ontologies/40634
Online Mendelian Inheritance in Man (OMIM), http://www.ncbi.nlm.nih.gov/Omim/
Orphanet, http://www.orpha.net/
POSSUM, http://www.possum.net.au/
R statistical software package, http://www.r-project.org/
Acknowledgments
We would like to thank to A. Bankier, C. Rose, M. Black, and the rest of the POSSUM team at the Murdoch Children's Research Institute in Melbourne, Australia, for granting us access to the POSSUM data. We would also like to thank S. Aymé, A. Rath, and the rest of the Orphanet team at the INSERM in Paris, France, for providing us with the Orphanet data. We would further like to express our gratitude to A. Hamosh and colleagues at Johns Hopkins University, Baltimore, MD, for making the OMIM data publicly available and P. Robinson, S. Mundlos, and the HPO team at Charité-Universitätsmedizin in Berlin, Germany, for publicly releasing the HPO. Additionally, we are grateful to P. Beales for providing us with a list of putative ciliopathies and I. Sama for allowing us to use his unpublished protein-protein interaction data. Finally, we would like to thank A. Schenk, H. van Bokhoven, and G. Vriend for critical reading of the manuscript and useful comments. This work was supported in part by the BioRange program of the Netherlands Bioinformatics Centre that is supported by a BSIK grant through the Netherlands Genomics Initiative and by the European Union's 6th Framework Program contract number LSHB-CT-2005-019067 (EPISTEM).
References
- 1.Oti M., Brunner H.G. The modular nature of genetic diseases. Clin. Genet. 2007;71:1–11. doi: 10.1111/j.1399-0004.2006.00708.x. [DOI] [PubMed] [Google Scholar]
- 2.Oti M., Huynen M.A., Brunner H.G. Phenome connections. Trends Genet. 2008;24:103–106. doi: 10.1016/j.tig.2007.12.005. [DOI] [PubMed] [Google Scholar]
- 3.Brunner H.G., van Driel M.A. From syndrome families to functional genomics. Nat. Rev. Genet. 2004;5:545–551. doi: 10.1038/nrg1383. [DOI] [PubMed] [Google Scholar]
- 4.Butte A.J., Kohane I.S. Creation and implications of a phenome-genome network. Nat. Biotechnol. 2006;24:55–62. doi: 10.1038/nbt1150. [DOI] [PMC free article] [PubMed] [Google Scholar]
- 5.Freudenberg J., Propping P. A similarity-based method for genome-wide prediction of disease-relevant human genes. Bioinformatics. 2002;18(Suppl 2):S110–S115. doi: 10.1093/bioinformatics/18.suppl_2.s110. [DOI] [PubMed] [Google Scholar]
- 6.Goh K.I., Cusick M.E., Valle D., Childs B., Vidal M., Barabasi A.L. The human disease network. Proc. Natl. Acad. Sci. USA. 2007;104:8685–8690. doi: 10.1073/pnas.0701361104. [DOI] [PMC free article] [PubMed] [Google Scholar]
- 7.Jiang X., Liu B., Jiang J., Zhao H., Fan M., Zhang J., Fan Z., Jiang T. Modularity in the genetic disease-phenotype network. FEBS Lett. 2008;582:2549–2554. doi: 10.1016/j.febslet.2008.06.023. [DOI] [PubMed] [Google Scholar]
- 8.Lage K., Karlberg E.O., Storling Z.M., Olason P.I., Pedersen A.G., Rigina O., Hinsby A.M., Tumer Z., Pociot F., Tommerup N. A human phenome-interactome network of protein complexes implicated in genetic disorders. Nat. Biotechnol. 2007;25:309–316. doi: 10.1038/nbt1295. [DOI] [PubMed] [Google Scholar]
- 9.Lee D.S., Park J., Kay K.A., Christakis N.A., Oltvai Z.N., Barabasi A.L. The implications of human metabolic network topology for disease comorbidity. Proc. Natl. Acad. Sci. USA. 2008;105:9880–9885. doi: 10.1073/pnas.0802208105. [DOI] [PMC free article] [PubMed] [Google Scholar]
- 10.Loscalzo J., Kohane I., Barabasi A.L. Human disease classification in the postgenomic era: A complex systems approach to human pathobiology. Mol. Syst. Biol. 2007;3:124. doi: 10.1038/msb4100163. [DOI] [PMC free article] [PubMed] [Google Scholar]
- 11.van Driel M.A., Bruggeman J., Vriend G., Brunner H.G., Leunissen J.A. A text-mining analysis of the human phenome. Eur. J. Hum. Genet. 2006;14:535–542. doi: 10.1038/sj.ejhg.5201585. [DOI] [PubMed] [Google Scholar]
- 12.Wu X., Jiang R., Zhang M.Q., Li S. Network-based global inference of human disease genes. Mol. Syst. Biol. 2008;4:189. doi: 10.1038/msb.2008.27. [DOI] [PMC free article] [PubMed] [Google Scholar]
- 13.Wu X., Liu Q., Jiang R. Align human interactome with phenome to identify causative genes and networks underlying disease families. Bioinformatics. 2009;25:98–104. doi: 10.1093/bioinformatics/btn593. [DOI] [PubMed] [Google Scholar]
- 14.Freimer N., Sabatti C. The human phenome project. Nat. Genet. 2003;34:15–21. doi: 10.1038/ng0503-15. [DOI] [PubMed] [Google Scholar]
- 15.Hall J.G. A clinician's plea. Nat. Genet. 2003;33:440–442. doi: 10.1038/ng0403-440. [DOI] [PubMed] [Google Scholar]
- 16.Biesecker L.G. Mapping phenotypes to language: A proposal to organize and standardize the clinical descriptions of malformations. Clin. Genet. 2005;68:320–326. doi: 10.1111/j.1399-0004.2005.00509.x. [DOI] [PubMed] [Google Scholar]
- 17.Schulze T.G., McMahon F.J. Defining the phenotype in human genetic studies: Forward genetics and reverse phenotyping. Hum. Hered. 2004;58:131–138. doi: 10.1159/000083539. [DOI] [PubMed] [Google Scholar]
- 18.Badano J.L., Mitsuma N., Beales P.L., Katsanis N. The ciliopathies: An emerging class of human genetic disorders. Annu. Rev. Genomics Hum. Genet. 2006;7:125–148. doi: 10.1146/annurev.genom.7.080505.115610. [DOI] [PubMed] [Google Scholar]
- 19.Arts H.H., Doherty D., van Beersum S.E., Parisi M.A., Letteboer S.J., Gorden N.T., Peters T.A., Marker T., Voesenek K., Kartono A. Mutations in the gene encoding the basal body protein RPGRIP1L, a nephrocystin-4 interactor, cause Joubert syndrome. Nat. Genet. 2007;39:882–888. doi: 10.1038/ng2069. [DOI] [PubMed] [Google Scholar]
- 20.Beales P.L., Bland E., Tobin J.L., Bacchelli C., Tuysuz B., Hill J., Rix S., Pearson C.G., Kai M., Hartley J. IFT80, which encodes a conserved intraflagellar transport protein, is mutated in Jeune asphyxiating thoracic dystrophy. Nat. Genet. 2007;39:727–729. doi: 10.1038/ng2038. [DOI] [PubMed] [Google Scholar]
- 21.Li J.B., Gerdes J.M., Haycraft C.J., Fan Y., Teslovich T.M., May-Simera H., Li H., Blacque O.E., Li L., Leitch C.C. Comparative genomics identifies a flagellar and basal body proteome that includes the BBS5 human disease gene. Cell. 2004;117:541–552. doi: 10.1016/s0092-8674(04)00450-7. [DOI] [PubMed] [Google Scholar]
- 22.Church G.M. The personal genome project. Mol. Syst. Biol. 2005;1:2005.0030. doi: 10.1038/msb4100040. [DOI] [PMC free article] [PubMed] [Google Scholar]
- 23.Hamosh A., Scott A.F., Amberger J.S., Bocchini C.A., McKusick V.A. Online Mendelian Inheritance in Man (OMIM), a knowledgebase of human genes and genetic disorders. Nucleic Acids Res. 2005;33:D514–D517. doi: 10.1093/nar/gki033. [DOI] [PMC free article] [PubMed] [Google Scholar]
- 24.Robinson P.N., Kohler S., Bauer S., Seelow D., Horn D., Mundlos S. The Human Phenotype Ontology: A tool for annotating and analyzing human hereditary disease. Am. J. Hum. Genet. 2008;83:610–615. doi: 10.1016/j.ajhg.2008.09.017. [DOI] [PMC free article] [PubMed] [Google Scholar]
- 25.Ayme S. Orphanet, an information site on rare diseases. Soins. 2003;672:46–47. [PubMed] [Google Scholar]
- 26.Bankier A., Keith C.G. POSSUM: The microcomputer laser-videodisk syndrome information system. Ophthalmic Paediatr. Genet. 1989;10:51–52. doi: 10.3109/13816818909083773. [DOI] [PubMed] [Google Scholar]
- 27.Winter R.M., Baraitser M. The London Dysmorphology Database. J. Med. Genet. 1987;24:509–510. doi: 10.1136/jmg.24.8.509. [DOI] [PMC free article] [PubMed] [Google Scholar]
- 28.Langfelder P., Zhang B., Horvath S. Defining clusters from a hierarchical cluster tree: The Dynamic Tree Cut package for R. Bioinformatics. 2008;24:719–720. doi: 10.1093/bioinformatics/btm563. [DOI] [PubMed] [Google Scholar]
- 29.Ashburner M., Ball C.A., Blake J.A., Botstein D., Butler H., Cherry J.M., Davis A.P., Dolinski K., Dwight S.S., Eppig J.T. Gene ontology: Tool for the unification of biology. The Gene Ontology Consortium. Nat. Genet. 2000;25:25–29. doi: 10.1038/75556. [DOI] [PMC free article] [PubMed] [Google Scholar]
- 30.Hubbard T.J., Aken B.L., Beal K., Ballester B., Caccamo M., Chen Y., Clarke L., Coates G., Cunningham F., Cutts T. Ensembl 2007. Nucleic Acids Res. 2007;35:D610–D617. doi: 10.1093/nar/gkl996. [DOI] [PMC free article] [PubMed] [Google Scholar]
- 31.Mistry M., Pavlidis P. Gene Ontology term overlap as a measure of gene functional similarity. BMC Bioinformatics. 2008;9:327. doi: 10.1186/1471-2105-9-327. [DOI] [PMC free article] [PubMed] [Google Scholar]
- 32.Kanehisa M., Goto S., Kawashima S., Okuno Y., Hattori M. The KEGG resource for deciphering the genome. Nucleic Acids Res. 2004;32:D277–D280. doi: 10.1093/nar/gkh063. [DOI] [PMC free article] [PubMed] [Google Scholar]
- 33.Hunter S., Apweiler R., Attwood T.K., Bairoch A., Bateman A., Binns D., Bork P., Das U., Daugherty L., Duquenne L. InterPro: The integrative protein signature database. Nucleic Acids Res. 2009;37:D211–D215. doi: 10.1093/nar/gkn785. [DOI] [PMC free article] [PubMed] [Google Scholar]
- 34.Allanson J.E., Biesecker L.G., Carey J.C., Hennekam R.C. Elements of morphology: introduction. Am. J. Med. Genet. A. 2009;149A:2–5. doi: 10.1002/ajmg.a.32601. [DOI] [PMC free article] [PubMed] [Google Scholar]
- 35.Snyder M., Weissman S., Gerstein M. Personal phenotypes to go with personal genomes. Mol. Syst. Biol. 2009;5:273. doi: 10.1038/msb.2009.32. [DOI] [PMC free article] [PubMed] [Google Scholar]
Associated Data
This section collects any data citations, data availability statements, or supplementary materials included in this article.