

Abstract
Aquaporin-4 (AQP4) exists as two major isoforms that differ in the length of the N terminus, the shorter AQP4-M23 and the longer AQP4-M1. Both isoforms form tetramers, which can further aggregate in the plasma membrane to form typical orthogonal arrays of particles (OAPs) whose dimension depends on the ratio of the M1 and M23. In this study, we tested the hypothesis that the M23 isoform can be produced directly by the M1 mRNA. In cells transiently transfected with AQP4-M1 coding sequence we observed besides AQP4-M1 the additional presence of the AQP4-M23 isoform associated with the formation of typical OAPs observable by two-dimensional blue native/SDS-PAGE and total internal reflection microscopy. The mutation of the second in-frame methionine M23 in AQP4-M1 (AQP4-M1M23I) prevented the expression of the M23 isoform and the formation of OAPs. We propose “leaky scanning” as a translational mechanism for the expression of AQP4-M23 protein isoform and that the formation of OAPs may occur even in the absence of AQP4-M23 mRNA. This mechanism can have important pathophysiological implications for the cell regulation of the M1/M23 ratio and thus OAP size. In this study we also provide evidence that AQP4-M1 is mobile in the plasma membrane, that it is inserted and not excluded into immobile OAPs, and that it is an important determinant of OAP structure and size.
Keywords: Biophysics, Channel/Other, Channel/Water, Gene/Regulation, Protein/Folding, Proteomics
Introduction
Aquaporin-4 (AQP4)3 is a water channel protein abundantly expressed in the central nervous system (1, 2). It is localized mainly in astrocyte end feet surrounding blood vessels, in the astrocyte processes that form the glia limitans, and in ependymal cells lining the ventricles. This water channel has been demonstrated to have a key role in fluid movement in mammalian brain, in cell migration and glial scar formation, and in signal transduction (3–5). The AQP4 gene encodes for two different mRNAs with different translation initiating methionines, M1 or M23 (6–8). Thus, AQP4 is expressed as two major isoforms of 32 kDa (AQP4-M1) and 30 kDa (AQP4-M23), which differ by 22 amino acids in the N terminus. These two major AQP4 isoforms are organized in the plasma membrane as heterotetramers (6, 9, 10), appearing as regularly spaced intramembrane particles in freeze-fracture electron microscopy images (11–14). Multiple intramembrane particles aggregate to form structures known as orthogonal arrays of particles (OAPs) or square arrays (12, 13, 15). Correlations have been reported between OAP alteration and various neuromuscular disease, including brain ischemia, edema, stroke, brain tumor, focal cortical freeze injury, acute bacterial meningitis, brain abscess (16–21), and muscular dystrophy (22–27). Recently, AQP4 was correlated with neuromyelitis optica (28), an inflammatory demyelinating autoimmune disease associated with AQP4 water channel antibodies (NMO-IgG) detectable in the serum of patients (29–33). Little is known about the molecular target of AQP4 autoantibodies. We recently reported (34) the ability of NMO-IgG to recognize AQP4 specifically only when present as OAPs, indicating that the NMO-IgG epitope is not present in the AQP4 protein per se, but it is intrinsic in AQP4 assembled into OAPs.
The physiological role of AQP4 organization into OAPs and their size are as yet largely unknown. It has been speculated that this assembly might enhance water permeability (35–37), although the water permeabilities of the individual isoforms are similar (4). Alternately, formation of OAPs may confer higher level plasma membrane stability necessary for AQP4 polarization in particular zones such as astrocyte foot processes (38). Such functional differences in plasma membrane lateral diffusion have been documented. The AQP4-M23 isoform was shown to have lower mobility in the plasma membrane compared with the AQP4-M1 isoform (39).
Freeze-fracture electron microscopy analysis of the AQP4-M1 and AQP4-M23 isoforms, selectively expressed in cultured cells, has shown that AQP4-M23 alone forms large size OAPs, whereas AQP4-M1 alone is unable to form OAPs. When coexpressed, they form OAPs of intermediate size, similar to those seen in native tissues, suggesting that the ratio of the two isoforms is central to the determination of OAP size (14, 37). Biochemical analysis using blue native (BN)/SDS-PAGE has recently shown the expression of several AQP4 multisubunit complexes (pools) ranging from several MDa to ∼400 kDa in the brain, indicative of OAPs of various sizes (40, 41). These pools contain different ratios of the 30/32-kDa isoforms. AQP4-M23 is expressed mainly in the higher molecular mass pools in contrast with AQP4-M1 expressed mainly in the lower molecular mass pools.
Little is known about the molecular mechanism that controls the tissue-specific expression ratios AQP4-M1/M23 isoforms and the mechanism by which AQP4-M23 isoform is expressed from the AQP4 gene. The AQP4-M23 isoform was described as a transcript or spliced variant of the AQP4 gene (6, 42), and more recently, AQP4-M23 has been assumed as translational variant of the AQP4-M1 isoform mRNA (8). According to the scanning model for translational initiation (43–45), the 40 S ribosomal subunits enter at the 5′ m7G cap end of the mRNA and scan in a 5′ to 3′ direction until they find a suitable start codon, at which point they initiate translation. However, if this first start codon is not in a “good nucleotide context” as defined by the Kozak consensus sequence (43, 44), the scanning can be “leaky,” which means that some ribosomes may fail to initiate at this AUG and continue scanning to the next AUG. Comparison of the sequences surrounding the two start codons in AQP4 indicates that the second downstream AUG (M23) is in an optimal nucleotide context (ATCAUGG), whereas the upstream AUG (M1) is in a suboptimal context (GGCAUGA). Therefore, we hypothesized that the shorter M23 isoform of AQP4 can be translated from the AQP4-M1 mRNA through a leaky scanning mechanism. To test this hypothesis we analyzed whether cells transiently transfected with AQP4-M1 cDNA also synthesize the AQP4-M23 isoform and, consequently, form OAPs. As control, a mutated form of AQP4-M1 was studied in parallel in which the methionine 23 was substituted with isoleucine (AQP4-M1M23I).
EXPERIMENTAL PROCEDURES
SDS-PAGE and Western Blot Analysis
Cerebrum, cerebellum, spinal cord, kidney, stomach, and skeletal muscle were removed and cut into small pieces in seven volumes of lysis buffer (10 mm Trizma (Tris base), 150 mm NaCl, 0.2 sodium orthovanadate; 1% Triton X-100, 0.5% IGEPAL, 1 mm EDTA, 1 mm EGTA, protease inhibitors mixture (Roche, Diagnostics)). The lysis was performed on ice for 2 h, and the samples were then centrifuged at 22,000 × g for 1 h. The protein content of the supernatant was measured with BCA protein assay kit (Bio-Rad). Membrane proteins were dissolved in SDS loading buffer and 2.5% β-mercaptoethanol, heated to 37 °C for 10 min, and resolved on a 13% polyacrylamide gel. Immunoblotting was performed as described previously (46, 47). Reactive proteins were revealed with an enhanced chemiluminescent detection system (ECL-Plus; Amersham Biosciences) and visualized on a Versadoc imaging system (Bio-Rad).
Plasmids and Mutagenesis
The wild type human AQP4-M1 and AQP4-M23 cDNAs were cloned into the pTarget Mammalian Expression Vector system (Promega). The mutant construct named pTarget human AQP4-M1M23I, containing the missense mutation able to replace the methionine 23 in isoleucine, was obtained with a site-specific mutagenesis approach using a QuikChange II Site-directed Mutagenesis kit (Stratagene) according to the manufacturer's protocol. Briefly, the wild type human AQP4-M1 isoform was used as template in a long high fidelity PCR performed with PfuUltra® High Fidelity DNA polymerase. The site-specific mutant primer M23I (5′- CCTTTGTGTACCAGAGAGAACATCATAGTGGCTTTCAAAGG-3) was designed using the Stratagene web-based QuikChange Primer Design program available online. The amplified product was digested with DpnI specific for methylated and hemimethylated DNA to digest the parental DNA and subcloned in Escherichia coli XL1-Blue supercompetent cells (Stratagene). The same method was used to convert the methionine 23 translational context (ATCATGG) into an inefficient translational context (CTCATGC). This mutation allow us to maintain the apolar methionine 23 context converting the isoleucine 22 and the valine 24 into two leucines. The wild type human AQP4-M1 cDNA was also cloned into pcDNA3.1/NT-GFP-TOPO vector, containing the green fluorescent protein (GFP) coding sequence to create AQP4-M1 tagged at its N terminus with GFP (N-terminal GFP-AQP4-M1). All of the plasmids were subjected to sequencing.
Cell Culture and Plasmid Transfection
HeLa cells were maintained in Dulbecco's modified Eagle's medium supplemented with 10% fetal bovine serum, 100 units/ml penicillin, and 100 μg/ml streptomycin. Six h before transfection, the cells were plated at subconfluence using antibiotic-free medium. Cells were transfected with Lipofectamine 2000 (Invitrogen) according to the manufacturer's protocol and analyzed after 24–48 h.
Immunofluorescence
HeLa cells plated on coverslips were fixed in 4% paraformaldehyde, washed in phosphate-buffered saline (PBS), and permeabilized with 0.3% Triton X-100 in PBS. After blocking with 0.1% gelatin in PBS, cells were incubated with primary antibodies for 1 h at room temperature. After washing in PBS, cells were incubated for 30 min with Alexa Fluor-conjugated secondary antibodies. The staining with NMO serum was performed on unfixed living cells. Coverslips were mounted on slides with mounting medium and examined by using a Nikon photomicroscope equipped for epifluorescence (DMRXA; Leica, Heidelberg GmbH, Mannheim, Germany). Digital images were obtained with a DMX 1200 camera (Nikon, Tokyo, Japan).
Protein Samples for BN PAGE
Transfected HeLa cells were washed once in ice-cold PBS and dissolved in BN lysis buffer (48) (500 mm ϵ-aminocaproic acid, 50 mm imidazole, 2 mm EDTA, 12 mm NaCl, 10% glycerol, 1% Triton X-100, and a protease inhibitor mixture (Roche Diagnostic). After a 30-min incubation on ice, the samples were centrifuged at 22,000 × g for 30 min, and the protein content of the supernatant was measured with a BCA protein assay kit.
BN/SDS-PAGE
Polyacrylamide native gradient gels (3–9%) were prepared as described (40, 41). Twenty μg of protein sample prepared as described earlier were mixed with 5% of Coomassie Blue G-250 and loaded in each lane. Twenty μg of ferritin was used as the molecular mass standard (440 and 880 kDa). The running buffers were the anode buffer (25 mm imidazole, pH 7) and blue cathode buffer (50 mm Tricine, 7.5 mm imidazole, 0.02% Coomassie Blue G-250, pH 7). After the blue running front has moved about one-third of the desired total running distance, the blue cathode buffer was removed, and the run was continued using slightly blue cathode buffer B/10 (50 mm Tricine, 7.5 mm imidazole, 0.002% Coomassie Blue G-250, pH 7) for better detection of faint protein bands and to improve native blotting. The electrophoresis was stopped when the tracking line of Coomassie Blue G-250 dye had left the edge of the gel. Lanes from the first dimension were cut into individual strips and equilibrated in denaturation buffer (1% SDS, 1% β-mercaptoethanol) 1–2 h at room temperature. A single strip was then placed into a second dimension gel of the same thickness and subjected to SDS-PAGE performed according to standard protocols. At the end of the run, the gel was blotted onto a polyvinylidene difluoride (Millipore, Bedford, MA) membrane for Western blot analysis.
Antibodies
Goat anti-AQP4 polyclonal antibodies (Santa Cruz Biotechnologies, Santa Cruz, CA) were used for Western blot and immunofluorescence analysis. For AQP4 and NMO double immunofluorescence experiments, a rabbit anti-AQP4 antibody was used (1). Peroxidase-conjugated secondary antibodies were from Santa Cruz Biotechnologies. The secondary antibodies used for immunofluorescence were from Molecular Probes (Eugene, OR). A pool of four different sera from NMO patients at a dilution of 1:1000 in immunofluorescence experiments was used.
Chemicals
ϵ-Aminocaproic acid, imidazole, Tricine, and ferritin were from Fluka (St. Louis, MO). Acrylamide/bisacrylamide was from Serva (Heidelberg, Germany). All other chemicals were obtained from Sigma.
Total Internal Reflection Fluorescence (TIRF) Microscopy Analysis for the Measurement of AQP4 Dots
A Nikon laser TIRF setup was used, consisting of a 488 nm argon laser mounted on a Nikon laser TE2000U microscope, which also allows phase-contrast and epifluorescence techniques to be combined with TIRF technology. An incidence angle greater than the critical angle was achieved by the use of a 100× CFI Plan Apo of 1.45 numerical aperture. Fluorescence excited by TIR evanescent field was collected with the same objective, and images were collected by a cooled charge-coupled device camera (Hamamatsu Orca). Transfected HeLa cells were stained with commercial AQP4 antibodies and with NMO sera as described under “Immunofluorescence.” To determine the size of AQP4 spots, images were taken with a 100× TIRF objective and 1.5 optic zoom.
Fluorescence Recovery after Photobleaching (FRAP) Experiments
For these studies a stable cell line (HeLa) expressing a GFP-fused M1 isoform of AQP4 (M1-GFP) was used. The clone that we used for this study had approximately 60% transfected cells. M1-GFP-expressing cells were grown on a 35-mm-diameter glass bottom dish and transiently transfected with the M23-AQP4 isoform. After 1 or 2 days, cells expressing large size OAPs (M1-GFP/M23) were identified under UV light and were easily recognizable from those only expressing the M1-GFP isoform. The use of NMO-IgG at the end of the FRAP experiment confirmed the previous cell identification. FRAP experiments were performed using an argon ion laser beam (488 nm, Nikon D Eclipse C1) which was modulated by an acousto-optic modulator and directed onto the stage of an inverted epifluorescence microscope (Nikon Eclipse TE 2000-U). The full-field and laser beams were reflected by a diachronic mirror (510 nm) onto the sample by a 100× objective lens (Nikon Fluor, numerical aperture 1.45). The laser beam was set to 200–500 mW. Fluorescence cell images were taken before bleaching and at 10-s intervals after bleaching. All measurements were taken at 23 °C in a temperature-controlled darkroom. After the experiments, the fluorescence intensity of the spot was measured for both M1 and OAP-expressing cells present on the same dish.
RESULTS
Analysis of AQP4 Translation Initiation Signals (TISs)
The ratio of AQP4-M1 to AQP4-M23 isoforms is variable among the different tissues in which AQP4 is expressed. As shown in the Western blot in Fig. 1A, this ratio is lower in the central nervous system compared with other tissues such as skeletal muscle and stomach. To understand the mechanism by which the expression ratio of M1 and M23 isoforms is controlled, we transfected HeLa cells with cDNA encoding AQP4-M1. Surprisingly, analysis of AQP4 protein expression in these HeLa cells revealed the 32 kDa band as expected but also the additional presence of a 30 kDa band, corresponding to the M23 isoform. To obtain insight into the mechanism regulating this ratio, we compared the nucleotide contexts surrounding the two TISs of AQP4, TIS-1 and TIS-2, which give rise to AQP4-M1 and AQP4-M23, respectively. This analysis revealed that the TIS-1 sequence in both human and rat AQP4 (GGCATGA) is in a suboptimal context, whereas TIS-2 (ATCATGG) is in an optimal context, according with Kozak (43) (Fig. 1B). Thus, we hypothesized that a leaky scanning mechanism might be involved in regulating the expression of the two AQP4 isoforms from the same transcript. To verify this hypothesis, a mutated form of AQP4-M1 was produced (AQP4-M1M23I) in which the methionine 23 was substituted with isoleucine to abolish the TIS-2 (Fig. 1C).
FIGURE 1.

Possible mechanism responsible for AQP4-M23 synthesis from AQP4-M1 mRNA. A, Western blot analysis of AQP4-M1 and AQP4-M23 in different tissues. A polyvinylidene difluoride membrane containing rat tissues and transfected cells, immunoblotted with anti-AQP4 antibodies after glycine/SDS-PAGE is shown. The AQP4-M1/M23 ratio is variable among the different tissues; in particular, the AQP4-M23 isoform is abundant in the cerebrum, cerebellum, and spinal cord. Note that in HeLa cells transiently transfected with the M1 isoform, two bands of 30 and 32 kDa are present. B, analysis of AQP4 mRNA at the level of the TISs surrounding M1 (TIS-1) and M23 (TIS-2). The 5′-proximal AUG corresponding to M1 is located in a suboptimal context, whereas the AUG corresponding to M23 is in an optimal context (42–45). C, mutated form of AQP4-M1 mRNA (M23I) was generated by mutagenesis in which the substitution methionine in isoleucine at position 23 will destroy the TIS-2, avoiding the leaky scanning mechanism.
Expression of Wild Type and Mutated AQP4 Isoforms
Initial experiments were done to analyze the expression of wild type AQP4-M1 and AQP4-M23 together with the mutated AQP4-M1 (AQP4-M1M23I) isoforms in transiently transfected HeLa cells (Fig. 2). By Western blotting (Fig. 2A), the presence of a 30 kDa together with the expected 32 kDa band was clearly detectable in wild type AQP4-M1-transfected cells. The 30 kDa band, corresponding to the M23 isoform of AQP4, was absent in cells transfected with the AQP4-M1M23I, indicating that a leaky scanning mechanism is likely responsible for the translation of the AQP4-M23 isoform in AQP4-M1-transfected cells. By immunofluorescence (Fig. 2B), we found that the replacement of the methionine with isoleucine at position 23 did not affect the targeting of the protein to the plasma membrane. This was also confirmed by the absence of intracellular staining with confocal analysis (data not shown).
FIGURE 2.
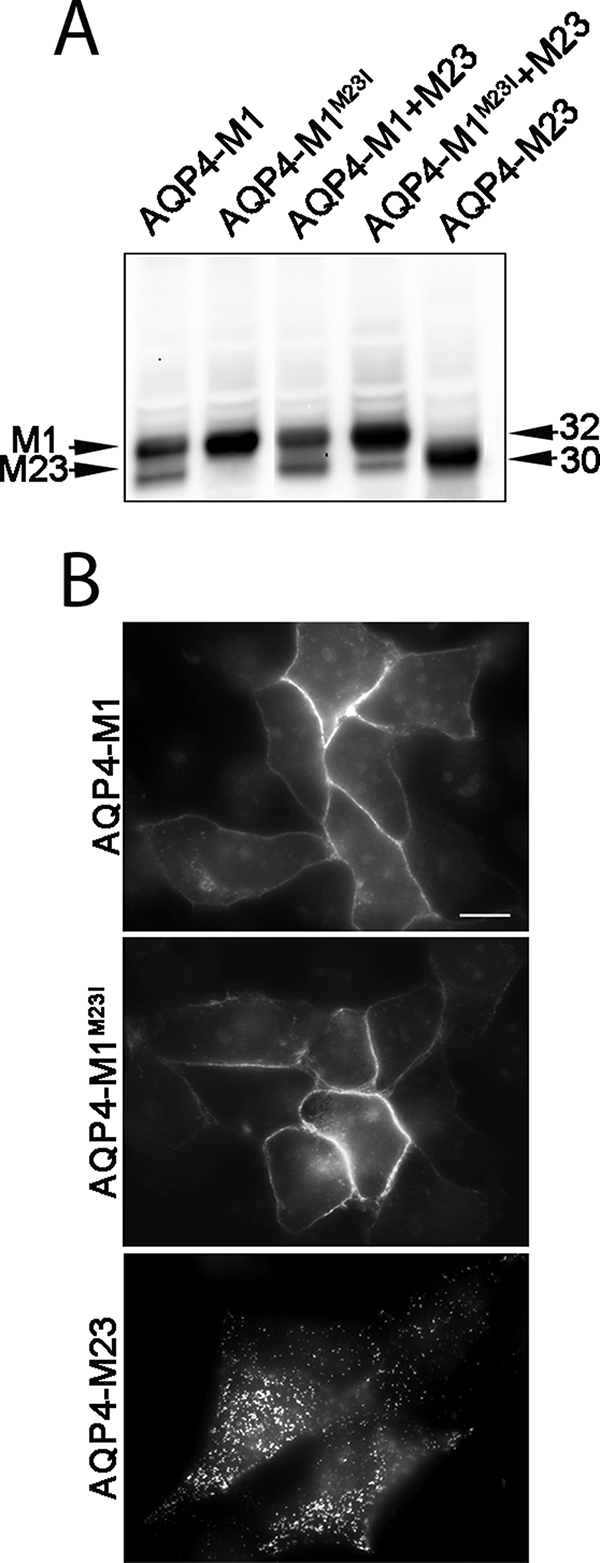
Expression of AQP4-M1, AQP4-M1M23I, and AQP4-M23 in transiently transfected HeLa cells. A, AQP4 immunoblot of membrane proteins prepared from HeLa cells transfected as indicated. Note that the 30 kDa band is present in cells transfected with the wild type AQP4-M1 and is absent in those transfected with AQP4-M1M23I. B, epifluorescence micrographs of HeLa cells transfected with AQP4-M1, AQP4-M1M23I, and AQP4-M23. Scale bar, 10 μm. Note the dot-like plasma membrane staining when M23 is expressed.
OAP Formation in AQP4-M1-transfected Cells
Because both isoforms of AQP4 were expressed in AQP4-M1-transfected cells, we determined whether OAPs were present in these cells. Analysis of the plasma membrane organization of the different AQP4 isoforms was performed by both TIRF microscopy (Fig. 3A) and by BN-SDS/PAGE (40, 41, 49) (Fig. 3B). The TIRF microscopic analysis of wild type AQP4-M1-transfected cells stained with commercial AQP4 antibodies revealed the linear staining typical of the expression of M1 isoform. In addition, many cells exhibited punctate staining, indicating the presence of OAPs. In agreement with these data, the BN/SDS-PAGE analysis showed the presence of several larger size spots corresponding to discrete OAPs in addition to the smallest ∼440-kDa pool. In contrast, OAPs and larger sized pools were completely absent in cells transfected with AQP4-M1M23I. Staining in AQP4-M1M23I cells was found to be continuous and evenly distributed in the plasma membrane with no visible dots by TIRF microscopy and only the 440-kDa pool by BN/SDS-PAGE. The size of the dots visualized by TIRF microscopy as well as the size of the AQP4 pools increased in parallel with the increased amount of the AQP4-M23 isoform and were the largest in cells transfected with AQP4-M23. All of these data further confirm that AQP4-M23 can be translated from AQP4-M1 transcript by a leaky scanning mechanism and highlight the presence of OAPs in transiently transfected HeLa cells.
FIGURE 3.

Visualization of AQP4 OAPs by TIRF microscopy and two-dimensional BN/SDS-PAGE. A, TIRF micrographs of Alexa Fluor 488-labeled AQP4-M1M23I, AQP4-M1, AQP4-M1M23I + AQP4-M23, AQP4-M1 + AQP4-M23, and AQP4-M23 in HeLa cells. Scale bar, 10 μm. B, immunodetection of AQP4 pools after a 3–9% gradient BN PAGE (first dimension) and 12% SDS/PAGE (second dimension). Note that in BN/SDS-PAGE experiments the expression of AQP4-M1 isoform induced the immunodetection of five different pools due to the concomitant expression of AQP4-M23 and the consequent formation of small OAPs. In contrast, the parallel analysis of AQP4-M1M23I revealed the presence of the single smaller AQP4 pool corresponding to AQP4 tetramers.
NMO-IgG Antibodies Recognize AQP4-M1 Transiently Transfected HeLa Cells
To demonstrate further the presence of OAPs in AQP4-M1 transiently transfected HeLa cells and to give additional support to leaky scanning as a possible mechanism of regulation of the AQP4-M1/M23 expression ratio, we used NMO-IgG antibodies, which recognize AQP4 only when assembled into OAPs (34). As shown in Fig. 4, the NMO-IgG antibody recognized AQP4 only in cells (Fig. 4, insets) transfected with AQP4-M1, and not in AQP4-M1M23I expressing cells, even though AQP4 expression, visualized using the AQP4 commercial antibody, was not significantly different in the two conditions. To promote formation of OAPs, we co-expressed AQP4-M23 with AQP4-M1M23I or AQP4-M1 and determined whether NMO-IgG now recognized AQP4. As shown in Fig. 4, the NMO-IgG serum recognized AQP4 in all cells expressing AQP4-M23. All of these results were also confirmed modifying the Kozak nucleotide context of the second TIS but without altering the codon sequence for the M23 (see supplemental Fig. 1).
FIGURE 4.

OAPs visualization using NMO-IgG serum. Double immunofluorescence experiments performed with rabbit polyclonal AQP4 antibodies (AQP4) and with NMO serum (NMO) are shown. Several cells transfected with AQP4-M1 were recognized by the NMO-IgG serum, whereas no positive cells were found when the mutated AQP4-M1M23I isoform was used. Scale bar, 15 μm.
OAPs Are Made of Both M23 and M1 Isoforms, and M23 Reduces M1 Plasma Membrane Lateral Diffusion
To study whether OAPs are made exclusively of AQP4-M23 or whether they are a mixture of AQP4-M1 and AQP4-M23, we used HeLa cells stably transfected with fluorescent AQP4-M1 (AQP4-M1-GFP) using a construct expressing AQP4-M1 fused at its N terminus with GFP. In this case, because GFP TIS is the strongest (ACCATGG), the only possible translated protein is the AQP4-M1-GFP fusion protein as confirmed by the absence of multiple AQP4 pools in SDS-PAGE and by the absence of dots by TIRF microscopic analysis (data not shown). This cell line was transiently transfected with untagged AQP4-M23. Interestingly, the co-expression of fluorescent tetramers of AQP4-M1 together with untagged AQP4-M23 induced the appearance of fluorescent OAPs in the same microscopy field, making it possible to easily identify both AQP4-M1-expressing cells (no OAPs) and AQP4-M1/M23-expressing cells (OAP-containing). The presence of GFP-OAPs indicates that AQP4-M1 is incorporated into OAPs (Fig. 5A).
FIGURE 5.

FRAP experiments performed on AQP4-M1- and AQP4-M23-expressing HeLa cells. A, four serial images from a data set. The images displayed were recorded before and 1 and 6 min after photobleaching pulse. B, representative AQP4-M1-GFP and AQP4-M1-GFP + AQP4-M23 individual FRAP curves. Note that AQP4 organization in OAPs strongly slowed its plasma membrane lateral diffusion. C, data shown as reciprocal half-times (t1/2) for fluorescence recovery (mean ± S.E. of separate sets of measurements, n = 3–7).
In the same cell line, FRAP measurements were performed to determine the effect of the AQP4-M1/M23 ratio on the plasma membrane lateral diffusion of AQP4. Fig. 5A shows sequences of fluorescence micrographs of these cells during a representative FRAP experiment. Before the bleaching, AQP4-M1-GFP-transfected cells exhibited a diffuse linear plasma membrane staining, whereas the AQP4-M1-GFP + AQP4-M23 cells show a typical dot-like plasma membrane staining. After the laser shot at 0 min, the fluorescence was reduced in the bleached regions in both cell types; and after 6 min, AQP4-M1-GFP-expressing cells show a 80% of fluorescence recovery in the bleached region (Fig. 5B, upper). Interestingly, the fluorescence recovery was remarkably slowed in cells expressing both AQP4-M1-GFP and AQP4-M23 (Fig. 5B, lower) with a recovery of ∼30% of the fluorescence level over 25 min. The reciprocal of the half-time (1/t1/2) recovery was about 6 times lower in OAP-expressing cells compared with AQP4-M1-expressing cells (Fig. 5C), demonstrating that AQP4 is much less mobile in the plasma membrane when organized into OAPs.
DISCUSSION
The different ratios of M1 and M23 isoforms found in different tissues where AQP4 is expressed indicate that cells can regulate this ratio and therefore OAP size, with possible functional implications. Although in a recent paper it has been demonstrated that hydrophobic intermolecular interactions at the N terminus of AQP4 are necessary for OAP formation (50), the molecular mechanisms controlling the expression of the two isoforms of AQP4 to generate OAPs of different sizes (40) still remain unclear as well as the mechanism by which AQP4-M23 is expressed from the AQP4 gene. Interestingly, even though in human brain it has been shown a much higher relative abundance of M1 versus M23 mRNA (42), this ratio is inverted when it comes to AQP4 protein expression levels because M23 is always more abundant compared with the M1 isoform.
In this study, we attempted to get an insight into the molecular basis that controls the expression of M1 and M23 isoforms. We used mammalian cells transiently transfected with M1- and/or M23-AQP4 coding sequence and with a mutated M1 isoform in which the methionine 23 was substituted with isoleucine to abolish the TIS-2 of AQP4, to analyze the source of the M23 isoform, and to verify the hypothesis that the translation of M23 isoform can be obtained from M1 mRNA. Given the absence of the intron sequences and the noncoding sequences in the transfected plasmids, transcriptional and M1/M23 alternative splicing mechanisms that have been reported previously to explain the presence of different isoforms in rat, human, and mouse AQP4 (6–8, 42, 51, 52) are excluded. Based on the obtained results, we propose that the synthesis of the M23 isoform possibly occurs via a leaky scanning mechanism. The first direct evidence of this mechanism is the appearance of a 30-kDa isoform (M23) in cells transfected with the M1 coding sequence associated with the formation of OAPs, as observable by TIRF and BN/SDS-PAGE. In addition, replacement of the methionine at position 23 with a isoleucine (AQP4-M1M23I) prevented both translation of the 30-kDa isoform and the formation of OAPs. We conclude that the formation of OAPs can occur even in the absence of M23-AQP4 mRNA. Our results provide the possibility that the size and formation of OAPs in different cells depend on the efficacy of the leaky scanning mechanism. Some hypothesis are so far available on the basic tetrameric composition of AQP4 and therefore on the composition of the OAPs. Neely et al. (53) demonstrated that the two AQP4-M1 and -M23 isoforms are able to form heterotetramers supposed to aggregate to form OAPs whose dimension is depending on the M1/M23 ratio. Crane et al. (39), however, using a quantum dot-based approach, recently reported that AQP4-M1 does not incorporate into OAPs, but it modulates array size by competing for AQP4-M23 monomers at the OAP edges (39, 50) and by using TIRF microscopy revealed that OAPs are relatively immobile in the plasma membrane. In our approach, we used cells stably expressing GFP-tagged tetramers of AQP4-M1 isoform. In experiments in which this cell line was transiently transfected with the untagged M23-AQP4 isoform we observed the appearance of fluorescent GFP-OAPs that were clearly distinguishable by TIRF microscopy, indicating that the fluorescent M1 was inserted and not excluded into the OAP structure and that AQP4-M1 is also an important determinant of OAP structure. Importantly, whereas AQP4-M1-GFP appears to be relatively mobile in the plasma membrane, the co-expression of the untagged AQP4-M23 induced the appearance of almost immobile GFP-OAPs. This is in agreement with what reported by Crane et al. (39), indicating OAPs as a stationary structure whose mobility is only moderately dependent on other components such as the cytoskeleton or dystrophin-associated proteins (39). This may have physiological and pathological consequences. For example, immobile AQP4-OAPs such those present in astrocyte end feet close to blood-brain barrier may have a role in sustaining the polarized expression of AQP4 for a highly confined osmotically driven water flux. Otherwise, large OAPs could be useful to crowd together dystrophin-associated proteins, ion channels (i.e. KIR4.1), and other membrane proteins expressed (41). In fact, the finding that α-syntrophin (9, 38) or dystrophin deletion (25, 42) results in a loss of perivascular accumulation of AQP4 in astrocytes and muscle suggest that other components are required for OAP membrane stability. Smaller and more mobile AQP4-OAPs may have a role in cell migration and glial scar formation (54, 55).
In conclusion, our present data demonstrate that the leaky scanning mechanism exists as a translational mechanism for the expression of AQP4 protein isoforms. We speculate that this mechanism can have important pathophysiological implications for the cell regulation of the M1/M23 ratio and therefore of OAPs size. We also confirm that OAPs are made of both M1 and M23 isoforms and that the ratio is important in determining the size of the OAPs.
Supplementary Material
Acknowledgment
We thank Miduturu Srinivas for assistance in revising the English.
This work was supported by Progetto strategico regionale Neurobiotech, Project Number 124 Regione Puglia and Rete Nazionale di Proteomica, Fondo per gli Investimenti della Ricerca di Base 2008, RBRN07BMCT.

The on-line version of this article (available at http://www.jbc.org) contains supplemental Fig. S1.
- AQP4
- aquaporin-4
- OAP
- orthogonal array of particles
- NMO
- neuromyelitis optica
- BN
- blue native
- GFP
- green fluorescent protein
- PBS
- phosphate-buffered saline
- Tricine
- N-[2-hydroxy-1,1-bis(hydroxymethyl)ethyl]glycine
- TIRF
- total internal reflection fluorescence
- FRAP
- fluorescence recovery after photobleaching
- TIS
- translation initiation signal.
REFERENCES
- 1.Frigeri A., Gropper M. A., Turck C. W., Verkman A. S. (1995) Proc. Natl. Acad. Sci. U.S.A. 92, 4328–4331 [DOI] [PMC free article] [PubMed] [Google Scholar]
- 2.Frigeri A., Gropper M. A., Umenishi F., Kawashima M., Brown D., Verkman A. S. (1995) J. Cell Sci. 108, 2993–3002 [DOI] [PubMed] [Google Scholar]
- 3.Ma T., Yang B., Gillespie A., Carlson E. J., Epstein C. J., Verkman A. S. (1997) J. Clin. Invest. 100, 957–962 [DOI] [PMC free article] [PubMed] [Google Scholar]
- 4.Verkman A. S., Binder D. K., Bloch O., Auguste K., Papadopoulos M. C. (2006) Biochim. Biophys. Acta 1758, 1085–1093 [DOI] [PubMed] [Google Scholar]
- 5.Amiry-Moghaddam M., Ottersen O. P. (2003) Nat. Rev. Neurosci. 4, 991–1001 [DOI] [PubMed] [Google Scholar]
- 6.Lu M., Lee M. D., Smith B. L., Jung J. S., Agre P., Verdijk M. A., Merkx G., Rijss J. P., Deen P. M. (1996) Proc. Natl. Acad. Sci. U.S.A. 93, 10908–10912 [DOI] [PMC free article] [PubMed] [Google Scholar]
- 7.Zelenin S., Gunnarson E., Alikina T., Bondar A., Aperia A. (2000) Pediatr. Res. 48, 335–339 [DOI] [PubMed] [Google Scholar]
- 8.Moe S. E., Sorbo J. G., Sogaard R., Zeuthen T., Ottersen O., Holen T. (2008) Genomics 91, 367–377 [DOI] [PubMed] [Google Scholar]
- 9.Neely J. D., Amiry-Moghaddam M., Ottersen O. P., Froehner S. C., Agre P., Adams M. E. (2001) Proc. Natl. Acad. Sci. U.S.A. 98, 14108–14113 [DOI] [PMC free article] [PubMed] [Google Scholar]
- 10.Jung J. S., Bhat R. V., Preston G. M., Guggino W. B., Baraban J. M., Agre P. (1994) Proc. Natl. Acad. Sci. U.S.A. 91, 13052–13056 [DOI] [PMC free article] [PubMed] [Google Scholar]
- 11.Rash J. E., Davidson K. G., Yasumura T., Furman C. S. (2004) Neuroscience 129, 915–934 [DOI] [PMC free article] [PubMed] [Google Scholar]
- 12.Rash J. E., Yasumura T., Hudson C. S., Agre P., Nielsen S. (1998) Proc. Natl. Acad. Sci. U.S.A. 95, 11981–11986 [DOI] [PMC free article] [PubMed] [Google Scholar]
- 13.Verbavatz J. M., Ma T., Gobin R., Verkman A. S. (1997) J. Cell Sci. 110, 2855–2860 [DOI] [PubMed] [Google Scholar]
- 14.Furman C. S., Gorelick-Feldman D. A., Davidson K. G., Yasumura T., Neely J. D., Agre P., Rash J. E. (2003) Proc. Natl. Acad. Sci. U.S.A. 100, 13609–13614 [DOI] [PMC free article] [PubMed] [Google Scholar]
- 15.Yang B., Brown D., Verkman A. S. (1996) J. Biol. Chem. 271, 4577–4580 [PubMed] [Google Scholar]
- 16.Bloch O., Papadopoulos M. C., Manley G. T., Verkman A. S. (2005) J. Neurochem. 95, 254–262 [DOI] [PubMed] [Google Scholar]
- 17.Manley G. T., Fujimura M., Ma T., Noshita N., Filiz F., Bollen A. W., Chan P., Verkman A. S. (2000) Nat. Med. 6, 159–163 [DOI] [PubMed] [Google Scholar]
- 18.Papadopoulos M. C., Manley G. T., Krishna S., Verkman A. S. (2004) FASEB J. 18, 1291–1293 [DOI] [PubMed] [Google Scholar]
- 19.Papadopoulos M. C., Verkman A. S. (2005) J. Biol. Chem. 280, 13906–13912 [DOI] [PubMed] [Google Scholar]
- 20.Saadoun S., Papadopoulos M. C., Davies D. C., Krishna S., Bell B. A. (2002) J. Neurol. Neurosurg. Psychiatry 72, 262–265 [DOI] [PMC free article] [PubMed] [Google Scholar]
- 21.Saadoun S., Papadopoulos M. C., Krishna S. (2003) J. Clin. Pathol. 56, 972–975 [DOI] [PMC free article] [PubMed] [Google Scholar]
- 22.Schotland D. L., Bonilla E., Wakayama Y. (1981) Acta Neuropathol. 54, 189–197 [DOI] [PubMed] [Google Scholar]
- 23.Wakayama Y., Okayasu H., Shibuya S., Kumagai T. (1984) Neurology 34, 1313–1317 [DOI] [PubMed] [Google Scholar]
- 24.Wakayama Y., Kumagai T., Jimi T. (1986) Acta Neuropathol. 72, 130–133 [DOI] [PubMed] [Google Scholar]
- 25.Frigeri A., Nicchia G. P., Verbavatz J. M., Valenti G., Svelto M. (1998) J. Clin. Invest. 102, 695–703 [DOI] [PMC free article] [PubMed] [Google Scholar]
- 26.Frigeri A., Nicchia G. P., Nico B., Quondamatteo F., Herken R., Roncali L., Svelto M. (2001) FASEB J. 15, 90–98 [DOI] [PubMed] [Google Scholar]
- 27.Frydenlund D. S., Bhardwaj A., Otsuka T., Mylonakou M. N., Yasumura T., Davidson K. G., Zeynalov E., Skare O., Laake P., Haug F. M., Rash J. E., Agre P., Ottersen O. P., Amiry-Moghaddam M. (2006) Proc. Natl. Acad. Sci. U.S.A. 103, 13532–13536 [DOI] [PMC free article] [PubMed] [Google Scholar]
- 28.Lennon V. A., Kryzer T. J., Pittock S. J., Verkman A. S., Hinson S. R. (2005) J. Exp. Med. 202, 473–477 [DOI] [PMC free article] [PubMed] [Google Scholar]
- 29.Lennon V. A., Wingerchuk D. M., Kryzer T. J., Pittock S. J., Lucchinetti C. F., Fujihara K., Nakashima I., Weinshenker B. G. (2004) Lancet 364, 2106–2112 [DOI] [PubMed] [Google Scholar]
- 30.Matsuoka T., Matsushita T., Kawano Y., Osoegawa M., Ochi H., Ishizu T., Minohara M., Kikuchi H., Mihara F., Ohyagi Y., Kira J. (2007) Brain 130, 1206–1223 [DOI] [PubMed] [Google Scholar]
- 31.Misu T., Fujihara K., Kakita A., Konno H., Nakamura M., Watanabe S., Takahashi T., Nakashima I., Takahashi H., Itoyama Y. (2007) Brain 130, 1224–1234 [DOI] [PubMed] [Google Scholar]
- 32.Roemer S. F., Parisi J. E., Lennon V. A., Benarroch E. E., Lassmann H., Bruck W., Mandler R. N., Weinshenker B. G., Pittock S. J., Wingerchuk D. M., Lucchinetti C. F. (2007) Brain 130, 1194–1205 [DOI] [PubMed] [Google Scholar]
- 33.Takahashi T., Fujihara K., Nakashima I., Misu T., Miyazawa I., Nakamura M., Watanabe S., Shiga Y., Kanaoka C., Fujimori J., Sato S., Itoyama Y. (2007) Brain 130, 1235–1243 [DOI] [PubMed] [Google Scholar]
- 34.Nicchia G. P., Mastrototaro M., Rossi A., Pisani F., Tortorella C., Ruggieri M., Lia A., Trojano M., Frigeri A., Svelto M. (2009) Glia 57, 1363–1373 [DOI] [PubMed] [Google Scholar]
- 35.Yang B., van Hoek A. N., Verkman A. S. (1997) Biochemistry 36, 7625–7632 [DOI] [PubMed] [Google Scholar]
- 36.van Hoek A. N., Ma T., Yang B., Verkman A. S., Brown D. (2000) Am. J. Physiol. Renal Physiol. 278, F310–F316 [DOI] [PubMed] [Google Scholar]
- 37.Silberstein C., Bouley R., Huang Y., Fang P., Pastor-Soler N., Brown D., Van Hoek A. N. (2004) Am. J. Physiol. Renal Physiol. 287, F501–F511 [DOI] [PubMed] [Google Scholar]
- 38.Amiry-Moghaddam M., Frydenlund D. S., Ottersen O. P. (2004) Neuroscience 129, 999–1010 [DOI] [PubMed] [Google Scholar]
- 39.Crane J. M., Van Hoek A. N., Skach W. R., Verkman A. S. (2008) Mol. Biol. Cell 19, 3369–3378 [DOI] [PMC free article] [PubMed] [Google Scholar]
- 40.Nicchia G. P., Cogotzi L., Rossi A., Basco D., Brancaccio A., Svelto M., Frigeri A. (2008) J. Neurochem. 105, 2156–2165 [DOI] [PubMed] [Google Scholar]
- 41.Nicchia G. P., Rossi A., Nudel U., Svelto M., Frigeri A. (2008) Glia 56, 869–876 [DOI] [PubMed] [Google Scholar]
- 42.Umenishi F., Verkman A. S. (1998) Genomics 50, 373–377 [DOI] [PubMed] [Google Scholar]
- 43.Kozak M. (2007) J. Cell Biochem. 102, 280–290 [DOI] [PubMed] [Google Scholar]
- 44.Kozak M. (1999) Gene 234, 187–208 [DOI] [PubMed] [Google Scholar]
- 45.Kozak M. (2005) Gene 361, 13–37 [DOI] [PubMed] [Google Scholar]
- 46.Nicchia G. P., Frigeri A., Liuzzi G. M., Svelto M. (2003) FASEB J. 17, 1508–1510 [DOI] [PubMed] [Google Scholar]
- 47.Nicchia G. P., Srinivas M., Li W., Brosnan C. F., Frigeri A., Spray D. C. (2005) FASEB J. 19, 1674–1676 [DOI] [PubMed] [Google Scholar]
- 48.Wittig I., Braun H. P., Schägger H. (2006) Nat. Protoc. 1, 418–428 [DOI] [PubMed] [Google Scholar]
- 49.Sorbo J. G., Moe S. E., Ottersen O. P., Holen T. (2008) Biochemistry 47, 2631–2637 [DOI] [PubMed] [Google Scholar]
- 50.Crane J. M., Verkman A. S. (2009) J. Cell Sci. 122, 813–821 [DOI] [PMC free article] [PubMed] [Google Scholar]
- 51.Hasegawa H., Ma T., Skach W., Matthay M. A., Verkman A. S. (1994) J. Biol. Chem. 269, 5497–5500 [PubMed] [Google Scholar]
- 52.Umenishi F., Verkman A. S., Gropper M. A. (1996) DNA Cell Biol. 15, 475–480 [DOI] [PubMed] [Google Scholar]
- 53.Neely J. D., Christensen B. M., Nielsen S., Agre P. (1999) Biochemistry 38, 11156–11163 [DOI] [PubMed] [Google Scholar]
- 54.Saadoun S., Papadopoulos M. C., Watanabe H., Yan D., Manley G. T., Verkman A. S. (2005) J. Cell Sci. 118, 5691–5698 [DOI] [PubMed] [Google Scholar]
- 55.Auguste K. I., Jin S., Uchida K., Yan D., Manley G. T., Papadopoulos M. C., Verkman A. S. (2007) FASEB J. 21, 108–116 [DOI] [PubMed] [Google Scholar]
Associated Data
This section collects any data citations, data availability statements, or supplementary materials included in this article.