

Abstract
Aberrant CpG island methylation contributes to the pathogenesis of various malignancies. However, little is known about the association of epigenetic abnormalities with multistep tumorigenic events in adult T cell leukemia/lymphoma (ATLL). To determine whether epigenetic abnormalities induce the progression of ATLL, we analyzed the methylation profiles of the SHP1, p15, p16, p73, HCAD, DAPK, hMLH-1, and MGMT genes by methylation specific PCR assay in 65 cases with ATLL patients. The number of CpG island methylated genes increased with disease progression and aberrant hypermethylation in specific genes was detected even in HTLV-1 carriers and correlated with progression to ATLL. The CpG island methylator phenotype (CIMP) was observed most frequently in lymphoma type ATLL and was also closely associated with the progression and crisis of ATLL. The high number of methylated genes and increase of CIMP incidence were shown to be unfavorable prognostic factors and correlated with a shorter overall survival by Kaplan-Meyer analysis. The present findings strongly suggest that the multistep accumulation of aberrant CpG methylation in specific target genes and the presence of CIMP are deeply involved in the crisis, progression, and prognosis of ATLL, as well as indicate the value of CpG methylation and CIMP for new diagnostic and prognostic biomarkers.
Adult T cell leukemia/lymphoma (ATLL) is an aggressive malignant disease of CD4-positive T lymphocytes caused by infection with human T-lymphotropic virus type I (HTLV-1).1–3 HTLV-1 causes ATLL in 3% to 5% of infected individuals after a long latent period of 40 to 60 years.4 Advanced acute ATLL has a poor prognosis. ATLL is divided into four stages: smoldering, chronic, lymphoma, and acute types.5 The smoldering and chronic types are indolent, but the acute and lymphoma types are aggressive ATLL characterized by resistance to chemotherapy and a poor prognosis.5,6 Such a long latent period suggests that a multistep leukemogenic/lymphomagenic mechanism is involved in the development of ATLL, although the critical events in the progression have not been characterized. The pathogenesis of HTLV-1 has been investigated intensively in terms of the viral regulatory protein HTLV-1 Tax or Rex, which is supposed to play key roles in the HTLV-1 leukemogenesis/lymphomagenesis, as well as the recently discovered HTLV-1 basic leucine zipper factor.6–8 We and others have reported the progression mechanism of ATLL from various genetic aspects, including specific chromosome abnormalities,9–14 changes of characteristic HTLV-1 Tax and Rex protein expression pattern,14 and aberrant expression of the SHP1,10,15 p53,16,17 MEL1S,17 DRS,18 and ASY/Nogo19 genes, although, the detailed mechanism triggering the onset and progression of ATLL remains to be elucidated.
On the other hand, epigenetic aberration processes have been recognized to play another important role in carcinogenesis.20,21 The aberrant hypermethylation of CpG islands within the promoter and 5′-regions of genes is the most widely studied epigenetic abnormality in cancer and is associated with loss of gene function. Target genes of aberrant hypermethylation of CpG islands seem to be tumor type-specific22,23 and current efforts are concentrated on finding ways to exploit the diagnostic and therapeutic implications of these abnormalities.24,25 A comprehensive knowledge of the methylation profile of a given tumor may provide important information for risk assessment, diagnosis, monitoring, and treatments.20,26
Recently, we have reported that a frequent epigenetic aberration of DNA hypermethylation associated with the SHP1 gene silencing has been identified in a wide range of hematopoietic malignancies.15,27 SHP1 is a nonreceptor type protein-tyrosine phosphatase, which acts as a negative regulator in hematopoietic cells. A decrease or loss of the SHP1 gene expression may be related to the malignant transformation in lymphoma and leukemia cells.15,27
Multiple genes have recently been shown to be methylated simultaneously (a condition termed CpG island methylator phenotype: CIMP)28,29 in various types of human malignancies. This mechanism is a fundamental process involved in the development of many tumors. However, analysis of CIMP in leukemia/lymphoma is limited,30 and CIMP status has not yet been elucidated in ATLL.
Our goal in the current study was to clarify the contribution of epigenetic abnormalities to disease development and progression. We comparatively evaluated the methylation status of eight genes in four stages of ATLL: smoldering, chronic, lymphoma, and acute types, HTLV-1 carriers and healthy donor peripheral blood mononuclear cells (PBMCs). In addition, we addressed the questions of whether CIMP is associated with ATLL development and/or progression and if HTLV-1 infection induces aberrant DNA hypermethylation in HTLV-1 carriers.
Materials and Methods
Patients
PBMCs or lymph node tissues were collected from 16 healthy volunteers and 65 patients with HTLV-1 carrier (n = 10), smoldering type (n = 15), chronic type (n = 5), acute type (n = 15), and lymphoma type ATLL (n = 20). These samples were collected at the Department of Pathology & Oncology, Graduate School of Medicine, Dentistry, and Pharmaceutical Sciences, Okayama University as the collaboration with Okayama University Hospital, Fukuoka University Hospital and Imamura Bun-in Hospital. Informed consent was obtained from all of the patients. This study was approved by the Institutional Review Board at Graduate School of Medicine, Dentistry, and Pharmaceutical Sciences, Okayama University and related hospitals, in accordance with the Declaration of Helsinki. The mean and SD of age (years) in each group was as follows; healthy volunteers, 40.1 ± 11.3; HTLV-1 carrier, 48.2 ± 11.4; smoldering-, 57.1 ± 9.7; chronic-, 54.4 ± 13.9; acute-, 60.8 ± 9.0; and lymphoma-type ATLL, 65.5 ± 13.3. The mean age of healthy volunteers was matched with that of HTLV-1 carriers to eliminate the possibility of DNA methylation by aging. The diagnosis of ATLL was based on the clinical features, hematological characteristics, and monoclonal integrations of the HTLV-1 provirus by Southern blot analyses.5 HTLV-1 proviral DNA load was determined by real time PCR as described.31 The mononuclear cell fraction was isolated by Ficoll/Hypaque according to the manufacturer's protocol. Genomic DNA was isolated using QIAamp DNA Mini Kit (QIAGEN GmbH., Germany).
Methylation-Specific PCR
The methylation status of the SHP1, p15, p16, p73, HCAD, DAPK, hMLH-1, and MGMT genes were analyzed using a methylation-specific polymerase chain reaction (MSP) assay. These genes include negative regulators of the Jak/STAT signaling pathway (SHP1), tumor suppressor genes associated with the cell cycle (p15, p16, p73), cell adhesion and metastasis processes (HCAD), apoptosis (DAPK), and DNA repair (hMLH-1, MGMT) related genes. After bisulfite-treatment, genomic DNA was amplified by PCR using unmethylated (U) or methylated (M) DNA specific primer sets (Table 1).15,32 Nested PCR was performed for the SHP-1, p16, and HCAD genes.
Table 1.
Primer Sequences and PCR Conditions for MSP Analysis
| Genes | Primer sequences forward | Primer sequences reverse | Product size (bp) | AT °C | No. of cycles |
|---|---|---|---|---|---|
| p15 | |||||
| U | 5′-TGTGATGTGTTTGTATTTTGTGGTT-3′ | 5′-CCATACAATAACCAAACAACCAA-3′ | 148 | 60 | 40 |
| M | 5′-GCGTTCGTATTTTGCGGTT-3′ | 5′-CGTACAATAACCGAACGACCGA-3′ | 154 | 64 | 40 |
| p73 | |||||
| U | 5′-AGGGGATGTAGTGAAATTGGGGTTT-3′ | 5′-ATCACAACCCCAAACATCAACATCCA-3′ | 69 | 66 | 35 |
| M | 5′-GGACGTAGCGAAATCGGGGTTC-3′ | 5′-ACCCCGAACATCGACGTCCG-3′ | 60 | 63 | 35 |
| DAPK | |||||
| U | 5′-GGAGGATAGTTGGATTGAGTTAATGTT-3′ | 5′-CAAATCCCTCCCAAACACCAA-3′ | 106 | 64 | 35 |
| M | 5′-GGATAGTCGGATCGAGTTAACGTC-3′ | 5′-CCCTCCCAAACGCCGA-3′ | 98 | 64 | 35 |
| hMLH1 | |||||
| U | 5′-TTTTGATGTAGATGTTTTATTAGGGTTGT-3′ | 5′-ACCACCTCATCATAACTACCCACA-3′ | 124 | 60 | 35 |
| M | 5′-ACGTAGACGTTTTATTAGGGTCGC-3′ | 5′-CCTCATCGTAACTACCCGCG-3′ | 153 | 60 | 35 |
| MGMT | |||||
| U | 5′-TTTGTGTTTTGATGTTTGTAGGTTTTTGT-3′ | 5′-AACTCCACACTCTTCCAAAAACAAAACA-3′ | 91 | 66 | 35 |
| M | 5′-TTTCGACGTTCGTAGGTTTTCGC-3′ | 5′-GCACTCTTCCGAAAACGAAACG-3′ | 81 | 66 | 35 |
| SHP1 | |||||
| 1st | 5′-GGGTTGTGGTGAGAAATTAATTAG-3′ | 5′-CCTCAAATACAACTCCCAATACC-3′ | 64 | 35 | |
| U | 5′-GGATTGTTTGGGTTTGTATGTGT-3′ | 5′-AACAAAAAAAAACACAACCAACCC-3′ | 250 | 64 | 25 |
| M | 5′-GGATCGTTTGGGTTCGTATGC-3′ | 5′-ACAAAAAAAAACGCGACCGACC-3′ | 251 | 64 | 25 |
| p16 | |||||
| 1st | 5′-CAGAGGGTGGGGCGGACCGC-3′ | 5′-CGGGCCGCGGCCGTGG-3′ | 54 | 35 | |
| M | 5′-TTATTAGAGGGTGGGGTGGATTGT-3′ | 5′-CAACCCCAAACCACAACCATAA-3′ | 151 | 69 | 25 |
| U | 5′-TTATTAGAGGGTGGGGCGGATCGC-3′ | 5′-GACCCCGAACCGCGACCGTAA-3′ | 150 | 69 | 21 |
| HCAD | |||||
| 1st | 5′-TTGGAAAAGTGGAATTAGTTGG-3′ | 5′-CCTCTTCCCTACCTAAAACA-3′ | 54 | 35 | |
| U | 5′-GTAAAATGAGGGAGTGTTAGG-3′ | 5′-AAACACACCCAACAACCCCTCT-3′ | 260 | 50 | 25 |
| M | 5′-TCGCGGGGTTCGTTTTTCGC-3′ | 5′-GACGTTTTCATTCATACACGCG-3′ | 243 | 69 | 25 |
*U, unmethylated sequences; M, methylated sequences; AT, annealing temperatures.
PCR was performed using the following cycling conditions: 95°C for 10 minutes, at 94°C for 30 s, an annealing step for 1 minute, and an extension step at 72°C for 1 minute followed by a final extension step of 72°C for 7 minutes, with 20 μl of reaction mixture including 0.4 μmol/L each primer, 1 μl of bisulfite-treated DNA, 1× PCR gold buffer, 200 μmol/L of each dNTP, 1.5 mmol/L MgCl2, and 0.5 units of AmpliTaq Gold DNA polymerase (Applied Biosystems, Foster, CA).
To determine the methylation status, DNA methylation was standardized using a DNA specimen from PBMCs of healthy volunteers as the negative control in each experiment. CpGenome Universal Methylated DNA (Chemicon International Inc., Temecula, CA) or DNA from healthy PBMCs treated with SssI methylase (New England BioLabs Inc., Beverly, MA) were used as methylation-positive control. The SssI methylase reaction was performed in a total volume of 400 μl with 2 μg of genomic DNA, 40 μl NEB buffer 2, 2 μl SAM (32 mmol/L SAM), and 8 units SssI methylase at 37°C for 24 hours.
DNA Bisulfite Sequencing
The PCR products were cloned to pCR2.1-TOPO (Invitrogen, Carlsbad, CA). Independent plasmid clones were purified from several bacterial colonies, and were subjected to a sequencing reaction with BigDye Terminator Cycle Sequencing Ready Reaction kit V2.0 (Applied Biosystems, Foster City, CA) and applied on ABI Prism 3100 DNA sequencer (Applied Biosystems, Foster City, CA).
Flow Cytometry
PBMCs obtained from patients with HTLV-1 carrier and acute type ATLL were analyzed using antibodies of mouse phycoerythrin-conjugated anti-CD4 (clone RPA-74; eBiosciences, San Diego, CA), allophycocyanin-conjugated anti-CD25 (eBiosciences, San Diego, CA). Flow cytometry was performed with FACSAria (BD Biosciences, NJ) using FlowJo (Tree Star, Inc. Ashland, OR) software.
Immunohistochemistry
Specimens obtained from patients with ATLL were processed routinely by fixation in 10% formaldehyde and embedding in paraffin. Immunohistological examination used a panel of antibodies specific for SHP1 (C19; affinity purified rabbit polyclonal antibody against the c-terminus of human SHP1; Santa Cruz, CA), p16 (Ab-4 clone 16P04; mouse monoclonal antibody against full length human p16, Thermo Scientific, CA), and CD4 (clone 4B12; mouse monoclonal antibody, MBL, Japan), CD25 (clone 4C9; mouse monoclonal antibody, Novocastra, UK). Immunohistochemical staining was performed as described previously.27 We used the normal reactive lymph node as a positive control for SHP1, CD4, and CD25, and endocervical squamous cell carcinoma as a positive control for p16.
Triple-staining of fluorescent immunohistochemistry for SHP1, CD25, and Haexist33258 were performed to skin and lymph node specimens obtained from smoldering or chronic type ATLL, comparing with lymph node specimens from lymphoma type ATLL. The following secondary antibodies were used: goat Alexa fluor 488-conjugated anti-rabbit IgG (Molecular Probes, Eugene, CA) for detection of rabbit anti-SHP1 IgG, goat Alexa fluor 555-conjugated anti-mouse IgG (Molecular Probes, Eugene, CA) for mouse anti-human CD25 IgG. Haexist33258 (Sigma-Aldrich, Japan) was used to counterstain the cell nuclei.
Statistical Analyses
The methylation frequencies between the two phases were analyzed using Fisher's exact tests. The methylated genes of each phase were compared using the two-sample Mann-Whitney's U-tests. The overall survival was analyzed by Kaplan–Meyer method and then it was compared using the log-rank test. For all tests, probability values of P < 0.05 were regarded as statistically significant. The program SPSS for Windows, Release 11.5 was used for the statistical analysis.
Results
Sensitivity and Accuracy of MSP/UMSP Analyses
The methylation status of the SHP1, p15, p16, p73, HCAD, DAPK, hMLH-1, and MGMT genes were analyzed by MSP assay in normal PBMCs (n = 16), HTLV-1 carriers (n = 10), smoldering type (n = 15), chronic type (n = 5), acute type (n = 15), and lymphoma type ATLL (n = 20). Representative results of the MSP assay are shown in Figure 1A. To assess the sensitivity of MSP (Methylation Specific PCR)/UMSP (Un-methylation Specific PCR) in the present experimental condition, various template DNA ratio of ATLL neoplastic cell line ED40515 (−), showing strong CpG island hypermethylation of the SHP1 gene to normal PBMCs without methylation of that gene from 100, 10, 1, 0.1, 0.01, 0.001 to 0% was analyzed by bisulfite sequencing analysis, thus showing that present system of MSP/UMSP has the sensitivity to detect a 0.01% presence of ATLL neoplastic cell ED40515 (−) among normal PBMCs (Figure 1, B–D). Next, we investigated the possibility whether different proportions of HTLV-1 infected cells and/or neoplastic cells among carrier stage, smoldering type, chronic type, acute type, and lymphoma type ATLL may affect on the difference of MSP/UMSP, HTLV-1 viral load and atypical lymphocytes content analyses were performed as well as flow cytometry analysis (Figure 1, E–G). Representative HTLV-1 carriers (n = 3) and acute type ATLL (n = 3) specimens were selected, showing HTLV-1 viral load to 3.85, 4.85, and 0.02 copies/100 PBMCs in HTLV-1 carriers and 95.58, 97.68, and 27.70 copies/100 PBMCs in acute type ATLL specimens respectively. Atypical lymphocyte contents were 3%, 4%, and 2% in HTLV-1 carriers and 94%, 92%, and 19% in acute type ATLL in each specimen. Typical flow cytometric analyses showed that CD4+CD25+ T cells fraction, which was enriched with HTLV-1 infected cells and/or neoplastic ATLL cells, contained 12.5 times higher number of cells in acute type ATLL patient #11 (85.52%) than in HTLV-1 carrier #9 (6.85%). These data indicate that acute type ATLL specimens contain HTLV-1 infected cells and/or neoplastic ATLL cells about 10 to 50 times more than in HTLV-1 carrier specimens. To estimate the effect of content of HTLV-1 infected cells and/or neoplastic ATLL cells on MSP/UMSP, specimens of acute type ATLL were diluted to about 1% content of neoplastic ATLL cells with normal PBMCs, which was less than the content of HTLV-1 infected cells in carrier specimens (Figure 1, E–G). Results of MSP/UMSP showed that MSP signals in diluted acute type ATLL specimens were almost as strong as those in original acute type ATLL specimens in contrast to no signals in HTLV-1 carrier specimens. This clearly indicated that the different content of HTLV-1 infected cells and/or neoplastic ATLL cells among HTLV-1 carriers and various types of ATLL specimens has no prominent effect on MSP/UMSP signal strength in the present conditions. Some cases of HTLV-1 carriers and indolent type ATLL specimen showed faint or intermediate signals with MSP/UMSP analyses. One of these specimens of HTLV-1 carriers was analyzed with bisulfite sequencing, showing that many clones contained several methylated CpG sites. It is quite different methylation profile compared with that of normal PBMCs (Figure 1H).
Figure 1.

MSP and UMSP analysis of normal PBMC, HTLV-1 carriers, and ATLL patients. A: Representative results of MSP/UMSP of ATLL specimens; PBMC (SssI) was used as a positive control; healthy volunteer PBMC used as negative control; U, unmethylated DNA; and M, methylated DNA. PCR products’ sizes are shown on the right. The number on each lane indicates patients’ specimen number. B: To evaluate the sensitivity of MSP/UMSP in the present condition, various template DNA ratio of ATLL tumor cell line ED40515(−), showing hypermethylation of the SHP1 gene, to normal PBMC without methylation of that gene from 100, 10, 1, 0.1, 0.01, 0.001, to 0%, analyzed by MSP/UMSP. C: The results of a bisulfite sequencing analysis of ED40515(−) and healthy PBMC: filled box is methylated and open box is unmethylated. Horizontal axis shows the CpG sites and vertical axis shows the patient specimen. D: Representative data of bisulfite sequencing. E: To evaluate the effects of HTLV-1 infected cells and/or neoplastic ATLL cells content on MSP/UMSP, specimens of acute type ATLL were diluted to about 1% content of neoplastic ATLL cells with normal PBMCs, which was less than the content of HTLV-1 infected cells in carrier specimens. HTLV-1 viral load, white blood cell counts, and content of atypical lymphocytes (%) of each carrier and acute type ATLL specimen were summarized. F: The typical results of flow cytometry showed that CD4+CD25+ T cells, which was enriched with HTLV-1 infected cells and/or neoplastic ATLL cells, were contained in acute type ATLL patient #11 (85.52%) and in HTLV-1 carrier #9 (6.85%) specimens. G: Summary of the clinical data including HTLV-1 viral load, white blood cell counts, and content of atypical lymphocytes in HTLV-1 carriers and acute type ATLL specimen. H: Results of a bisulfite sequencing analysis of the SHP1 gene with HTLV-1 carrier specimen, which showed faint signal in MSP analysis. Filled box, methylated; open box, unmethylated. Horizontal axis shows the CpG sites and vertical axis shows the patient specimen.
Aberrant CpG Methylation during the Progression of ATLL
The methylation profile of the SHP1, p15, p16, p73, HCAD, DAPK, hMLH-1, and MGMT genes was summarized in Table 2. Normal PBMC from 16 healthy volunteers showed negative signals of DNA methylation in every gene except for faint methylation-positive signals of the p15 (15.4% [2/13]) and HCAD genes (30.8% [4/13]). An overview of the methylation profile presented the characteristic pattern, showing that the total number of methylated genes gradually increased from healthy donors to HTLV-1 carrier, smoldering type, chronic type, acute type, and lymphoma type ATLL (Table 2). This tendency was more prominent in the distribution of the number of CpG island methylated genes among these categories, indicating that distribution profile shifted from a small number of methylated genes to larger numbers according to the progression from healthy volunteer to HTLV-1 carrier, indolent (smoldering and chronic) type and aggressive (acute and lymphoma) type of ATLL (Figure 2). Moreover, the average number of methylated genes significantly increased according to the progression of the ATLL stages: from 0.5 genes in normal PBMC to1.6 genes in HTLV-1 carrier, 2.2 in smoldering type, 3.2 in chronic type, 2.6 in acute type, and 3.9 genes in lymphoma type- ATLL (P < 0.05, Mann-Whitney's U-test.). Specifically, the CpG island methylation frequency of the SHP1 gene clearly increased from 0% (0/16) in normal PBMC to 30% (3/10) in HTLV-1 carrier, 20% (3/15) in smoldering type, 60% (3/5) in chronic type, 80% (12/15) in acute type, and 90% (18/20) in lymphoma type-ATLL (Table 2).
Table 2.
Methylation Profile of Eight Genes in Normal PBMC, HTLV- I Carrier, and Various Types of ATLL
| Normal PBMC (n = 16) | ||||||||||
|---|---|---|---|---|---|---|---|---|---|---|
| Age | Sex | SHP1 | p15 | p16 | p73 | hMLH1 | MGMT | DAPK | HCAD | CIMP |
| 49 | M | |||||||||
| 46 | M | |||||||||
| 31 | M | |||||||||
| 29 | F | |||||||||
| 26 | F | + | ||||||||
| 29 | F | + | + | |||||||
| 27 | F | |||||||||
| 54 | M | + | ||||||||
| 43 | M | + | ||||||||
| 30 | F | |||||||||
| 29 | F | + | ||||||||
| 52 | M | + | ||||||||
| 43 | M | |||||||||
| 56 | F | |||||||||
| 57 | F | + | ||||||||
| 40 | M | + | ||||||||
| % methylation | 0% | 19% | 0% | 0% | 0% | 0% | 0% | 38% | 0% | |
| (0/16) | (3/16) | (0/16) | (0/16) | (0/16) | (0/16) | (0/16) | (6/16) | (0/16) | ||
| HTLV-1 carrier (n = 10) | ||||||||||
| 50 | F | |||||||||
| 52 | F | + | ||||||||
| 38 | M | + | ||||||||
| 49 | M | + | ||||||||
| 57 | M | + | ||||||||
| 42 | M | + | ||||||||
| 72 | F | + | ||||||||
| 34 | F | + | + | + | + | |||||
| 36 | M | + | + | + | + | |||||
| 52 | F | + | + | + | + | + | ||||
| % methylation | 30% | 20% | 0% | 30% | 10% | 20% | 20% | 30% | 30% | |
| (3/10) | (2/10) | (0/10) | (3/10) | (1/10) | (2/10) | (2/10) | (3/10) | (3/10) | ||
| Smoldering type (n = 15) | ||||||||||
| 66 | M | + | ||||||||
| 56 | F | + | ||||||||
| 62 | F | + | ||||||||
| 53 | M | + | ||||||||
| 48 | F | + | + | |||||||
| 43 | F | + | + | |||||||
| 63 | M | + | + | |||||||
| 54 | M | + | + | |||||||
| 48 | F | + | + | |||||||
| 51 | F | + | + | |||||||
| 58 | M | + | + | + | + | |||||
| 55 | F | + | + | + | + | |||||
| 79 | M | + | + | + | + | |||||
| 49 | F | + | + | + | + | |||||
| 71 | M | + | + | + | + | + | + | |||
| % methylation | 20% | 27% | 13% | 7% | 0% | 7% | 47% | 100% | 33% | |
| (3/15) | (4/15) | (2/15) | (1/15) | (0/15) | (1/15) | (7/15) | (15/15) | (5/15) | ||
| Chronic type (n = 5) | ||||||||||
| 64 | M | + | ||||||||
| 68 | M | + | + | + | + | |||||
| 34 | F | + | + | + | + | + | ||||
| 47 | M | + | + | + | + | + | ||||
| 59 | F | + | + | + | + | + | ||||
| % methylation | 60% | 40% | 0% | 40% | 0% | 40% | 60% | 100% | 80% | |
| (3/5) | (2/5) | (0/5) | (1/5) | (0/5) | (2/5) | (3/5) | (5/5) | (4/5) | ||
| Acute type (n = 15) | ||||||||||
| 60 | F | |||||||||
| 64 | M | + | + | |||||||
| 60 | M | + | ||||||||
| 58 | M | + | + | |||||||
| 73 | M | + | + | |||||||
| 45 | F | + | + | |||||||
| 65 | F | + | + | |||||||
| 47 | F | + | + | + | + | |||||
| 67 | F | + | + | + | + | |||||
| 67 | F | + | + | + | + | |||||
| 53 | F | + | + | + | + | |||||
| 53 | F | + | + | + | + | |||||
| 55 | F | + | + | + | + | + | ||||
| 72 | M | + | + | + | + | + | ||||
| 73 | M | + | + | + | + | + | + | |||
| % methylation | 80% | 20% | 0% | 0% | 20% | 0% | 53% | 87% | 53% | |
| (12/15) | (3/15) | (0/15) | (0/15) | (3/15) | (0/15) | (8/15) | (13/15) | (8/15) | ||
| Lymphoma type (n = 20) | ||||||||||
| 47 | M | + | ||||||||
| 70 | M | + | + | |||||||
| 47 | M | + | + | + | + | |||||
| 74 | M | + | + | + | + | |||||
| 70 | M | + | + | + | + | |||||
| 59 | F | + | + | + | + | |||||
| 41 | M | + | + | + | + | |||||
| 64 | F | + | + | + | + | |||||
| 77 | M | + | + | + | + | |||||
| 57 | M | + | + | + | + | + | ||||
| 36 | F | + | + | + | + | + | ||||
| 74 | M | + | + | + | + | + | ||||
| 47 | M | + | + | + | + | + | ||||
| 67 | M | + | + | + | + | + | ||||
| 69 | M | + | + | + | + | + | + | |||
| 82 | F | + | + | + | + | + | + | |||
| 48 | F | + | + | + | + | + | + | |||
| 67 | F | + | + | + | + | + | + | + | ||
| 58 | M | + | + | + | + | + | + | + | ||
| 75 | M | + | + | + | + | + | + | + | ||
| % methylation | 90% | 20% | 40% | 15% | 5% | 45% | 80% | 90% | 90% | |
| (18/20) | (4/20) | (8/20) | (3/20) | (1/20) | (9/20) | (16/20) | (18/20) | (18/20) | ||
| Total % methylation | SHP1 | p15 | p16 | p73 | hMLH1 | MGMT | DAPK | HCAD | CIMP | |
| 60% | 23% | 15% | 12% | 8% | 22% | 55% | 63% | 58% | ||
| (39/65) | (15/65) | (10/65) | (8/65) | (5/65) | (14/65) | (36/65) | (41/65) | (38/65) | ||
The methylation profile, showing the + represents methylated specimens, while the blank columns represent unmethylated specimens. M, male; F, female.
Figure 2.
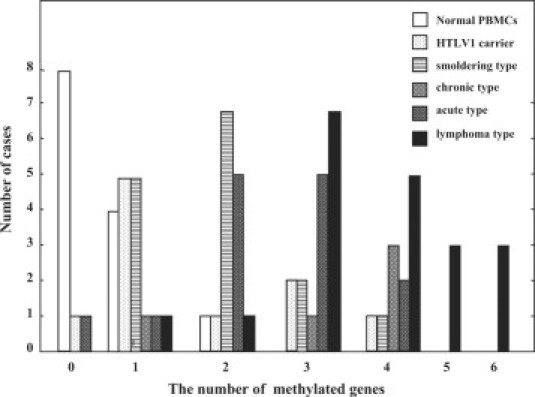
Distribution of the number of methylated genes in normal PBMC, HTLV-1 carrier, smoldering-, chronic-, acute-, and lymphoma-type ATLL.
Specific Gene Methylation During Progression of ATLL
Next, statistical significance of the differences in methylation frequencies in each gene between two clinical stages of ATLL was analyzed in detail using Fisher's exact test (Table 3). This demonstrated that the methylation frequency of several specific genes showed statistically significant differences between two clinical stages. The SHP1 and p73 genes were methylated at the stage of infection to become a HTLV-1 carrier from healthy individual (P < 0.046). The SHP1 gene was significantly highly methylated at the crisis of ATLL from the carrier state to acute type or lymphoma type ATLL and also during the disease progression from the smoldering to aggressive type: acute type or lymphoma type ATLL (P < 0.05). The HCAD gene was statistically significantly hypermethylated at the crisis of indolent and aggressive type of ATLL from the carrier state (P < 0.05). For the DAPK, p16, and MGMT genes, these genes were hypermethylated during the progression to lymphoma type ATLL. It is noteworthy that the methylation profile of lymphoma type ATLL was quite different from that of acute type; the p16 (40%, 8/20) and MGMT (45%, 9/20) genes were specifically hypermethylated in lymphoma type ATLL, on the other hand, none of them (0%, 0/15) were methylated in acute type ATLL (Tables 2 and 3). CIMP was defined as the presence of more than or equal to three methylated genes among the eight genes investigated, according to the distribution of the number of methylated genes (Figure 2). CIMP was detected in 0% (0/16) of normal PBMC, 30% (3/10) of HTLV-1 carrier, 33% (5/15) of smoldering type ATLL, 80% (4/5) of chronic type ATLL, 53% (8/15) of acute type ATLL, and 90% (18/20) of lymphoma type ATLL (Table 2). The incidence of CIMP in lymphoma type ATLL was significantly higher than that in HTLV-1 carrier, smoldering type- and acute type-ATLL (P < 0.05, Fisher's exact test), thus indicating that CIMP was associated with the progression to lymphoma type ATLL (Table 2, Table 4). In addition, the correlation between presence of CIMP and specific gene methylation was investigated, thus revealing that the methylation of the SHP1, p16, DAPK, p15, and HCAD genes closely correlated with the incidence of CIMP (P < 0.05, Fisher's exact test; Table 4). This indicates that the methylation of these genes strongly contributes to the presence of CIMP.
Table 3.
Correlation between Methylation of Eight Genes and Progression of ATLL
|
SHP1 |
p16 |
DAPK |
hMLH1 |
MGMT |
p73 |
p15 |
HCAD |
|||||||||
|---|---|---|---|---|---|---|---|---|---|---|---|---|---|---|---|---|
| M | U | M | U | M | U | M | U | M | U | M | U | M | U | M | U | |
| Normal PBMC | 0 | 16 | 0 | 16 | 0 | 16 | 0 | 16 | 0 | 16 | 0 | 16 | 3 | 13 | 6 | 10 |
| HTLV-I carrier | 3 | 7 | 0 | 10 | 2 | 8 | 1 | 9 | 2 | 8 | 3 | 7 | 2 | 8 | 3 | 7 |
| P value | 0.046 | − | 0.138 | 0.385 | 0.138 | 0.046 | 1.000 | 1.000 | ||||||||
| Normal PBMC | 0 | 16 | 0 | 16 | 0 | 16 | 0 | 16 | 0 | 16 | 0 | 16 | 3 | 13 | 6 | 10 |
| Smoldering type | 3 | 12 | 2 | 13 | 7 | 8 | 0 | 15 | 1 | 14 | 1 | 14 | 4 | 11 | 15 | 0 |
| P value | 0.101 | 0.226 | 0.002 | − | 0.484 | 0.484 | 0.685 | 0.000 | ||||||||
| Normal PBMC | 0 | 16 | 0 | 16 | 0 | 16 | 0 | 16 | 0 | 16 | 0 | 16 | 3 | 13 | 6 | 10 |
| Chronic type | 3 | 2 | 0 | 5 | 3 | 2 | 0 | 5 | 2 | 3 | 1 | 4 | 2 | 3 | 5 | 0 |
| P value | 0.006 | − | 0.006 | − | 0.048 | 0.238 | 0.553 | 0.035 | ||||||||
| Normal PBMC | 0 | 16 | 0 | 16 | 0 | 16 | 0 | 16 | 0 | 16 | 0 | 16 | 3 | 13 | 6 | 10 |
| Acute type | 12 | 3 | 0 | 17 | 8 | 7 | 3 | 12 | 0 | 15 | 0 | 15 | 3 | 12 | 13 | 2 |
| P value | 0.000 | − | 0.001 | 0.101 | − | − | 1.000 | 0.009 | ||||||||
| Normal PBMC | 0 | 16 | 0 | 16 | 0 | 16 | 0 | 16 | 0 | 16 | 0 | 16 | 3 | 13 | 6 | 10 |
| Lymphoma type | 18 | 2 | 8 | 12 | 16 | 4 | 1 | 19 | 9 | 11 | 3 | 17 | 4 | 16 | 18 | 2 |
| P value | 0.001 | 0.005 | 0.000 | 1.000 | 0.002 | 0.557 | 0.675 | 0.045 | ||||||||
| HTLV-I carrier | 3 | 7 | 0 | 10 | 2 | 8 | 1 | 9 | 2 | 8 | 3 | 7 | 2 | 8 | 3 | 7 |
| Smoldering type | 3 | 12 | 2 | 13 | 7 | 8 | 0 | 15 | 1 | 14 | 1 | 14 | 4 | 11 | 15 | 0 |
| P value | 0.653 | 0.350 | 0.176 | 0.400 | 0.346 | 0.267 | 0.545 | 0.000 | ||||||||
| HTLV-I carrier | 3 | 7 | 0 | 10 | 2 | 8 | 1 | 9 | 2 | 8 | 3 | 7 | 2 | 8 | 3 | 7 |
| chronic type | 3 | 2 | 0 | 5 | 3 | 2 | 0 | 5 | 2 | 3 | 1 | 4 | 2 | 3 | 5 | 0 |
| P value | 0.287 | − | 0.167 | 0.667 | 0.407 | 0.593 | 0.407 | 0.019 | ||||||||
| HTLV-I carrier | 3 | 7 | 0 | 10 | 2 | 8 | 1 | 9 | 2 | 8 | 3 | 7 | 2 | 8 | 3 | 7 |
| Acute type | 12 | 3 | 0 | 15 | 8 | 7 | 3 | 12 | 0 | 15 | 0 | 15 | 3 | 12 | 13 | 2 |
| P value | 0.018 | − | 0.105 | 0.468 | 0.150 | 0.052 | 0.687 | 0.007 | ||||||||
| HTLV-I carrier | 3 | 7 | 0 | 10 | 2 | 8 | 1 | 9 | 2 | 8 | 3 | 7 | 2 | 8 | 3 | 7 |
| Lymphoma type | 18 | 2 | 8 | 12 | 16 | 4 | 1 | 19 | 9 | 11 | 3 | 17 | 4 | 16 | 18 | 2 |
| P value | 0.002 | 0.022 | 0.003 | 0.563 | 0.175 | 0.306 | 0.694 | 0.002 | ||||||||
| Smoldering type | 3 | 12 | 2 | 13 | 7 | 8 | 0 | 15 | 1 | 14 | 1 | 14 | 4 | 11 | 15 | 0 |
| Chronic type | 3 | 2 | 3 | 2 | 3 | 2 | 0 | 5 | 2 | 3 | 1 | 4 | 2 | 3 | 5 | 0 |
| P value | 0.131 | 0.553 | 0.500 | − | 0.140 | 0.447 | 0.483 | − | ||||||||
| Smoldering type | 3 | 12 | 2 | 13 | 7 | 8 | 0 | 15 | 1 | 14 | 1 | 14 | 4 | 11 | 15 | 0 |
| Acute type | 12 | 3 | 0 | 15 | 8 | 7 | 3 | 12 | 0 | 15 | 0 | 15 | 3 | 12 | 13 | 2 |
| P value | 0.003 | 0.241 | 0.500 | 0.112 | 0.500 | 1.000 | 0.500 | 0.241 | ||||||||
| Smoldering type | 3 | 12 | 2 | 13 | 7 | 8 | 0 | 15 | 1 | 14 | 1 | 14 | 4 | 11 | 15 | 0 |
| Lymphoma type | 18 | 2 | 8 | 12 | 16 | 4 | 1 | 19 | 9 | 11 | 3 | 17 | 4 | 16 | 18 | 2 |
| P value | 0.000 | 0.087 | 0.045 | 0.571 | 0.015 | 0.619 | 0.473 | 0.319 | ||||||||
| Chronic type | 3 | 2 | 0 | 5 | 3 | 2 | 0 | 5 | 2 | 3 | 1 | 4 | 2 | 3 | 5 | 0 |
| Acute type | 12 | 3 | 0 | 15 | 8 | 7 | 3 | 12 | 0 | 15 | 0 | 15 | 3 | 12 | 13 | 2 |
| P value | 0.366 | − | 0.604 | 0.399 | 0.053 | 0.250 | 0.366 | 0.553 | ||||||||
| Chronic type | 3 | 2 | 0 | 5 | 3 | 2 | 0 | 5 | 2 | 3 | 1 | 4 | 2 | 3 | 5 | 0 |
| Lymphoma type | 18 | 2 | 8 | 12 | 16 | 4 | 1 | 19 | 9 | 11 | 3 | 17 | 4 | 16 | 18 | 2 |
| P value | 0.166 | 0.116 | 0.343 | 0.800 | 0.622 | 0.617 | 0.343 | 0.633 | ||||||||
| Acute type | 12 | 3 | 0 | 15 | 8 | 7 | 3 | 12 | 0 | 15 | 0 | 15 | 3 | 12 | 13 | 2 |
| Lymphoma type | 18 | 2 | 8 | 12 | 16 | 4 | 1 | 19 | 9 | 11 | 3 | 17 | 4 | 16 | 18 | 2 |
| P value | 0.360 | 0.005 | 0.095 | 0.200 | 0.002 | 0.174 | 0.668 | 0.581 | ||||||||
Bold numbers indicate significant differences of methylation frequency (P < 0.05).
Table 4.
Correlation between the Presence of CIMP and Progression of ATLL
| CIMP |
|||
|---|---|---|---|
| Positive | Negative | P value | |
| HTLV-1 carrier | 3 | 7 | 1.000 |
| Smoldering type | 5 | 10 | |
| HTLV-1 carrier | 3 | 7 | 0.119 |
| Chronic type | 4 | 1 | |
| HTLV-1 carrier | 3 | 7 | 0.414 |
| Acute type | 8 | 7 | |
| HTLV-1 carrier | 3 | 7 | 0.002 |
| Lymphoma type | 18 | 2 | |
| Smoldering type | 5 | 10 | 0.127 |
| Chronic type | 4 | 1 | |
| Smoldering type | 5 | 10 | 0.462 |
| Acute type | 8 | 7 | |
| Smoldering type | 5 | 10 | 0.001 |
| Lymphoma type | 18 | 2 | |
| Chronic type | 4 | 1 | 0.603 |
| Acute type | 8 | 7 | |
| Chronic type | 4 | 1 | 0.504 |
| Lymphoma type | 18 | 2 | |
| Acute type | 8 | 7 | 0.022 |
| Lymphoma type | 18 | 2 | |
| Correlation between the Presence of CIMP and Methylation of Each Gene | |||
|---|---|---|---|
| CIMP |
|||
| Positive | Negative | P value | |
| SHP1 | |||
| Methylated | 32 | 7 | 0.000 |
| Unmethylated | 6 | 20 | |
| p16 | |||
| Methylated | 9 | 1 | 0.037 |
| Unmethylated | 29 | 26 | |
| DAPK | |||
| Methylated | 31 | 5 | 0.000 |
| Unmethylated | 7 | 22 | |
| hMLH1 | |||
| Methylated | 4 | 1 | 0.393 |
| Unmethylated | 33 | 26 | |
| MGMT | |||
| Methylated | 11 | 3 | 0.127 |
| Unmethylated | 27 | 24 | |
| p73 | |||
| Methylated | 7 | 1 | 0.126 |
| Unmethylated | 31 | 26 | |
| p15 | |||
| Methylated | 14 | 1 | 0.002 |
| Unmethylated | 24 | 26 | |
| HCAD | |||
| Methylated | 36 | 18 | 0.005 |
| Unmethylated | 2 | 9 | |
Fisher's exact test.
Bold numbers indicate significant differences of CIMP incidence (P < 0.05).
Gene Silencing Associated with CpG Island Methylation
To make sure the gene silencing associated with CpG hypermethylation, protein expression was examined with smoldering type, chronic type, and lymphoma type ATLL specimens by immunohistochemistry, thus showing a typical ATLL cell phenotype to be clearly positive for CD4 (Figure 3A-B) and CD25 (Figure 3C). SHP1 protein expression was detected in the cytoplasm of the quiescent small lymphocytes of the mantle zone and interfollicular lymphocytes in the reactive lymphoid hyperplasia as a positive control (Figure 3D). In contrast, all of the lymphoma type ATLL specimens showed no expression of SHP1 (n = 2) (Figure 3F) in addition to our previous results of entirely no expression of SHP1 protein in lymphoma type ATLL specimens (n = 9) with tissue microarray analysis.10,27 The lymphoma type ATLL specimen showed no signal of p16 expression with immunohistochemistry (Figure 3G) in contrast to the strong positive staining in endocervical squamous cell carcinoma, which was positive control (Figure 3E). These observations were consistent with the CpG hypermethylation of the p16 gene.
Figure 3.
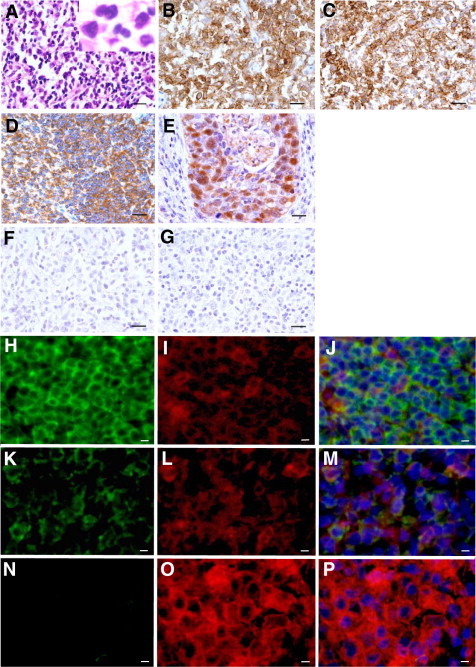
SHP1 and p16 protein expression in smoldering, chronic, and lymphoma type ATLL specimens. Top three rows: A typical case with lymph node involvement of ATLL cells in lymphoma type ATLL (A, H&E staining, ×400). Immunohistochemical staining showed that atypical ATLL lymphocytes were positive for CD4 (B, ×400), CD25 (C; ×400), and negative for SHP1 (F, ×400) and p16 (G, ×400) in lymphoma type ATLL specimen. The normal reactive lymph node was used for SHP1 positive control (D, ×400). The endocervical squamous cell carcinoma specimen was used as positive control for p16 (E, ×400). Scale bars = 50 μm. Bottom three rows: Triple-staining of fluorescent immunohistochemistry showed that the expression of SHP1 protein was completely abolished in CD25+ lymphoma type ATLL specimen (N, O, P ×400), which was clearly contrast to the strong expression of SHP1 protein in interfollicular lymphocytes of reactive lymphoid hyperplasia (H, I, J ×400). Expression of SHP1 protein in the skin of smoldering type ATLL was intermediate (K, L, M ×400). Alexa fluor 488 (green): anti-SHP1 Ab (H, K and N); Alexa fluor 555 (red): anti-CD25 Ab (I, L and O) Hoechst33258 (blue). Merged pictures were shown in (J, M and P). Scale bar = 20 μm.
In addition, expression pattern of SHP1 protein in skin and/or lymph node specimens from smoldering type (skin; n = 2, lymph node; n = 1) and chronic type ATLL (skin; n = 1, lymph node; n = 2) was examined with triple-staining of fluorescent immunohistochemistry for SHP1, CD25, and Haexist33258, comparing with lymphoma type ATLL. Expression of SHP1 protein was completely abolished in CD25+ lymphoma type ATLL specimen (Figure 3N, O, P), which was clearly contrast to the strong expression of SHP1 protein in interfollicular lymphocytes of reactive lymphoid hyperplasia (Figure 3H, I, J). Expression strength of SHP1 protein in the skin and/or lymph node of smoldering type and chronic type ATLL was intermediate, which was consistent with the faint or intermediate MSP signals of the SHP1 gene (Figure 3K, L, M).
Clinical Significance of CpG Island Methylation
To clarify the clinical significance of the number of methylated genes and CIMP, overall survival was analyzed with Kaplan–Meyer method and was compared using Log-Rank test (Figure 4, A and B). The overall survival significantly decreased according to the increase of the number of methylated genes (P = 0.008). The overall survival of CIMP(+) patients was quickly decreased, thus showing a poor prognosis in comparison with CIMP(−) cases (P = 0.002).
Figure 4.

The overall survival analyzed by the Kaplan-Meyer method. A: The overall survival of ATLL patients according to the number of methylated genes with Kaplan–Meyer analysis. The overall survival of the ATLL patients significantly decreased as the number of methylated genes increased. B: The overall survival of ATLL patients in terms of the CIMP presence. The CIMP-positive ATLL patients showed a significantly poor prognosis.
Finally, the simultaneous methylation between two specific genes was investigated. A positive correlation was detected between methylation of specific genes (such as the SHP1 and DAPK, P = 0.001; SHP1 and p16, P = 0.038; SHP1 and HCAD, P = 0.038; DAPK and MGMT, P = 0.009; and DAPK and HCAD genes, P = 0.000), indicating that the SHP1, p16, DAPK, and HCAD genes were methylated simultaneously with statistical significance (P < 0.05, Fisher's exact test; Table 5).
Table 5.
Simultaneous Methylation of Two Genes during Crisis or Progression of ATLL
|
p16 |
DAPK |
hMLH1 |
MGMT |
p73 |
p15 |
HCAD |
||||||||
|---|---|---|---|---|---|---|---|---|---|---|---|---|---|---|
| M | U | M | U | M | U | M | U | M | U | M | U | M | U | |
| SHP1 | ||||||||||||||
| M | 8 | 28 | 24 | 12 | 3 | 33 | 9 | 27 | 5 | 31 | 10 | 26 | 31 | 5 |
| U | 2 | 40 | 12 | 30 | 2 | 40 | 5 | 37 | 5 | 37 | 7 | 35 | 27 | 15 |
| P value | 0.038 | 0.001 | 0.657 | 0.152 | 1.000 | 0.279 | 0.038 | |||||||
| p16 | ||||||||||||||
| M | 7 | 3 | 1 | 9 | 3 | 7 | 2 | 8 | 2 | 8 | 10 | 0 | ||
| U | 29 | 39 | 4 | 64 | 11 | 57 | 8 | 60 | 15 | 53 | 48 | 20 | ||
| P value | 0.173 | 0.506 | 0.373 | 0.608 | 1.000 | 0.057 | ||||||||
| DAPK | ||||||||||||||
| M | 2 | 34 | 11 | 25 | 6 | 30 | 10 | 26 | 34 | 2 | ||||
| U | 3 | 39 | 3 | 39 | 4 | 38 | 7 | 35 | 24 | 18 | ||||
| P value | 1.000 | 0.009 | 0.500 | 0.279 | 0.000 | |||||||||
| hMLH1 | ||||||||||||||
| M | 0 | 5 | 1 | 4 | 1 | 4 | 5 | 0 | ||||||
| U | 14 | 59 | 9 | 64 | 16 | 57 | 53 | 20 | ||||||
| P value | 90.579 | 0.506 | 1.000 | 0.320 | ||||||||||
| MGMT | ||||||||||||||
| M | 4 | 10 | 4 | 10 | 10 | 4 | ||||||||
| U | 6 | 58 | 13 | 51 | 48 | 16 | ||||||||
| P value | 0.073 | 0.491 | 0.746 | |||||||||||
| p73 | ||||||||||||||
| M | 3 | 7 | 7 | 3 | ||||||||||
| U | 14 | 54 | 51 | 17 | ||||||||||
| P value | 0.682 | 0.711 | ||||||||||||
| p15 | ||||||||||||||
| M | 15 | 2 | ||||||||||||
| U | 43 | 18 | ||||||||||||
| P value | 0.211 | |||||||||||||
Fisher's exact test.
Bold numbers indicate significant differences of methylation frequency (P < 0.05).
Discussion
ATLL is a T cell malignancy that occurs after a 40- to 60-year period of clinical latency in about 3% to 5% of all HTLV-1-infected individuals. ATLL is an interesting model for the investigation of multistep lymphomagenesis/leukemogenesis. The presence of age-dependent accumulation of leukemogenic events within HTLV-1-infected T cells have been suggested before the development of ATLL, and the approximate number of independent leukemogenic events in ATLL is estimated to be five.9 The progression mechanism of ATLL has been studied from various genetic aspects,9–19 although, the detailed mechanism triggering the onset and progression of ATLL remains to be elucidated. An epigenetic mechanism may be another possibility to induce the progression and onset of ATLL.33 Epigenetic regulatory mechanisms are finely controlled by chromatin modification and various key epigenetic regulators, including the DNA methyltransferases,34,35 histone deacetylases,36 histone acetyltransferase,37 trithorax group proteins,38 polycomb group proteins,38,39 methylated DNA binding protein,40 heterochromatin protein 1,41 and non-coding RNA.42 One important candidate for an epigenetic mechanism associated with malignant transformation is gene silencing associated with aberrant CpG island DNA hypermethylation. Generally, CpG island DNA methylation is strictly regulated in the course of development and tissue specific differentiation responding to the changes in the microenvironment.
Assessment of the sensitivity of present MSP/UMSP analyses showed that MSP/UMSP has the high sensitivity to detect a 0.01% presence of ATLL neoplastic cell ED40515 (−), having hypermethylated CpG island in the specific genes, among normal PBMCs (Figure 1, B−D), suggesting the present system of MSP/UMSP is an extremely sensitive method to detect neoplastic cells in the crisis of HTLV-1 carriers to ATLL. The analysis of MSP/UMSP with specimens of acute type ATLL were diluted to about 1% content of neoplastic ATLL cells with normal PBMCs, which was less than the content of HTLV-1 infected cells in carrier specimens (Figure 1, E−G), clearly showed that the different proportion of HTLV-1 infected cells and/or neoplastic ATLL cells from range of HTLV-1 carriers (usually 1% to 5% content of HTLV-1 infected cells) to various types of ATLL specimens (30% to 98% content of neoplastic ATLL cells) does not strongly affect on MSP/UMSP signal strength.
Although weak and strong MSP-positive signals related to positive DNA methylation, the MSP-positive signals in healthy volunteers, HTLV-1 carrier, and smoldering type ATLL tended be rather faint in general, in comparison with the strong signals in acute and lymphoma type ATLL. For the case of faint or intermediate signals of MSP, several possible situations could be expected. First, extremely small populations of highly methylated cells can be detected, such as the presence of highly methylated neoplastic ATLL cells among 1000 to 20,000 or more of normal cells (Figure 1B). Second, there are a little or some populations having intermediate frequency or density of methylation in the specific CpG islands. Third, wide populations of cells contain the low or intermediate methylation density at the specific locus. Bisulfite sequencing analysis of a HTLV-1 carrier specimen, which showed a faint band with MSP, revealed that lots of clones showed methylation in several CpG sites. This is a quite different methylation profile compared with that of normal PBMCs (Figure 1, C and H), suggesting many clones are accumulating the ongoing methylation at the specific locus in some population of HTLV-1 carriers. It would be quite interesting question whether HTLV-1 carriers having faint signal in MSP are at high risk to progress to ATLL, whether these persons have multiple locus of ongoing methylation, and what kinds of factors induce this kind of progressive methylation. The slight methylation of some genes in HTLV-1 carriers and/or indolent ATLL as well as healthy donors may reflect fluctuations of genome-wide methylation in response to environmental changes, inflammation, nutrition, aging, gender, lifestyle, and so on.28
To determine whether aberrant CpG island methylation of the specific genes and CIMP contribute to the progression of ATLL, the methylation status of eight genes was analyzed by MSP. Methylation profiles of PBMCs from healthy volunteers, HTLV-1 carriers and various stages of ATLL were shown to be quite different and characteristic (Figure 1 and Table 2). The total number of methylated genes and the incidence of CIMP significantly increased from healthy PBMC or HTLV-1 carriers to various types of ATLL. In the present investigation, some specific genes were stage-dependently hypermethylated. The frequency of methylation of the SHP1 and p73 genes increased at the stage of HTLV-1 infection from healthy volunteers to HTLV-1 carrier (P < 0.046; Table 3 and Figure 5), thereby indicating that HTLV-1 infection induces epigenetic changes in the cells even in HTLV-1 carrier state. Such epigenetic changes, triggered by HTLV-1 infection, could abrogate the normal cellular regulatory mechanism.
Figure 5.

Specific genes that show statistically significant increase in the CpG island hypermethylation incidence during the progression of ATLL. Genes associated with arrow indicate significant increase of methylation frequency from arrow start-pointed status to end-point status, which does not always indicate the direction of disease progression. The SHP1 and p73 genes were significantly methylated after HTLV-1 infection (P < 0.05). The hypermethylation of the SHP1 gene was associated with the progression to aggressive type (acute and lymphoma type) ATLL from carrier and smoldering type ATLL, with statistical significance. The HCAD gene was significantly highly methylated at the onset of every type of ATLL, on the other hand the DAPK, MGMT, and p16 genes were significantly hypermethylated at the progression to lymphoma type-ATLL. Statistical data were originated from Table 1.
The HCAD genes were found to be hypermethylated with statistical significance at the crisis of every type of ATLL from carrier state on (P < 0.05). The hypermethylation of the SHP1 gene was significantly associated with the progression to aggressive type (acute and lymphoma type) ATLL from carrier and smoldering type ATLL (P < 0.05). The progression from the carrier state or smoldering type of ATLL to the lymphoma type ATLL was associated with the specific hypermethylation of another type of genes such as the DAPK, MGMT, or p16 genes, thus indicating that epigenetic changes of these specific genes contribute to the stage-specific progression of ATLL. Significant differences were also found between the methylation profiles of the acute type and lymphoma type ATLL. The lymphoma type showed more frequent methylation in the p16, p73, and MGMT genes, also a higher number of simultaneously methylated genes and higher incidence of CIMP than acute type (Figure 2), suggesting that epigenetically different abnormalities in target genes and also regulatory machinery may contribute to the distinct molecular pathogenesis of the lymphoma type ATLL different from acute type ATLL. This is consistent with the findings of a previous investigation, which showed the profiles of CGH (comparative genomic hybridization) microarray to be quite different between acute and lymphoma type of ATLL.29 This indicates that structural abnormalities in the whole genome also contribute to the different tumorigenesis between the two subtypes of ATLL as well as distinct type of epigenetic abnormalities.
The SHP1 gene showed the most significant correlation between the methylation levels and disease progression. This indicated that the SHP1 gene methylation may be the most useful marker to distinguish between normal and ATLL. The SHP1 gene methylation is more prevalent in ATLL, and silencing of the SHP1 gene expression by CpG methylation may contribute to the transformation from normal to various stage of ATLL.15,27 The HTLV-1-encoded multifunctional protein Tax is thought to play an important role in the early stages of tumorigenesis in ATLL.43,44 Tax stimulates various signaling pathway, deregulation of the cell cycle arrest, DNA repair and apoptosis by binding to CDK inhibitors and inhibiting some tumor-suppressor proteins.43,45–47 Tax expression also has been reported to be regulated by the SUV39H1 histone methyltransferase48 and histone deacetylases,49 which negatively regulate the viral gene expression. These indicate that the epigenetic abnormalities including Tax regulation play crucial roles in the pathogenesis of ATLL. Present evidence that CpG methylation of the SHP1 gene has started even in HTLV-1 carrier state and also accumulation of methylation frequency according to the progression, suggests the possibility that the gene silencing of the SHP1 gene, which is a specific key negative regulator of receptor mediated signaling, is the initial step of multistep leukemogenesis/lymphomagenesis in ATLL. This hypothesis is supported by the previous evidences that the high incidence of the SHP1 gene methylation and loss of heterozygosity, indicating the key role in initiation and progression in lymphomagenesis and/or leukemogenesis.10,15,27 This implies that the stage-specific DNA hypermethylation of these genes could be the highly specific markers useful for the accurate early detection, diagnosis of the onset of ATLL, and also the monitoring the patient status, because present data of MSP shows the high sensitivity to detect a single ATLL tumor cell among 1 × 10⁴ background normal PBMCs (Figure 1, B and C). Sensitive and specific epigenetic analysis would contribute to the establishment of more effective treatments and improve the prognosis of ATLL as well as early detection.
The presence of CIMP has been reported in several malignancies; however, the definition and cut-off value of CIMP remains unclear.30,50,51 CIMP was defined in the present study as more than or equal to three genes over eight tested genes being methylated according to the distribution of the number of methylated genes among diseases. The results demonstrated that CIMP was associated with the progression and onset of ATLL, especially in lymphoma type and also significant unfavorable overall survival as shown in the Kaplan-Meyer analysis (Figure 4, Table 4). These findings may therefore imply that CIMP might be an additional valuable biomarker for an early diagnosis and progression in ATLL, as well as a prominent prognostic marker, in addition to another parameter of the number of methylated genes.
These findings indicate that treatment with a demethylation agents such as 5-aza-2′-deoxycytidine may be effective for prophylactic treatment of ATLL in HTLV-1 carriers, as well as for therapy of all types of ATLL. It is necessary to characterize the detailed methylation profiles associated with prognosis in a larger number of patient specimens. Simultaneous methylation, detected by the correlations in the methylation events of two genes (SHP1 and DAPK, DAPK and MGMT, DAPK and HCAD) (Table 5) and presence of CIMP suggest that abnormalities in the epigenetic machinery, regulating target specific CpG methylation, may cause functionally or regulatory disability in the related genes during the progression and onset of ATLL. Further studies are currently underway to elucidate the mechanism of methylation in different stages of ATLL during follow-up.
In summary, present investigation provides strong evidence that the MSP assay is reliable to investigate methylation status associated with crisis and/or progression of ATLL irrespective to the different proportion of HTLV-1 infected cells and/or neoplastic ATLL cells. Present data suggested that HTLV-1 infection induces epigenetic changes in the cells, even in the HTLV-1 carrier state. Such epigenetic abnormal changes could abrogate the normal cellular regulatory mechanism and relate to the progression with the multistep accumulation of aberrant CpG hypermethylation and CIMP in ATLL. These findings suggest that the epigenetic abnormalities are deeply involved in the crisis and progression of ATLL in multistep leukemogenesis/lymphomagenesis. Furthermore, the CIMP status and stage-specific DNA hypermethylation may be potentially novel biomarkers for the early detection and prognosis of ATLL patients’, and minimal residual disease, and for also determining the appropriate candidate patients for epigenetically targeted salvage therapy regimens with high sensitivity and accuracy.
Acknowledgements
We thank Ms. Miyuki Shiotani and Ms. Yingzhe Jiang, Department of Pathology & Oncology, Graduate School of Medicine, Dentistry, and Pharmaceutical Sciences, Okayama University, for expert technical assistance; Ms. Minako Nakashima, Imamura Bun-in Hospital, Kagoshima, Japan for coordination of clinical samples and data; and Mr. Yukinari Isomoto, Central Research Laboratory, Okayama University Medical School for technical support.
Footnotes
Supported by the Ministry of Education, Culture, Sports, Science and Technology of Japan (T.O.) (#12670161, #09470051).
References
- 1.Poiesz BJ, Ruscetti FW, Gazdar AF, Bunn PA, Minna JD, Gallo RC. Detection and isolation of type C retrovirus particles from fresh and cultured lymphocytes of a patient with cutaneous T-cell lymphoma. Proc Natl Acad Sci USA. 1980;77:7415–7419. doi: 10.1073/pnas.77.12.7415. [DOI] [PMC free article] [PubMed] [Google Scholar]
- 2.Hinuma Y, Nagata K, Hanaoka M, Nakai M, Matsumoto T, Kinoshita K, Shirakawa S, Miyoshi I. Adult T-cell leukemia: antigen in an ATL cell line and detection of antibodies to the antigen in human sera. Proc Natl Acad Sci USA. 1981;78:6476–6480. doi: 10.1073/pnas.78.10.6476. [DOI] [PMC free article] [PubMed] [Google Scholar]
- 3.Yoshida M, Miyoshi I, Hinuma Y. Isolation and characterization of retrovirus from cell lines of human adult T-cell leukemia and its implication in the disease. Proc Natl Acad Sci USA. 1982;79:2031–2035. doi: 10.1073/pnas.79.6.2031. [DOI] [PMC free article] [PubMed] [Google Scholar]
- 4.Tajima K. The T- and B-cell Malignancy Study Group: the 4th nation-wide study of adult T-cell leukemia/lymphoma (ATL) in Japan: estimates of risk of ATL and its geographical and clinical features. Int J Cancer. 1990;45:237–243. doi: 10.1002/ijc.2910450206. [DOI] [PubMed] [Google Scholar]
- 5.Shimoyama M, Members of Lymphoma Study Group Diagnostic criteria and classification of clinical subtypes of adult T-cell leukemia/lymphoma. Br J Haematol. 1991;79:428–437. doi: 10.1111/j.1365-2141.1991.tb08051.x. [DOI] [PubMed] [Google Scholar]
- 6.Matsuoka M, Jeang KT. Human T-cell leukemia virus type 1 (HTLV-1) infectivity and cellular transformation. Nat Rev Cancer. 2007;7:270–280. doi: 10.1038/nrc2111. [DOI] [PubMed] [Google Scholar]
- 7.Matsuoka M. Human T-cell leukemia virus type I and adult T-cell leukemia. Oncogene. 2003;22:5131–5140. doi: 10.1038/sj.onc.1206551. [DOI] [PubMed] [Google Scholar]
- 8.Gaudray G, Gachon F, Basbous J, Biard-Piechaczyk M, Devaux C, Mesnard JM. The complementary strand of the human T-cell leukemia virus type 1 RNA genome encodes a bZIP transcription factor that down-regulates viral transcription. J Virol. 2002;76:12813–12822. doi: 10.1128/JVI.76.24.12813-12822.2002. [DOI] [PMC free article] [PubMed] [Google Scholar]
- 9.Okamoto T, Ohno Y, Tsugane S. Multi-step carcinogenesis model for adult T-cell leukemia. Jpn J Cancer Res. 1989;80:191–195. doi: 10.1111/j.1349-7006.1989.tb02289.x. [DOI] [PMC free article] [PubMed] [Google Scholar]
- 10.Oka T, Ouchida M, Tanimoto M, Shimizu K, Yoshino T. High frequent gene silencing of hematopoietic cell specific protein tyrosine phosphatase SHP1 in hematopoietic cell malignancies. In: Redberry GW, editor. Gene silencing. New research. Nova Science; New York: 2006. p. 1. [Google Scholar]
- 11.Ariyama Y, Mori T, Shinomiya T, Sakabe T, Fukuda Y, Kanamaru A, Yamada Y, Isobe M, Seto M, Nakamura Y, Inazawa J. Chromosomal imbalances in adult T-cell leukemia revealed by comparative genomic hybridization: gains at 14q32 and 2p16–22 in cell lines. J Hum Genet. 1999;44:357–363. doi: 10.1007/s100380050178. [DOI] [PubMed] [Google Scholar]
- 12.Fujimoto T, Hata T, Itoyama T, Nakamura H, Tsukasaki K, Yamada Y, Ikeda S, Sadamori N, Tomonaga M. High rate of chromosomal abnormalities in HTLV-1-infected T-cell colonies derived from prodromal phase of adult T-cell leukemia: a study of IL-2-stimulated colony formation in methylcellulose. Cancer Genet Cytogenet. 1999;109:1–13. doi: 10.1016/s0165-4608(98)00141-1. [DOI] [PubMed] [Google Scholar]
- 13.Hatta Y, Yamada Y, Tomonaga M, Miyoshi I, Said JW, Koeffler HP. Detailed deletion mapping of the long arm of chromosome 6 in adult T-cell leukemia. Blood. 1999;93:613–616. [PubMed] [Google Scholar]
- 14.Oka T, Sonobe H, Iwata J, Kubonishi I, Satoh H, Takata M, Tanaka Y, Tateno M, Tozawa H, Mori S, Yoshiki T, Ohtsuki Y. Phenotypical progression of a rat lymphoid cell line immortalized by HTLV-1 to induce lymphoma/leukemia-like disease in rats. J Virol. 1992;66:6686–6694. doi: 10.1128/jvi.66.11.6686-6694.1992. [DOI] [PMC free article] [PubMed] [Google Scholar]
- 15.Oka T, Ouchida M, Koyama M, Ogama Y, Takada S, Nakatani Y, Tanaka T, Yoshino T, Hayashi K, Ohara N, Kondo E, Takahashi K, Tsuchiyama J, Tanimoto M, Shimizu K, Akagi T. Gene silencing of the tyrosine phosphatase SHP1 gene by aberrant methylation in leukemias/lymphomas. Cancer Res. 2002;62:6390–6394. [PubMed] [Google Scholar]
- 16.Tawara M, Hogerzeil SJ, Yamada Y, Takasaki Y, Soda H, Hasegawa H, Murata K, Ikeda S, Imaizumi Y, Sugahara K, Tsuruda K, Tsukasaki K, Tomonaga M, Hirakata Y, Kamihira S. Impact of p53 aberration on the progression of adult T-cell leukemia/lymphoma. Cancer Lett. 2006;234:249–255. doi: 10.1016/j.canlet.2005.03.039. [DOI] [PubMed] [Google Scholar]
- 17.Yamato K, Oka T, Hiroi M, Iwahara Y, Sugito S, Tsuchida N, Miyoshi I. Aberrant expression of the p53 tumor suppresser gene in adult T-cell leukemia and HTLV-1-infected cells. Jpn J Cancer Res. 1993;84:4–8. doi: 10.1111/j.1349-7006.1993.tb02775.x. [DOI] [PMC free article] [PubMed] [Google Scholar]
- 18.Shimakage M, Inoue N, Ohshima K, Kawahara K, Yamamoto N, Oka T, Tambe Y, Yasui K, Matsumoto K, Yutsudo M, Inoue H. Downregulation of drs mRNA expression is associated with the progression of adult T-cell leukemia/lymphoma. Int J Oncol. 2007;30:1343–1348. [PubMed] [Google Scholar]
- 19.Shimakage M, Inoue N, Ohshima K, Kawahara K, Yamamoto N, Oka T, Yasui K, Matsumoto K, Inoue H, Watari A, Higashiyama S, Yutsudo M. Down-regulation of ASY/Nogo transcription associated with progression of adult T-cell leukemia/lymphoma. Int J Cancer. 2006;119:1648–1653. doi: 10.1002/ijc.22011. [DOI] [PubMed] [Google Scholar]
- 20.Herman JG, Baylin SB. Gene silencing in cancer in association with promoter hyper-methylation. N Engl J Med. 2003;349:2042–2054. doi: 10.1056/NEJMra023075. [DOI] [PubMed] [Google Scholar]
- 21.Miremadi A, Oestergaard MZ, Pharoah PD, Caldas C. Cancer genetics of epigenetic genes. Hum Mol Genet. 2007;15:28–49. doi: 10.1093/hmg/ddm021. [DOI] [PubMed] [Google Scholar]
- 22.Costello JF, Fruhwald MC, Smiraglia DJ, Rush LJ, Robertson GP, Gao X, Wright FA, Feramisco JD, Peltomäki P, Lang JC, Schuller DE, Yu L, Bloomfield CD, Caligiuri MA, Yates A, Nishikawa R, Su Huang H, Petrelli NJ, Zhang X, O'Dorisio MS, Held WA, Cavenee WK, Plass C. Aberrant CpG-island methylation has non-random and tumour-type-specific patterns. Nat Genet. 2000;24:132–138. doi: 10.1038/72785. [DOI] [PubMed] [Google Scholar]
- 23.Esteller M, Corn PG, Baylin SB, Herman JG. A gene hyper-methylation profile of human cancer. Cancer Res. 2001;61:3225–3229. [PubMed] [Google Scholar]
- 24.Esteller M. Dormant hypermethylated tumour suppressor genes: questions and answers. J Pathol. 2005;205:172–180. doi: 10.1002/path.1707. [DOI] [PubMed] [Google Scholar]
- 25.Kalebic T. Epigenetic changes: potential therapeutic targets. Ann NY Acad Sci. 2003;983:278–285. doi: 10.1111/j.1749-6632.2003.tb05982.x. [DOI] [PubMed] [Google Scholar]
- 26.Esteller M. Relevance of DNA methylation in the management of cancer. Lancet Oncol. 2003;4:351–358. doi: 10.1016/s1470-2045(03)01115-x. [DOI] [PubMed] [Google Scholar]
- 27.Oka T, Yoshino T, Hayashi K, Ohara N, Nakanishi T, Yamaai Y, Hiraki A, Aoki-Sogawa C, Kondo E, Teramoto N, Takahashi K, Tsuchiyama J, Akagi T. Reduction of hematopoietic cell-specific tyrosine phosphatase SHP-1 gene expression in natural killer cell lymphoma and various types of lymphomas/leukemias: combination analysis with cDNA expression array and tissue microarray. Am J Pathol. 2001;159:1495–1505. doi: 10.1016/S0002-9440(10)62535-7. [DOI] [PMC free article] [PubMed] [Google Scholar]
- 28.Kang GH, Lee HJ, Hwang KS, Lee S, Kim JH, Kim JS. Aberrant CpG island hyper-methylation of chronic gastritis, in relation to aging, gender, intestinal metaplasia, and chronic inflammation. Am J Pathol. 2003;163:1551–1556. doi: 10.1016/S0002-9440(10)63511-0. [DOI] [PMC free article] [PubMed] [Google Scholar]
- 29.Oshiro A, Tagawa H, Ohshima K, Karube K, Uike N, Tashiro Y, Utsunomiya A, Masuda M, Takasu N, Nakamura S, Morishima Y, Seto M. Identification of subtype-specific genomic alterations in aggressive adult T-cell leukemia/lymphoma. Blood. 2006;107:4500–4507. doi: 10.1182/blood-2005-09-3801. [DOI] [PubMed] [Google Scholar]
- 30.Issa JP. CpG island methylator phenotype in cancer. Nat Rev Cancer. 2004;4:988–993. doi: 10.1038/nrc1507. [DOI] [PubMed] [Google Scholar]
- 31.Tanaka G, Okayama A, Watanabe T, Aizawa S, Stuver S, Mueller N, Hsieh CC, Tsubouchi H. The clonal expansion of human T lymphotropic virus type 1-infected T cells: a comparison between seroconverters and long-term carriers. J Infect Dis. 2005;191:1140–1147. doi: 10.1086/428625. [DOI] [PubMed] [Google Scholar]
- 32.Koyama M, Oka T, Ouchida M, Nakatani Y, Nishiuchi R, Yoshino T, Hayashi K, Akagi T, Seino Y. Activated proliferation of B-cell lymphomas/leukemias with the SHP1 gene silencing by aberrant CpG methylation. Lab Invest. 2003;83:1849–1858. doi: 10.1097/01.lab.0000106503.65258.2b. [DOI] [PubMed] [Google Scholar]
- 33.Nosaka K, Maeda M, Tamiya S, Sakai T, Mitsuya H, Matsuoka M. Increasing methylation of the CDKN2A gene is associated with the progression of adult T-cell leukemia. Cancer Res. 2000;60:1043–1048. [PubMed] [Google Scholar]
- 34.Zhang Q, Wang HY, Woetmann A, Raghunath PN, Odum N, Wasik MA. STAT3 induces transcription of the DNA methyltransferase 1 gene (DNMT1) in malignant T lymphocytes. Blood. 2006;108:1058–1064. doi: 10.1182/blood-2005-08-007377. [DOI] [PMC free article] [PubMed] [Google Scholar]
- 35.Liu S, Liu Z, Xie Z, Pang J, Yu J, Lehmann E, Huynh L, Vukosavljevic T, Takeki M, Klisovic RB, Baiocchi RA, Blum W, Porcu P, Garzon R, Byrd JC, Perrotti D, Caligiuri MA, Chan KK, Wu LC, Marcucci G. Bortezomib induces DNA hypomethylation and silenced gene transcription by interfering with Sp1/NF-κB–dependent DNA methyltransferase activity in acute myeloid leukemia. Blood. 2008;111:2364–2373. doi: 10.1182/blood-2007-08-110171. [DOI] [PMC free article] [PubMed] [Google Scholar]
- 36.Haberland M, Montgomery RL, Olson EN. The many roles of histone deacetylases in development and physiology: implications for disease and therapy. Nat Rev Genet. 2009;10:32–42. doi: 10.1038/nrg2485. [DOI] [PMC free article] [PubMed] [Google Scholar]
- 37.Katsumoto T, Yoshida N, Kitabayashi I. Roles of the histone acetyltransferase monocytic leukemia zinc finger protein in normal and malignant hematopoiesis. Cancer Sci. 2008;99:1523–1527. doi: 10.1111/j.1349-7006.2008.00865.x. [DOI] [PMC free article] [PubMed] [Google Scholar]
- 38.Schuettengruber B, Chourrout D, Vervoort M, Leblanc B, Cavalli G. Genome regulation by polycomb and trithorax proteins. Cell. 2007;128:735–745. doi: 10.1016/j.cell.2007.02.009. [DOI] [PubMed] [Google Scholar]
- 39.Vire E, Brenner C, Deplus R, Blanchon L, Fraga M, Didelot C, Morey L, Van Eynde A, Bernard D, Vanderwinden JM, Bollen M, Esteller M, Di Croce L, de Launoit Y, Fuks F. The Polycomb group protein EZH2 directly controls DNA methylation. Nature. 2006;439:871–874. doi: 10.1038/nature04431. [DOI] [PubMed] [Google Scholar]
- 40.Ichimura T, Watanabe S, Sakamoto Y, Aoto T, Fujita N, Nakao M. Transcriptional repression and heterochromatin formation by MBD1 and MCAF/AM family proteins. J Biol Chem. 2005;280:13928–13935. doi: 10.1074/jbc.M413654200. [DOI] [PubMed] [Google Scholar]
- 41.Maison C, Almouzni G. HP1 and the dynamics of heterochromatin maintenance. Nat Rev Mol Cell Biol. 2004;5:296–304. doi: 10.1038/nrm1355. [DOI] [PubMed] [Google Scholar]
- 42.Fabbri M, Garzon R, Andreeff M, Kantarjian HM, Garcia-Manero G, Calin GA. MicroRNAs and noncoding RNAs in hematological malignancies: molecular, clinical and therapeutic implications. Leukemia. 2008;22:1095–1105. doi: 10.1038/leu.2008.30. [DOI] [PubMed] [Google Scholar]
- 43.Jeang KT, Giam CZ, Majone F, Aboud M. Life, death, and tax: role of HTLV-1 oncoprotein in genetic instability and cellular transformation. J Biol Chem. 2004;279:31991–31994. doi: 10.1074/jbc.R400009200. [DOI] [PubMed] [Google Scholar]
- 44.Grossman WJ, Kimata JT, Wong FH, Zutter M, Ley TJ, Ratner L. Development of leukemia in mice transgenic for the tax gene of human T-cell leukemia virus type I. Proc Natl Acad Sci USA. 1995;92:1057–1061. doi: 10.1073/pnas.92.4.1057. [DOI] [PMC free article] [PubMed] [Google Scholar]
- 45.Hall WW, Fujii M. Deregulation of cell-signaling pathways in HTLV-1 infection. Oncogene. 2005;24:5965–5975. doi: 10.1038/sj.onc.1208975. [DOI] [PubMed] [Google Scholar]
- 46.Yoshida M. Multiple viral strategies of HTLV-1 for deregulation of cell growth control. Ann Rev Immunol. 2001;19:475–496. doi: 10.1146/annurev.immunol.19.1.475. [DOI] [PubMed] [Google Scholar]
- 47.Marriott SJ, Semmes OJ. Impact of HTLV-1 Tax on cell cycle progression and the cellular DNA damage repair response. Oncogene. 2005;24:5986–5995. doi: 10.1038/sj.onc.1208976. [DOI] [PubMed] [Google Scholar]
- 48.Kamoi K, Yamamoto K, Misawa A, Miyake A, Ishida T, Tanaka Y, Mochizuki M, Watanabe T. SUV39H1 interacts with HTLV-1 Tax and abrogates Tax transactivation of HTLV-1 LTR. Retrovirology. 2006;13:3:5. doi: 10.1186/1742-4690-3-5. [DOI] [PMC free article] [PubMed] [Google Scholar]
- 49.Ego T, Ariumi Y, Shimotohno K. The interaction of HTLV-1 Tax with HDAC1 negatively regulates the viral gene expression. Oncogene. 2002;21:7241–7246. doi: 10.1038/sj.onc.1205701. [DOI] [PubMed] [Google Scholar]
- 50.Ushijima T, Okochi-Takada E. Aberrant methylations in cancer cells: where do they come from? Cancer Sci. 2005;96:206–211. doi: 10.1111/j.1349-7006.2005.00035.x. [DOI] [PMC free article] [PubMed] [Google Scholar]
- 51.Roman-Gomez J, Jimenez-Velasco A, Agirre X, Prosper F, Heiniger A, Torres A. Lack of CpG island methylator phenotype defines a clinical subtype of T-cell acute lymphoblastic leukemia associated with good prognosis. J Clin Oncol. 2005;23:7043–7049. doi: 10.1200/JCO.2005.01.4944. [DOI] [PubMed] [Google Scholar]