

Abstract
Cardiovascular disease is the leading cause of death in postmenopausal women. While diet and lifestyle remain the cornerstones of prevention, a low-fat/high-carbohydrate diet is associated with hyperglycemia and hyperlipemia—atherosclerotic risk factors affected by postprandial conditions. The objective of this study was to examine the acute response of lipids and insulin to a low-fat/high-carbohydrate meal with either a high-glycemic or a low-glycemic index in healthy postmenopausal women. Fifteen healthy postmenopausal women were enrolled in a randomized crossover dietary intervention study. Levels of glucose, triglyceride, free fatty acids (FFAs), and insulin were measured preprandially and for 240 minutes after consumption of the test meals. In response to the high-glycemic compared with the low-glycemic index meal, postprandial insulin levels had a higher peak (65.4 vs 48.1 μU/mL, respectively), the homeostasis model assessment-insulin resistance (HOMA-IR) was significantly higher (P=.014), serum triglyceride levels declined significantly (P<.001), and there was a small reduction in FFA levels, although the difference did not reach statistical significance. The results suggest a postprandial impact of glycemic index on cardiovascular metabolic biomarkers in postmenopausal women and may have implications for dietary glycemic modification of cardiovascular risk in women.
Cardiovascular disease (CVD) remains the leading cause of mortality in women in the developed world and is a prime target for prevention.1 Postmenopausal loss of estrogen in women unveils a constellation of closely associated adverse changes in metabolic risk factors.2 The key contributors to this increased risk include a proatherogenic lipid profile, higher prevalence of visceral obesity, insulin resistance, and hypertension.3
Nonesterified (or free) fatty acid (FFA) levels have been implicated as a mechanistic underpinning for the development of the metabolic syndrome and ensuing risk for cardiovascular mortality, and elevated serum triglycerides have been shown to be an independent risk factor for CVD.4 Further, recent studies suggest that nonfasting triglyceride levels, especially those measured 2 to 4 hours postprandially, are strongly associated with cardiovascular events.5 Epidemiologic studies support postprandial lipemia as an independent risk factor for CVD.6,7 Patients with CVD exhibit an increased magnitude and duration of lipemia during the postprandial period,4 with an adverse effect on lipid subfractions associated with oxidative damage and induction of an inflammatory response.8 The close relationship between inflammation and CVD suggests that proinflammatory conditions, as promoted by FFAs, serum triglycerides, and insulin resistance, manifested by a high homeostasis model assessment-insulin resistance (HOMA-IR), may be a possible risk factor for coronary heart disease (CHD) or CHD-related disease, ie, diabetes mellitus (DM), in postmenopausal women.9
Many organizations recommend a diet containing at least 55% total energy from carbohydrates to maintain health and prevent CVD.10,11 However, it is clear that the type of carbohydrate is important. Recommendations emphasize the inclusion of complex carbohydrate and fiber, while reducing intake of simple sugars and carbohydrates associated with high glycemic response.12 In the Nurses Health Study, persons in the highest quintile of glycemic index (GI) (and glycemic load) had nearly double the relative risk of coronary artery disease, compared with those in the lowest quintile after adjustment for known risk factors.13,14 In postmenopausal women, high-GI diets were associated with higher fasting C-reactive protein (CRP) levels, high fasting serum triglycerides, and low serum high-density lipoprotein (HDL) cholesterol;15 yet, their effects on postprandial FFA and lipid levels remain unclear.16
While it is known that menopause represents a cardiovascular risk factor for women,2 it is not known whether the risk might be more pronounced among women with higher levels of postprandial lipemia. Most postprandial studies in women to date have tested plasma glycemic and lipemic response to conditions involving a metabolic stress, such as a very high–fat load or postprandial response to exercise. In contrast, our objective was to study postprandial effects of a high-glycemic vs a low-GI meal, representing a realistic test meal within the recommended food spectrum. We sought to test the hypothesis that a high-compared with a low-GI meal results in an adverse postprandial metabolic response.
METHODS
Patients
A total of 135 women from the general population responded to recruitment flyers. Forty-four qualified for the study following a phone screening questionnaire based on no previous illnesses, no hysterectomy, no smoking, not taking hormones, inability to come for the tests to the physical location or frequency, not taking statins or other medications, or on any diets. Of these, 26 attended the initial screening test and blood draw, and 17 met enrollment criteria without exclusions. Two of these women did not complete the study. Therefore, of the 135 women recruited, 15 healthy postmenopausal women (12 months or greater, post-last menstrual period), ages 51 to 64 years, were enrolled and completed the study. Exclusion criteria included history of hypertension, central obesity (waist circumference >35 inches [88 cm]), elevated fasting serum glucose (>100 mg/d), high serum triglycerides (>150 mg/d), low serum HDL cholesterol (<50 mg/d), diagnosed CVD, diabetes mellitus, current smoking, evidence of cancer, liver, renal or hematologic diseases, and secondary causes of obesity (such as presence of hypothyroidism). Women with a prior hysterectomy, taking hormone replacement therapy, or with a history of lactose or gluten intolerance or allergies to tomatoes were excluded, as the test meals contained these ingredients. The procedures followed were in accordance with the ethical standards of the institutional committee on human experimentation, the experimental protocol for the study was approved by the institutional review board at UC Davis, and participants provided written informed consent.
Study Design
The study was designed as a prospective, crossover, randomized dietary intervention study, where each participant served as her own control. We first screened the women for appropriate inclusion criteria by anthropometric measurements (height, weight, blood pressure, body mass index, waist circumference) and baseline laboratory analyses (fasting blood sugar, lipids). Women were then instructed on the American Health Association (AHA) step I diet (total calories from fat <30%, saturated fat <10%, and cholesterol <300 mg/d)17 and asked to adhere to the diet for a 1-week lead-in period prior to the postprandial study. Compliance with the diet was monitored by means of a 4-day food diary, analyzed using the computerized analysis program Food Processor SQL (ESHA Research, Salem, OR). Participants were encouraged to avoid foods with high phenolic content (cocoa, tea, herbal preparations, unusually high fruit or vegetable consumption),18 alcohol, and high-fat intake in the 48 hours preceding the test meal and instructed to avoid over-the-counter anti-inflammatory medications and drugs (including fish oil capsules, aspirin, and products marked as “anti-inflammatory neutraceuticals,” phytochemicals). Participants presented to the University of California, Davis, General Clinical Research Center (GCRC) following an overnight fast. Baseline height, weight, waist circumference, and blood pressure were recorded on admission, and fasting blood samples were collected from an indwelling venous catheter that was placed in the left antecubital fossa. Following the fasting blood draw, the patients consumed the experimental meal during a 20-minute period, either a high- or a low-GI meal, in random order. Blood samples were then drawn at 15, 30, 60, and 90 minutes and 4 hours (240 minutes) following the study meal. After 1 month of resuming their habitual diet, the participants repeated the week-long lead-in AHA diet and returned to the GCRC for the alternate second experimental meal and blood samples were drawn utilizing the same protocol as detailed above.
Study Meals
Test meals were custom-formulated with the assistance of a registered dietitian using a combination of whole foods comparable in total fat and caloric content but differing in GI (GI of 125 for the high-GI meal vs GI of 47 for the low-GI meal). GI of the composite meal was determined as the percentage caloric contribution of each food to the total caloric value of the entire meal and weighting the GI of the food accordingly. The test meals consisted of a pizza-type meal providing approximately one third to one quarter of estimated daily energy needs and included foods with minimal known bioactivity. Food preparation occurred at the GCRC metabolic kitchen facility in accordance with the Joint Commission for Accreditation of Hospitals Organization (JCAHO) standards. The patients consuming the high-glycemic test meal in the current study were provided an additional 60 g of dextrose in the form of 6 fluid ounces of Glucola, in order to increase the GI to a high of 125. The low–glycemic test meal was supplemented with a comparable amount of water to minimize potential effects of volume. The composition of the experimental meals is detailed in Table I.
Table I.
Composition of the Test Meals33
| Nutrient | High- Glycemic Index Meal |
Low- Glycemic Index Meal |
|---|---|---|
| Energy provided, Kcal | 539 | 474 |
| Carbohydrate, % energy/g |
56.9/78.4 | 55.8/46.4 |
| Total sugars, g | 17.3 | 9.53 |
| Protein, % energy | 17.9 | 24.8 |
| Fat, % energy | 25.3 | 28.8 |
| Cholesterol, mg | 30.0 | 30.0 |
| Saturated fat, g | 12.6 | 13.1 |
| Monounsaturated fat, g | 2.2 | 3.1 |
| Polyunsaturated fat, g | 1.4 | 3.2 |
| Fiber, g | 4.4 | 7.6 |
| Glycemic index | 125 | 47 |
Laboratory Analyses
Blood samples collected from each patient were immediately centrifuged at 3000 rpm for 15 minutes at 4°C and plasma and serum samples aliquotted and stored at −70°C until analysis. Serum lipid, lipoprotein, and glucose levels were analyzed using standard enzymatic procedures, and low-density lipoprotein (LDL) cholesterol levels were calculated using the Friedewald equation.19 High-sensitivity CRP levels were measured using a high-sensitivity immunoassay on a Beckman Lx20 analyzer (Beckman Coulter Inc, Brea, CA), where interassay and intra-assay coefficients of variations (CVs) were <5%. Plasma insulin was measured using commercially available reagents with no cross-reactivity with pro-insulin concentrations (Linco Research, St Charles, MO), and an interassay CV of 6% to 8%. FFAs were measured enzymatically (ACS-ACOD method) using nonesterified fatty acid reagents, with interassay and intra-assay CVs of 6% to 8%, respectively. The HOMA-IR was calculated as previously described.20
Statistical Analysis
Analysis of data was performed using SPSS statistical analysis software (SPSS Inc, Chicago, IL), and results were expressed as means ± standard error of the mean (SEM). Triglyceride and insulin levels were logarithmically transformed prior to analysis to achieve normal distributions. Group means were compared using Student t tests. To evaluate the response to the high- and low-GI meal, areas under the curve (AUCs) were calculated by the trapezoid rule for glucose, insulin, FFA, lipid and lipoprotein levels, and between-group AUC differences evaluated by t test analysis. In addition, incremental AUCs were determined in a similar fashion. Unless otherwise noted, a nominal 2-sided P value at <.05 was used to assess significance.
RESULTS
Patient Characteristics
Clinical and biochemical characteristics for the 15 healthy postmenopausal women who completed the study (both study meals) are given in Table II. The mean age of the patients in the group was 56.2 years, with a mean time in menopause of 4.6 years. The participants were nonobese, hypercholesterolemic, and normotensive, with an average fasting blood glucose range of 82 to 94 mg/dL and a total serum total cholesterol range of 180 to 326 mg/dL. The mean HOMA-IR was 0.8.
Table II.
Baseline Characteristics of Study Patients
| Variable | Baseline Characteristics |
|---|---|
| Age, y | 56.2±4.4 |
| Menopause, y | 4.6±2.9 |
| Weight, kg | 67±7 |
| Height, cm | 163±9 |
| Body mass index, kg/m2 | 25.2±3.6 |
| Waist, cm/in | 73±7.33/ 1±2.8 |
| Systolic BP, mm Hg | 119±7 |
| Diastolic BP, mm Hg | 73±7 |
| Total cholesterol, mg/dL | 232±41 |
| LDL-C, mg/dL | 152±37 |
| HDL-C, mg/dL | 66±8 |
| Triglyceride, mg/dL | 82±31 |
| Glucose, mg/dL | 85±9 |
| Insulin, μU/mL | 3.1±1.8 |
| HOMA-IR | 0.50±0.28 |
| FFA, mmol/L | 0.412±0.158 |
| CRP, mg/L | 1.83±1.69 |
Abbreviations: BMI, body mass index; BP, blood pressure; CRP, C-reactive protein; FFA, free fatty acid; HDL-C, high-density lipoprotein cholesterol; HOMA-IR, homeostasis model assessment-insulin resistance; LDL-C, low-density lipoprotein cholesterol. Values are expressed as mean ± SD.
Diet
The food records demonstrated that patients adhered to the AHA step 1 diet during the week-long run-in period prior to each postprandial test. They consumed an average of 28.3% of calories as fat, 8.3% saturated fat, and 153 mg of cholesterol per day. Approximately 53% of calories were provided by carbohydrates. No significant differences were observed in the dietary parameters between the 15 patients.
Biochemical Metabolic Analyses
There was no significant intrapersonal variation in fasting glucose, insulin, FFA, cholesterol, triglyceride, and HOMA-IR levels for the 2 study days. Postprandially, serum glucose levels peaked at a level of 127.6 mg/dL at 15 minutes after the highglycemic meal, compared with a peak level of 114.3 mg/dL at 30 minutes after the low-glycemic meal (Figure 1). For insulin, a significantly higher and more delayed peak serum level was observed in response to the high-GI meal (65.4 μU/mL), compared with the response to the low-GI meal (48.1 μU/mL; P<.001) (Figure 2). Further, HOMA-IR levels had a higher peak following the high-glycemic meal (8.8) compared with the low-glycemic meal (6.7) (Figure 3). In addition, the pattern was shifted to the left, with an earlier peak in the HOMA-IR level during high-glycemic conditions. Notably, 1 of the patients had a relatively high baseline HOMA-IR (1.3), suggesting a higher level of baseline insulin resistance. Excluding this patient from the analysis did not change the overall response to the high- or low-GI meal.
Figure 1.
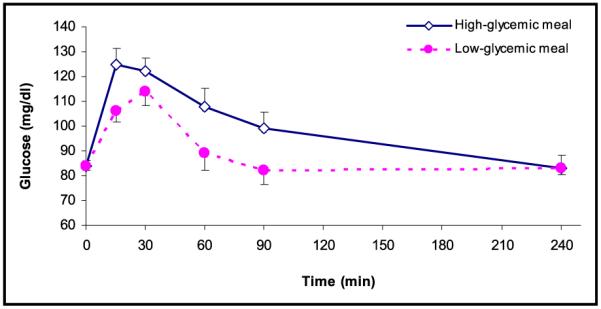
Serum glucose levels (mg/dL) during fasting (t=0) and after consumption of the test meal according to high-glycemic index (◇) (n=15) and low-glycemic index (●) (n=15). Values are expressed as mean ± SEM.
Figure 2.
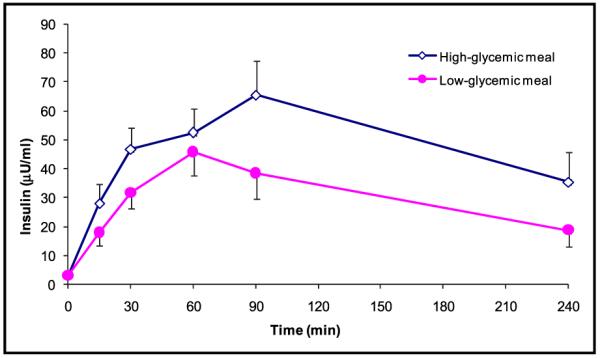
Insulin levels (μU/dL) during fasting (t=0) and after consumption of the test meal according to high-glycemic index (◇) (n=15) and low-glycemic index (●) (n=15). Values are expressed as mean ± SEM.
Figure 3.
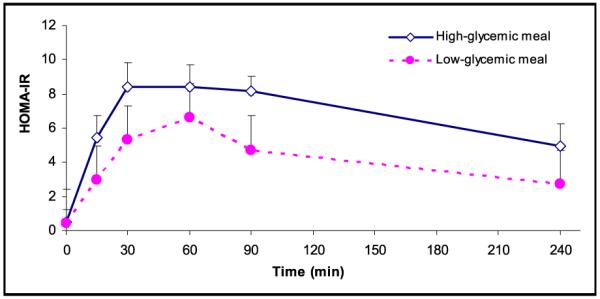
Homeostasis model assessment-insulin resistance during fasting (t=0) and after consumption of the test meal according to high-glycemic index (◇) (n=15) and low-glycemic index (●) (n=15). Values are expressed as mean ± SEM.
The overall serum triglyceride pattern was similar for the 2 meal conditions, with an initial slight decrease followed by a gradual increase, which was more pronounced during low-glycemic conditions (Figure 4). FFA levels dropped more after eating the high-glycemic meal (maximum change from baseline −0.196 mmol/L) compared with the low-GI meal (maximum change from baseline −0.093 mmol/L), although the difference did not meet statistical significance.
Figure 4.
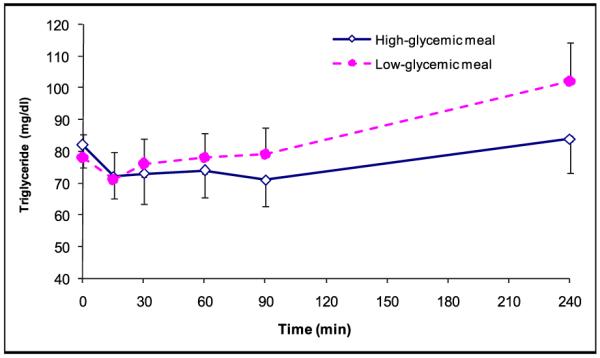
Triglyceride levels (mg/dL) during fasting (t=0) and after consumption of the test meal according to high-glycemic index (◇) (n=15) and low-glycemic index (●) (n=15). Values are expressed as mean ± SEM.
AUCs and incremental AUCs calculated for the variables demonstrated a significant increase in the following parameters for a high- vs a low-glycemic meal, respectively: glucose (incremental AUC 47±62 vs 11±46 mg/dL; P=.0021), HOMA-IR (incremental AUC 25.8±7.8 vs 15.1±10.9; P=.015) and triglyceride (incremental AUC −31±48 mg/dL vs 26±46 mg/dL; P<.001) (Table III). No differences in incremental AUC levels were observed for insulin or FFA. Except for a significantly higher total AUC for HOMA-IR under high-glycemic conditions (P=.014), no significant differences were observed for total AUC results.
Table III.
AUC and iAUC for Study Variables in Response to High-Glycemic Index and Low-Glycemic Index Meals
| Variables | High-Glycemic Index |
Low-Glycemic Index |
P Value |
|---|---|---|---|
| Total AUC | |||
| Glucose, mg/dL×h | 356±114 | 319±100 | .295 |
| Insulin, μU/mL×h | 171±125 | 115±83 | .101 |
| HOMA-IR | 27.8±8.2 | 16.9±11.2 | .014a |
| Triglyceride, mg/dL×h | 283±123 | 311±155 | .338 |
| FFA, mmol/L×h | 0.900±0.653 | 0.913±0.408 | .951 |
| Incremental AUC | |||
| Glucose, mg/dL×h | 47±62 | 11 ±46 | .021a |
| Insulin, μU/mL×h | 160±123 | 104±80 | .089 |
| HOMA-IR | 25.8±7.8 | 15.1±10.9 | .014a |
| Triglyceride, mg/dL×h | −31±48 | 26±46 | <.001a |
| FFA, mmol/L×h | −0.594±0.686 | −0.256±0.344 | .061 |
Abbreviations: AUC, area under the curve; HOMA-IR, homeostasis model assessment-insulin resistance; FFA, free fatty acid; iAUC, incremental area under the curve. Values are expressed as mean ± SD. P values were calculated using t tests.
P<.05.
DISCUSSION
The objective of this dietary study was to characterize the postprandial metabolic response to the GI of a meal in postmenopausal women, a population at increasing cardiovascular risk. We were specifically interested in characterizing the metabolic effect of consumption of a high- or low-GI meal on the postprandial response of insulin, HOMA-IR, triglyceride, and FFA levels, as these have been implicated as being of importance in the metabolic syndrome, a condition with a high prevalence in postmenopausal women. Our main finding was that, given the comparable macronutrient composition, compared with a low-GI meal, consumption of a high-GI meal raised postprandial glucose, HOMA-IR, and insulin levels in healthy postmenopausal women. Further, our study suggests the presence of a delayed inverse relationship between GI and the postprandial rise of serum triglycerides, in that the low-glycemic meal produced a greater increase of postprandial triglycerides compared with a high-GI meal.
The hypothesis that atherogenesis is a postprandial phenomenon was first proposed more than 25 years ago, and has recently gained increased attention.4 Meal absorption and assimilation is a complex phenomenon that is subject to the overall meal composition as well as environmental, clinical, and genetic factors known to have varying degrees of impact on postprandial hyperglycemia and hyperlipidemia, which may secondarily affect the cardiovascular system, eg, endothelial function.21 Previous postprandial studies, many of which have used very high–fat loads, have established that fasting HDL cholesterol and triglyceride concentrations are important predictors of the postprandial lipemic response.22 Since these lipid levels change during the menopausal transition, studies of the postprandial response in postmenopausal women are of particular importance in understanding an atheroinflammatory response.
In the Bruneck study,23 insulin resistance, as estimated by HOMA-IR, was associated with subsequent symptomatic CVD in the general population, independent of all established, and several nontraditional, risk factors. These data suggest that insulin resistance may be an important target to reduce CVD risk. In a previous study of more than 5000 patients, there appeared to be no association between habitual intake of a high-GI diet and the probability of having insulin resistance as estimated by HOMA-IR.24 In addition, a recent meta-analysis reported findings in support of the concept of postprandial glycemia as a risk factor.25 However, some of the studies failed to demonstrate a correlation between carbohydrate intake and risk, illustrating the need for further studies.25 In our study, a higher-GI meal incited a higher HOMA-IR response. Given the crossover design of our study, this suggests that given comparable levels of macronutrients and identical genetic, clinical, and environmental conditions, the carbohydrate portion accounted for the postprandial response, including a higher degree of acute insulin resistance following the high-GI meal.
After consumption of a meal, triglycerides are subject to lipolysis, a process that contributes to the generation of highly atherogenic triglyceride-containing remnant lipoprotein particles, thus supporting the hypothesis that the postprandial state is proatherogenic.26 In addition to the direct proatherogenic effects of triglyceride, high triglyceride levels are also associated with several established cardiac risk factors, such as diabetes and the metabolic syndrome, as well as with elevated pro-inflammatory markers. In previous studies, elevated postprandial levels of triglyceride, via a higher peak concentration or a delayed clearance in response to a high-fat load, have been associated with insulin resistance.5 Due to the predictive value of postprandial triglyceridemia on CVD risk,27 it has been suggested that analogous to a glucose tolerance test, a “triglyceride tolerance test” using a standardized meal might be developed and adopted as a metabolic risk stratification test. In the present study of healthy postmenopausal women given a low-fat/high-carbohydrate meal, postprandial triglyceride levels were inversely associated with the GI of the meal. These results suggest, as others have found, that triglyceride levels may be more highly impacted by an acute response to the fat content, rather than the carbohydrate content, of the meal.28-30 We also observed an apparent paradoxical effect on triglycerides, as the incremental AUC was larger for the low-glycemic meal. Further studies are needed to address underlying mechanisms.
The role of plasma FFA levels as cardiovascular or metabolic risk factors has attracted less attention than other lipids. However, the importance of preventing an increase in FFA levels is underscored by the association of high FFA concentrations with predisposition to diabetes mellitus type 2, insulin resistance, disordered lipoprotein metabolism, altered vascular reactivity, and abnormal insulin secretion.4 It is suggested that FFAs exert a negative influence on the vessel wall by triggering endothelial apoptosis and impairing endothelium-dependent vasodilatation.22,31,32 Elevated levels of FFAs are associated with higher CVD mortality, possibly through oxidative stress.4 Thus, a growing number of studies implicate higher levels of FFAs as contributing to atherosclerotic risk.4 However, physiologic regulation of plasma FFA levels is complex, and many factors are involved in adipocyte FFA release in response to changing fuel needs and metabolic states. Insulin secretion stimulated by carbohydrate ingestion markedly inhibits FFA release, thereby suppressing FFA concentrations by 80% to 90%.32 In previous reports, the postprandial response of FFAs correlated inversely with the insulin response to the GI of a meal and their rebound was directly proportional.32 However, we were not able to demonstrate a similar response, although postprandial FFA levels decreased more following the high-glycemic meal compared with the low-glycemic meal.
Our study had several unique features. Most of the postprandial studies to date have measured the lipemic response to a standardized, high-caloric meal or a fat-rich meal. We chose to administer a moderate fat and caloric content meal, within the normal food spectrum, and representative of meals aligned with the AHA recommendations but with a variance in the GI. In addition, studies to date have largely looked at men, disease groups such as the human immunodeficiency virus and diabetes mellitus, or young healthy patients. Fewer studies have investigated postmenopausal women from the general population, a group with an increasing cardiovascular risk. Although elevated LDL cholesterol was not a selection criteria in our study, the patients tended to have high levels. However, we focused on the postprandial metabolic response of insulin, HOMA-IR, and triglyceride levels to the test diets, since it is well-known that these parameters are associated with the risk of development of metabolic diseases such as diabetes mellitus and the metabolic syndrome. Further, the risk of these entities increases following menopause.
LIMITATIONS
Despite the unique aspects of our study, a primary limitation is the relatively small number of patients, such that statistical significance and generalizability may be limited. Additional limitations include the highly selected nature of the sample with a low cardiovascular risk profile and the fact that acute metabolic responses to a meal may not necessarily equate to long-term responses.
CONCLUSIONS
Our findings support the notion that a low-fat, low-GI meal suppresses postprandial lipemia in women at risk for CVD. We focused on investigating the postprandial metabolic response to the GI of a meal, and we demonstrated that a higher-GI meal may acutely affect postprandial HOMA-IR, triglyceride, and insulin. Although our study contributes to a better understanding of the postprandial changes that affect cardiovascular risk, many unanswered questions remain, including the effects of GI on FFA, inflammatory markers, and cytokines that may be answered by future studies. Dietary strategies to help optimize prevention of CVD in women in any age group, and in particular in the postmenopausal state, remain a priority. More research is needed to help clarify the best therapeutic alternatives for this important group of patients.
Acknowledgments
Acknowledgements and disclosures: This work was supported by an award to RNB from the University of California, Davis (UC Davis) Women’s Center for Health and the Mentored Clinical Research Training Program, and by the Francis Lazda Endowment in Women’s Cardiovascular Medicine to AV. This publication was also made possible by grant number UL1 RR024146 to the UC Davis Clinical and Translational Science Center from the National Center for Research Resources (NCRR), a component of the National Institutes of Health (NIH), and NIH Roadmap for Medical Research. The authors would like to express their gratitude to all the participants who volunteered their time and to the staff of the UC Davis GCRC at the VA Sacramento Medical Center for their support.
References
- 1.Thom T, Haase N, Rosamond W, et al. Heart disease and stroke statistics – 2006 update: a report from the American Heart Association Statistics Committee and Stroke Statistics Subcommittee. Circulation. 2006;113:e85–e151. doi: 10.1161/CIRCULATIONAHA.105.171600. [DOI] [PubMed] [Google Scholar]
- 2.Knopp RH. Risk factors for coronary artery disease in women. Am J Cardiol. 2002;89:28E–34E. doi: 10.1016/s0002-9149(02)02409-8. discussion 34E–35E. [DOI] [PubMed] [Google Scholar]
- 3.Janssen I, Powell LH, Crawford S, et al. Menopause and the metabolic syndrome: the Study of Women’s Health Across the Nation. Arch Intern Med. 2008;168:1568–1575. doi: 10.1001/archinte.168.14.1568. [DOI] [PMC free article] [PubMed] [Google Scholar]
- 4.Eberly LE, Stamler J, Neaton JD. Relation of triglyceride levels, fasting and nonfasting, to fatal and nonfatal coronary heart disease. Arch Intern Med. 2003;163:1077–1083. doi: 10.1001/archinte.163.9.1077. [DOI] [PubMed] [Google Scholar]
- 5.Bansal S, Buring JE, Rifai N, et al. Fasting compared with nonfasting triglycerides and risk of cardiovascular events in women. JAMA. 2007;298:309–316. doi: 10.1001/jama.298.3.309. [DOI] [PubMed] [Google Scholar]
- 6.Schaefer JR, Klumpp S, Maisch B, et al. Why does atherosclerosis occur where it occurs? Atherosclerosis. 2005;180:417–418. doi: 10.1016/j.atherosclerosis.2005.02.029. [DOI] [PubMed] [Google Scholar]
- 7.Zilversmit DB. Atherogenesis: a postprandial phenomenon. Circulation. 1979;60:473–485. doi: 10.1161/01.cir.60.3.473. [DOI] [PubMed] [Google Scholar]
- 8.Esposito K, Giugliano D. Diet and inflammation: a link to metabolic and cardiovascular diseases. Eur Heart J. 2006;27:15–20. doi: 10.1093/eurheartj/ehi605. [DOI] [PubMed] [Google Scholar]
- 9.Rhee Y, Paik MJ, Kim KR, et al. Plasma free fatty acid level patterns according to cardiovascular risk status in postmenopausal women. Clin Chim Acta. 2008;392:11–16. doi: 10.1016/j.cca.2008.02.012. [DOI] [PubMed] [Google Scholar]
- 10.Third Report of the National Cholesterol Education Program (NCEP) Expert Panel on Detection, Evaluation, and Treatment of High Blood Cholesterol in Adults (Adult Treatment Panel III) final report. Circulation. 2002;106:3143–3421. [PubMed] [Google Scholar]
- 11.Katan MB. The rise and fall of postprandial lipids. Neth J Med. 2004;62:265–266. [PubMed] [Google Scholar]
- 12.Trumbo P, Schlicker S, Yates AA, et al. Dietary reference intakes for energy, carbohydrate, fiber, fat, fatty acids, cholesterol, protein and amino acids. J Am Diet Assoc. 2002;102:1621–1630. doi: 10.1016/s0002-8223(02)90346-9. [DOI] [PubMed] [Google Scholar]
- 13.Deckelbaum RJ, Fisher EA, Winston M, et al. Summary of a scientific conference on preventive nutrition: pediatrics to geriatrics. Circulation. 1999;100:450–456. doi: 10.1161/01.cir.100.4.450. [DOI] [PubMed] [Google Scholar]
- 14.Liu S, Manson JE, Stampfer MJ, et al. Dietary glycemic load assessed by food-frequency questionnaire in relation to plasma high-density-lipoprotein cholesterol and fasting plasma triacylglycerols in postmenopausal women. Am J Clin Nutr. 2001;73:560–566. doi: 10.1093/ajcn/73.3.560. [DOI] [PubMed] [Google Scholar]
- 15.Frost G, Leeds A, Trew G, et al. Insulin sensitivity in women at risk of coronary heart disease and the effect of a low glycemic diet. Metabolism. 1998;47:1245–1251. doi: 10.1016/s0026-0495(98)90331-6. [DOI] [PubMed] [Google Scholar]
- 16.Brand-Miller JC. Glycemic index in relation to coronary disease. Asia Pac J Clin Nutr. 2004;13:S3. [Google Scholar]
- 17.Krauss RM, Eckel RH, Howard B, et al. Revision 2000: a statement for healthcare professionals from the Nutrition Committee of the American Heart Association. J Nutr. 2001;131:132–146. doi: 10.1093/jn/131.1.132. [DOI] [PubMed] [Google Scholar]
- 18.Manach C, Mazur A, Scalbert A. Polyphenols and prevention of cardiovascular diseases. Curr Opin Lipidol. 2005;16:77–84. doi: 10.1097/00041433-200502000-00013. [DOI] [PubMed] [Google Scholar]
- 19.Friedewald WT, Levy RI, Fredrickson DS. Estimation of the concentration of low-density lipoprotein cholesterol in plasma, without use of the preparative ultracentrifuge. Clin Chem. 1972;18:499–502. [PubMed] [Google Scholar]
- 20.Matthews DR, Hosker JP, Rudenski AS, et al. Homeostasis model assessment: insulin resistance and beta-cell function from fasting plasma glucose and insulin concentrations in man. Diabetologia. 1985;28:412–419. doi: 10.1007/BF00280883. [DOI] [PubMed] [Google Scholar]
- 21.Burdge GC, Calder PC. Plasma cytokine response during the postprandial period: a potential causal process in vascular disease? Br J Nutr. 2005;93:3–9. doi: 10.1079/bjn20041282. [DOI] [PubMed] [Google Scholar]
- 22.Boquist S, Ruotolo G, Tang R, et al. Alimentary lipemia, postprandial triglyceride-rich lipoproteins, and common carotid intima-media thickness in healthy, middle-aged men. Circulation. 1999;100:723–728. doi: 10.1161/01.cir.100.7.723. [DOI] [PubMed] [Google Scholar]
- 23.Bonora E, Kiechl S, Willeit J, et al. Insulin resistance as estimated by homeostasis model assessment predicts incident symptomatic cardiovascular disease in caucasian subjects from the general population: the Bruneck study. Diabetes Care. 2007;30:318–324. doi: 10.2337/dc06-0919. [DOI] [PubMed] [Google Scholar]
- 24.Lau C, Faerch K, Glumer C, et al. Dietary glycemic index, glycemic load, fiber, simple sugars, and insulin resistance: the Inter99 study. Diabetes Care. 2005;28:1397–1403. doi: 10.2337/diacare.28.6.1397. [DOI] [PubMed] [Google Scholar]
- 25.Barclay AW, Petocz P, McMillan-Price J, et al. Glycemic index, glycemic load, and chronic disease risk – a meta-analysis of observational studies. Am J Clin Nutr. 2008;87:627–637. doi: 10.1093/ajcn/87.3.627. [DOI] [PubMed] [Google Scholar]
- 26.Ginsberg HN. New perspectives on atherogenesis: role of abnormal triglyceride-rich lipoprotein metabolism. Circulation. 2002;106:2137–2142. doi: 10.1161/01.cir.0000035280.64322.31. [DOI] [PubMed] [Google Scholar]
- 27.Sarwar N, Danesh J, Eiriksdottir G, et al. Triglycerides and the risk of coronary heart disease: 10,158 incident cases among 262,525 participants in 29 Western prospective studies. Circulation. 2007;115:450–458. doi: 10.1161/CIRCULATIONAHA.106.637793. [DOI] [PubMed] [Google Scholar]
- 28.Adam-Perrot A, Clifton P, Brouns F. Low-carbohydrate diets: nutritional and physiological aspects. Obes Rev. 2006;7:49–58. doi: 10.1111/j.1467-789X.2006.00222.x. [DOI] [PubMed] [Google Scholar]
- 29.Droubay PE, Puppione DL. Dietary fat-induced postprandial lipemia: effect on arterial oxygen saturation and plasma lactate, triglyceride, and cholesterol levels in subjects with angina pectoris. Am J Clin Nutr. 1980;33:1199–1207. doi: 10.1093/ajcn/33.6.1199. [DOI] [PubMed] [Google Scholar]
- 30.Sanders TA. Dietary fat and postprandial lipids. Curr Atheroscler Rep. 2003;5:445–451. doi: 10.1007/s11883-003-0034-x. [DOI] [PubMed] [Google Scholar]
- 31.Hufnagel B, Dworak M, Soufi M, et al. Unsaturated fatty acids isolated from human lipoproteins activate protein phosphatase type 2Cbeta and induce apoptosis in endothelial cells. Atherosclerosis. 2005;180:245–254. doi: 10.1016/j.atherosclerosis.2004.12.021. [DOI] [PubMed] [Google Scholar]
- 32.Steinberg HO, Paradisi G, Hook G, et al. Free fatty acid elevation impairs insulin-mediated vasodilation and nitric oxide production. Diabetes. 2000;49:1231–1238. doi: 10.2337/diabetes.49.7.1231. [DOI] [PubMed] [Google Scholar]
- 33.Foster-Powell K, Holt SH, Brand-Miller JC. International table of glycemic index and glycemic load values: 2002. Am J Clin Nutr. 2002;76:5–56. doi: 10.1093/ajcn/76.1.5. [DOI] [PubMed] [Google Scholar]