

Abstract
Abnormal expansion or depletion of particular lymphocyte subsets is associated with clinical manifestations such as HIV progression to AIDS and autoimmune disease. We sought to identify genetic predictors of lymphocyte levels and reasoned that these may play a role in immune-related diseases. We tested 2.3 million variants for association with five lymphocyte subsets, measured in 2538 individuals from the general population, including CD4+ T cells, CD8+ T cells, CD56+ natural killer (NK) cells, and the derived measure CD4:CD8 ratio. We identified two regions of strong association. The first was located in the major histocompatibility complex (MHC), with multiple SNPs strongly associated with CD4:CD8 ratio (rs2524054, p = 2.1 × 10⁻²⁸). The second region was centered within a cluster of genes from the Schlafen family and was associated with NK cell levels (rs1838149, p = 6.1 × 10⁻¹⁴). The MHC association with CD4:CD8 replicated convincingly (p = 1.4 × 10⁻⁹) in an independent panel of 988 individuals. Conditional analyses indicate that there are two major independent quantitative trait loci (QTL) in the MHC region that regulate CD4:CD8 ratio: one is located in the class I cluster and influences CD8 levels, whereas the second is located in the class II cluster and regulates CD4 levels. Jointly, both QTL explained 8% of the variance in CD4:CD8 ratio. The class I variants are also strongly associated with durable host control of HIV, and class II variants are associated with type-1 diabetes, suggesting that genetic variation at the MHC may predispose one to immune-related diseases partly through disregulation of T cell homeostasis.
Main Text
The immune system's ability to eliminate cancer cells, bacteria, and viruses while avoiding self-harm is critical for survival and requires a dynamic regulation of lymphocyte numbers. Disruption of the regulatory mechanisms involved in lymphocyte production, sequestration, or apoptosis can lead to abnormal expansion or depletion of particular subsets, and this is associated with clinical manifestations such as persistent bacterial infections,1 HIV progression to AIDS [MIM 609423],2 and autoimmune disease.3 Because lymphocyte numbers vary among healthy individuals and this variation is partly heritable,4,5 we sought to identify genetic predictors of cell levels and reasoned that these may play a role in immune-related diseases.
Five lymphocyte subsets were measured in the peripheral blood of 2538 adolescent twins from 1089 Australian families ascertained from the general population; these included CD3+ T cells, CD4+ T cells, CD8+ T cells, CD19+ B cells, and CD56+ natural killer (NK) cells (Table S1, available online). Twins were enlisted through primary schools, media appeals, and word of mouth and were tested longitudinally as close as possible to their 12th, 14th, and 16th birthdays in the context of an ongoing study of melanocytic naevi, described in detail elsewhere.6,7 The clinical protocol used for blood collection and processing has been described in detail previously.4 In brief, venous blood samples from the twins and, where possible, from their parents and siblings were collected for hematological assessment (twins and siblings only) and DNA genotyping. The lymphocyte-subset analysis was performed on whole blood with the AutoPrep (Coulter) and direct fluorochrome-conjugated monoclonal antibodies to CD3, CD4, CD8, CD19 and CD56 antigens (Coulter). Analysis was performed on an Epics 753 cytofluorograph (Coulter) with the use of standardized control samples and machine settings. For each lymphocyte subset, outlier observations (5 standard deviations above the mean) at each time of assessment (ages 12, 14, and 16) were excluded from analysis and the average across all available time points was computed. Blood samples were collected between 8:00 a.m. and 5:00 p.m., but there were no significant effects of time of collection on the lymphocyte subsets analyzed. We also analyzed the derived measure CD4:CD8 ratio, which has prognostic utility for diseases such as HIV2 and cancer.8 Traits were adjusted for age and sex effects (if significant) and normalized with an inverse-normal transformation. Trait heritabilities ranged from 76% to 85%, with low to moderate cross-trait phenotypic correlations (Table S2).
Genotyping was performed with the Illumina 610-Quad BeadChip, 529,721 SNPs passing quality control (Table S3). Genomic coverage was extended to 2.3 million SNPs with the use of data from the CEU HapMap samples and MACH (see Web Resources). In brief, we first compared data from a set of 350 randomly chosen individuals with the phased haplotype data from the CEU HapMap samples (phase I+II, release 22, build 36) to generate recombination and error maps. We then used these to impute autosomal HapMap SNPs in groups of ten individuals to speed up the computation by using the same reference panel. After imputation, data were available for 2.5 million SNPs. Of these, we dropped SNPs with an imputation score < 0.3 (indicating low imputation confidence; ∼3%), a minor allele frequency (MAF) < 0.01, or a Hardy-Weinberg equilibrium score of p < 10−6 (∼5%), resulting in a data set with 2,354,458 SNPs available for analysis. Simulations showed that this data set provided 80% power for detection of a quantitative trait locus (QTL) that explained ∼2% of the phenotypic variance (Figure S1). This study was performed with the approval of the appropriate ethics committee and the informed written consent of all participants.
Individual SNPs were tested for association with the family-based SCORE test implemented in Merlin.9 Similar results were obtained for our top regions of association with the more computationally intensive variance-components likelihood-ratio test, which accounts for identity-by-descent sharing when modeling the correlation between relatives (not shown). For imputed SNPs, we analyzed best-guess genotypes; on the basis of a leave-one-out procedure, we estimated that the concordance between our best guess and the actual observed genotypes was high, ranging from 97% (MAF > 0.25) to 99% (MAF < 0.05). Furthermore, the genomic inflation factor was close to 1.00 for all traits (Figure S2), indicating that the analysis of best-guess genotypes instead of allelic dosage had a negligible impact on the results, as did other potential technical artifacts.
Genome-wide association study (GWAS) results are shown in Figure S3 and are available for download (see Web Resources). Two regions exceeded our threshold for significance of p = 8.3 × 10⁻⁹ (Table 1), which was Bonferroni adjusted to account for the six traits tested (5 × 10⁻⁸ / 6). The first region was located in the major histocompatibility complex (MHC), with multiple SNPs strongly associated with CD4:CD8 ratio, CD8 levels, and CD4 levels (Figure S4). The most notable results were for rs2524054, an imputed SNP located in the MHC class I gene cluster that influenced CD4:CD8 ratio (p = 2.1 × 10⁻²⁸) and CD8 levels (p = 6.2 × 10⁻²¹). The second region of strongest association was for NK cell levels on chromosome 17q12 (rs1838149, imputed, p = 6.1 × 10⁻¹⁴) (Figure S5), centered within a cluster of genes from the Schlafen family that regulate thymocyte development.10
Table 1.
Regions of Strongest Association with Variation in Lymphocyte Numbers
| Locus | Trait | SNP, Allele | Panel | N | Allele Frequency | Effecta | SE | h2 (%) | Association p Value |
|---|---|---|---|---|---|---|---|---|---|
| 6p21 | CD4:CD8 | rs2524054, A | GWASb | 2495 | 0.32 | 0.37 | 0.03 | 5.7 | 2.1 × 10⁻²⁸ |
| Replication | 959 | 0.28 | 0.30 | 0.05 | 4.0 | 1.4 × 10⁻⁹ | |||
| 6p21 | CD8 | rs2524054, A | GWAS | 2497 | 0.32 | −0.31 | 0.03 | 4.1 | 6.2 × 10⁻²¹ |
| Replication | 881 | 0.28 | −0.35 | 0.06 | 4.9 | 4.3 × 10⁻⁹ | |||
| 17q12 | NK cells | rs1838149, A | GWAS | 2474 | 0.42 | −0.24 | 0.03 | 2.8 | 6.1 × 10⁻¹⁴ |
| Replication | 584 | 0.36 | −0.08 | 0.07 | 0.3 | 0.240 | |||
| 6p21 | CD4 | rs9271366, G | GWAS | 2498 | 0.18 | 0.25 | 0.04 | 1.8 | 1.9 × 10⁻⁹ |
| Replication | 969 | 0.16 | 0.10 | 0.07 | 0.2 | 0.168 |
Abbreviations are as follows: Freq, allele frequency; SE, standard error of the beta estimate; h2, percentage of phenotypic variance explained by the SNP; NK, natural killer.
Effect corresponds to standard deviation units for the transformed phenotype.
The GWAS panel included 2538 genotyped and phenotyped siblings from 1089 Australian families; genotype data from 1457 parents who were not phenotyped were also included in the analysis.
We first sought to confirm these associations in an independent group of 988 individuals from 550 families also ascertained from the general population (Table S1). This replication data set was composed of two independent panels. The first panel comprised 592 siblings and 386 of their parents (genotypes only) from 272 Australian families also ascertained and tested as part of the melanocytic naevi study described above but not included in the GWAS panel. Genotyping was performed with the Sequenom MassARRAY system; all SNPs had < 5% missing data, a Hardy-Weinberg equilibrium p value > 0.01, and no Mendelian errors. The second panel consisted of 396 siblings from 278 families from the UK, ascertained as part of the TwinsUK study. This is a large cohort of British twins historically developed for the study of the heritability and genetics of diseases with a higher prevalence among women.11 The sample is not enriched for any particular disease or trait and is representative of the British general population.12 The clinical protocol used for blood collection and processing has been described in detail elsewhere5,13 and was equivalent to that used for the Australian samples. NK cells were not measured in this panel. Genotyping was performed with the Illumina 317K or 610-Quad assays. The rs9271366 variant was not available and was therefore imputed with high confidence (imputation score = 0.98) via IMPUTE.14 Ethics approval for this study was obtained from the Guy's and St. Thomas' Hospital Ethics Committee, and written informed consent was obtained from every participant.
In the replication group, a consistent, strong association was observed for the MHC class I variant rs2524054 with both CD4:CD8 ratio (p = 1.4 × 10⁻⁹) and CD8 levels (p = 4.3 × 10⁻⁹), confirming that genetic variation in the MHC is a major determinant of CD8 counts and CD4:CD8 ratio in the population (Table 1). There was no evidence for heterogeneity of effects for rs2524054 between the two replication subgroups (p = 0.25). Consistent but weaker effects were also observed between the 17q12 variant rs1838149 and NK cell levels, as well as between the MHC class II variant rs9271366 and CD4 levels, although these were not significant (p = 0.24 and p = 0.17, respectively). Larger replication cohorts are required to unambiguously confirm these two putative associations. Of note, we also tested for replication the GWAS variant with the strongest association with NK levels among the genotyped (i.e., not imputed) SNPs in the 17q12 region (rs9916629-C, effect = −0.22, p = 4.7 × 10⁻¹¹). We observed a consistent and significant association in the replication group for this variant (effect = −0.18, p = 0.012), suggesting that this locus is indeed likely to be a true-positive finding.
Notable loci (p < 10−6) that did not meet our threshold for genome-wide significance included chromosome 4p16 (Figure S6A), which is associated with CD4:CD8 ratio (rs12644662-C, effect = −0.218, p = 1.5 × 10⁻⁸; closest genes ZFYVE28 and RNF4 [MIM 602850]), and chromosome 12q24 (Figure S6B), with the T allele of rs3184504 associated with increased CD4 levels (effect = 0.159, p = 6.2 × 10⁻⁷). The latter results are consistent with the established association between this nonsynonymous SNP in SH2B3 (MIM 605093) and all major human blood cell types.15
Given the broad association observed between the MHC and CD4:CD8 ratio (Figure S4), we then investigated whether the results were consistent with a single or multiple independent QTL in this region. The strongest association was for rs2524054 in HLA-B (MIM 142830) (Figure 1A), a locus that explained 5.7% of the variance of CD4:CD8 through the regulation of CD8 but not CD4 levels (Table S4).
Figure 1.
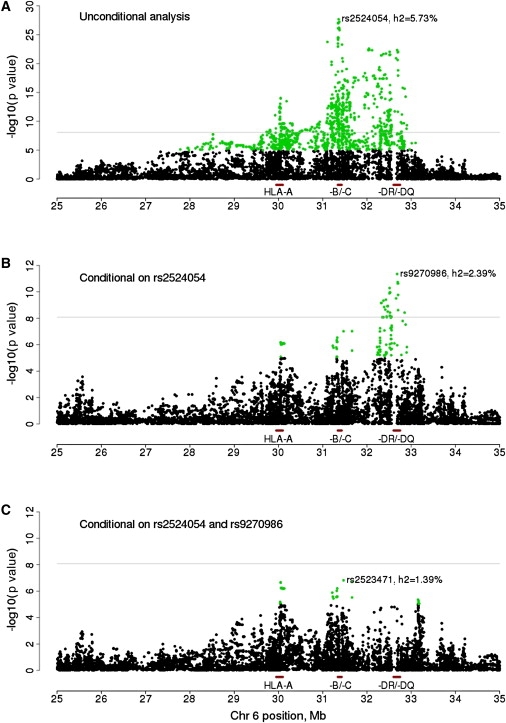
Association Analysis of MHC Variants and CD4:CD8 Ratio
Results are shown (A) before and after conditioning on (B) HLA-B and (C) both HLA-B and HLA-DRB1 peak variants. The proportion of phenotypic variance explained (h2) is shown for the most-associated SNP in each panel. Horizontal line indicates a p value of 8.3 × 10⁻⁹. SNPs with a p value < 1 × 10⁻⁵ are highlighted in green.
After conditioning on this MHC class I signal, there was evidence for a secondary peak for CD4:CD8 ratio in the MHC class II gene cluster, explaining 2.4% of the trait variance (Figure 1B). The most strongly associated variant was now rs9270986 (p = 4.4 × 10⁻¹²), which was located 16 kb upstream of the HLA-DRB gene complex and influenced CD4 but not CD8 levels (Table S4). We also tested this variant for association in the replication panel and observed a significant, consistent effect (p = 1.1 × 10⁻⁴, 3.1% of the CD4:CD8 variance explained). When the associations in HLA-B and HLA-DRB were accounted for, there were three residual independent association peaks near the MICA (MIM 600169) (rs2523471, p = 1.5 × 10⁻⁷), HLA-A (MIM 142800) (rs2523946, p = 1.4 × 10⁻⁷), and HLA-DP genes (rs1431403, p = 9.1 × 10⁻⁷) (Figure 1C), each explaining 1.2%–1.4% of the variation in CD4:CD8 ratio (Table S4). No variant explained > 1% of the CD4:CD8 variance after the top HLA-B, HLA-DRB, MICA, HLA-A, and HLA-DP variants were accounted for.
Taken together, our results indicate that there are two major independent QTL in the MHC region that regulate CD4:CD8 ratio in the general population. One is located in the class I cluster and accounts for 4.1% of the phenotypic variance of CD8 in our sample. Given that the most-associated variant in this region correlated with both HLA-B and CCHR1 gene expression16 (Table S5), either of these genes is a likely causal candidate. The second QTL is located in the MHC class II cluster and regulates CD4 levels. Gene expression results16 point to HLA-DRB1 (MIM 142857), HLA-DQB1 (MIM 604305), or HLA-DQA1 (MIM 146880) as likely candidates for this association (Table S5). Jointly, the additive effects of both QTL explain 8% of the variance in CD4:CD8 ratio, with some evidence for dominance but no significant epistatic effects (Table S6). Additional independent variants with smaller effects may exist in the region, as exemplified by rs2523471 (MICA), rs2523946 (HLA-A), and rs1431403 (HLA-DP), but these need to be studied in larger samples.
Finally, we investigated whether the two MHC variants independently associated with CD4:CD8 ratio were also likely to play a role in the etiology of immune-related diseases. In the Wellcome Trust Case-Control Consortium study (Table S7), the A allele of rs9270986 (class II) was strongly protective against type-1 diabetes (T1D; odds ratio [OR] = 0.04, p = 1.0 × 10−125) and rheumatoid arthritis (RA; OR = 0.60, p = 2.7 × 10⁻¹⁵), as previously reported.17,18 The same allele was associated with increased CD4 levels in our data set and was in complete linkage disequilibrium with HLA-DQB1∗0602 (r2 = 1) (Table S7), a T1D-protective allele17 that appears to decrease CD4 T cell apoptosis.19 An association of high CD4 counts with an MHC class II allele known to be protective for these diseases is surprising, because predisposition to cell-mediated autoimmune disease is held to be associated with thymic selection of cells with higher than normal affinity for MHC-peptide, a genetically determined property of the T cells.20,21 If confirmed, these results suggest that the extent of selection of a regulatory rather than an effector CD4 cell population may contribute to disease risk conveyed by these alleles.
On the other hand, the A allele of rs2524054 (class I), which was associated with decreased CD8 levels in our analysis, was predisposing for T1D (OR = 1.33, p = 3.3 × 10⁻⁹). This suggests that repertoire selection in T1D may preferentially favor self-reactive T cells because this MHC allele binds self-peptide poorly, favoring both a smaller number of surviving T cells and a higher percentage of self-reactivity.
We also tested whether the two variants influenced lymphocyte numbers in HIV-positive patients. A hallmark of chronic, untreated HIV-1 infection is the gradual depletion of CD4 T cells and the expansion of CD8 T cells, resulting in a marked reduction of the CD4:CD8 ratio. Therefore, we focused on HIV controllers (Table S8), individuals who naturally control HIV-1 viremia to extremely low or undetectable levels without antiretroviral medications, minimizing the risk of confounding due to the effect of persistent viremia. Neither variant showed a statistically significant association with CD4:CD8 ratio (Table S9), but the A allele of rs2524054 was strongly associated with immune control of HIV-1 viremia when the controllers were compared to a group of HIV-1 progressors (OR = 0.32, p = 9.1 × 10⁻¹¹) (Table S7). This result raises the interesting possibility that genetic variants that regulate the CD4:CD8 ratio may play a role in natural control of HIV-1 viremia. Whether the variants discovered in this study protect one against or predispose one to HIV-1 infection is an interesting hypothesis that could not be tested in this patient population and warrants further investigation.
In conclusion, we provide evidence that two independent QTL located in class I and class II MHC genes regulate the CD4:CD8 T cell ratio in the general population. To our knowledge, these represent the first confirmed QTL for this trait in humans. Given that both are also associated with risk of T1D, RA, or host control of HIV in independent cohorts, we speculate that genetic variation at these loci may predispose one to immune-related diseases partly through disregulation of T cell homeostasis.
Acknowledgments
QIMR: We thank the Brisbane twins and their families for their participation; Dixie Statham, Ann Eldridge, Marlene Grace; Lisa Bowdler, Steven Crooks; David Smyth, Harry Beeby, and Peter Visscher. Funding: Australian National Health and Medical Research Council (NHMRC; grants 241944, 339462, 389927, 389875, 389891, 389892, 389938, 443036, 442915, 442981, 496739, 552485, 552498); Australian Research Council (A7960034, A79906588, A79801419, DP0212016, DP0343921). Twins UK study: We thank the Wellcome Trust Sanger Institute Genotyping Facilities staff (Leena Peltonen, Panos Deloukas); Le Centre National de Génotypage (Mark Lathrop); Duke University (David Goldstein); Finnish Institute of Molecular Medicine, Finnish Genome Center, University of Helsinki (Aarno Palotie). Funding: Wellcome Trust; EC Seventh Framework Programme (FP7/2007-2013, HEALTH-F2-2008-201865-GEFOS); ENGAGE (HEALTH-F4-2007-201413); FP-5 GenomEUtwin Project (QLG2-CT-2002-01254); Department of Health, National Institute for Health Research, Biomedical Research Centre award; Biotechnology and Biological Sciences Research Council (G20234); National Eye Institute (Terri Young). HIV study: Funding: the Mark and Lisa Schwartz Foundation and the Bill and Melinda Gates Foundation (The International HIV Controllers Study); NIH grants AI069513, AI34835, AI069432, AI069423, AI069477, AI069501, AI069474, AI069428, AI69467, AI069415, Al32782, AI27661, AI25859, AI069495, AI069471, AI069532, AI069452, AI069450, AI069556, AI069484, AI069472, AI34853, AI069465, AI069511, AI38844, AI069424, AI069434, AI46370, AI069502, AI069419, AI068636, and RR024975 (AIDS Clinical Trials Group); NIH grants AI077505 and MH071205 (D.W.H.).
Supplemental Data
Web Resources
The URLs for data presented herein are as follows:
Genome-wide association results, http://genepi.qimr.edu.au/staff/manuelF/gwas_results/main.html
Online Mendelian Inheritance in Man (OMIM), http://www.ncbi.nlm.nih.gov/Omim/
References
- 1.de la Calle-Martin O., Hernandez M., Ordi J., Casamitjana N., Arostegui J.I., Caragol I., Ferrando M., Labrador M., Rodriguez-Sanchez J.L., Espanol T. Familial CD8 deficiency due to a mutation in the CD8 alpha gene. J. Clin. Invest. 2001;108:117–123. doi: 10.1172/JCI10993. [DOI] [PMC free article] [PubMed] [Google Scholar]
- 2.Fahey J.L., Taylor J.M., Detels R., Hofmann B., Melmed R., Nishanian P., Giorgi J.V. The prognostic value of cellular and serologic markers in infection with human immunodeficiency virus type 1. N. Engl. J. Med. 1990;322:166–172. doi: 10.1056/NEJM199001183220305. [DOI] [PubMed] [Google Scholar]
- 3.Tsai S., Shameli A., Santamaria P. CD8+ T cells in type 1 diabetes. Adv. Immunol. 2008;100:79–124. doi: 10.1016/S0065-2776(08)00804-3. [DOI] [PubMed] [Google Scholar]
- 4.Evans D.M., Frazer I.H., Martin N.G. Genetic and environmental causes of variation in basal levels of blood cells. Twin Res. 1999;2:250–257. doi: 10.1375/136905299320565735. [DOI] [PubMed] [Google Scholar]
- 5.Hall M.A., Ahmadi K.R., Norman P., Snieder H., MacGregor A.J., Vaughan R.W., Spector T.D., Lanchbury J.S. Genetic influence on peripheral blood T lymphocyte levels. Genes Immun. 2000;1:423–427. doi: 10.1038/sj.gene.6363702. [DOI] [PubMed] [Google Scholar]
- 6.Aitken J.F., Green A.C., MacLennan R., Youl P., Martin N.G. The Queensland Familial Melanoma Project: study design and characteristics of participants. Melanoma Res. 1996;6:155–165. doi: 10.1097/00008390-199604000-00011. [DOI] [PubMed] [Google Scholar]
- 7.McGregor B., Pfitzner J., Zhu G., Grace M., Eldridge A., Pearson J., Mayne C., Aitken J.F., Green A.C., Martin N.G. Genetic and environmental contributions to size, color, shape, and other characteristics of melanocytic naevi in a sample of adolescent twins. Genet. Epidemiol. 1999;16:40–53. doi: 10.1002/(SICI)1098-2272(1999)16:1<40::AID-GEPI4>3.0.CO;2-1. [DOI] [PubMed] [Google Scholar]
- 8.Sato E., Olson S.H., Ahn J., Bundy B., Nishikawa H., Qian F., Jungbluth A.A., Frosina D., Gnjatic S., Ambrosone C. Intraepithelial CD8+ tumor-infiltrating lymphocytes and a high CD8+/regulatory T cell ratio are associated with favorable prognosis in ovarian cancer. Proc. Natl. Acad. Sci. USA. 2005;102:18538–18543. doi: 10.1073/pnas.0509182102. [DOI] [PMC free article] [PubMed] [Google Scholar]
- 9.Chen W.M., Abecasis G.R. Family-based association tests for genomewide association scans. Am. J. Hum. Genet. 2007;81:913–926. doi: 10.1086/521580. [DOI] [PMC free article] [PubMed] [Google Scholar]
- 10.Schwarz D.A., Katayama C.D., Hedrick S.M. Schlafen, a new family of growth regulatory genes that affect thymocyte development. Immunity. 1998;9:657–668. doi: 10.1016/s1074-7613(00)80663-9. [DOI] [PubMed] [Google Scholar]
- 11.Spector T.D., MacGregor A.J. The St. Thomas' UK Adult Twin Registry. Twin Res. 2002;5:440–443. doi: 10.1375/136905202320906246. [DOI] [PubMed] [Google Scholar]
- 12.Andrew T., Aviv A., Falchi M., Surdulescu G.L., Gardner J.P., Lu X., Kimura M., Kato B.S., Valdes A.M., Spector T.D. Mapping genetic loci that determine leukocyte telomere length in a large sample of unselected female sibling pairs. Am. J. Hum. Genet. 2006;78:480–486. doi: 10.1086/500052. [DOI] [PMC free article] [PubMed] [Google Scholar]
- 13.Ahmadi K.R., Hall M.A., Norman P., Vaughan R.W., Snieder H., Spector T.D., Lanchbury J.S. Genetic determinism in the relationship between human CD4+ and CD8+ T lymphocyte populations? Genes Immun. 2001;2:381–387. doi: 10.1038/sj.gene.6363796. [DOI] [PubMed] [Google Scholar]
- 14.Marchini J., Howie B., Myers S., McVean G., Donnelly P. A new multipoint method for genome-wide association studies by imputation of genotypes. Nat. Genet. 2007;39:906–913. doi: 10.1038/ng2088. [DOI] [PubMed] [Google Scholar]
- 15.Gudbjartsson D.F., Bjornsdottir U.S., Halapi E., Helgadottir A., Sulem P., Jonsdottir G.M., Thorleifsson G., Helgadottir H., Steinthorsdottir V., Stefansson H. Sequence variants affecting eosinophil numbers associate with asthma and myocardial infarction. Nat. Genet. 2009;41:342–347. doi: 10.1038/ng.323. [DOI] [PubMed] [Google Scholar]
- 16.Dixon A.L., Liang L., Moffatt M.F., Chen W., Heath S., Wong K.C., Taylor J., Burnett E., Gut I., Farrall M. A genome-wide association study of global gene expression. Nat. Genet. 2007;39:1202–1207. doi: 10.1038/ng2109. [DOI] [PubMed] [Google Scholar]
- 17.Nejentsev S., Howson J.M., Walker N.M., Szeszko J., Field S.F., Stevens H.E., Reynolds P., Hardy M., King E., Masters J. Localization of type 1 diabetes susceptibility to the MHC class I genes HLA-B and HLA-A. Nature. 2007;450:887–892. doi: 10.1038/nature06406. [DOI] [PMC free article] [PubMed] [Google Scholar]
- 18.Wellcome Trust Case-Control Consortium Genome-wide association study of 14,000 cases of seven common diseases and 3,000 shared controls. Nature. 2007;447:661–678. doi: 10.1038/nature05911. [DOI] [PMC free article] [PubMed] [Google Scholar]
- 19.Glisic S., Klinker M., Waukau J., Jailwala P., Jana S., Basken J., Wang T., Alemzadeh R., Hagopian W., Ghosh S. Genetic association of HLA DQB1 with CD4+CD25+(high) T-cell apoptosis in type 1 diabetes. Genes Immun. 2009;10:334–340. doi: 10.1038/gene.2009.14. [DOI] [PubMed] [Google Scholar]
- 20.Thomas R., Turner M., Cope A.P. High avidity autoreactive T cells with a low signalling capacity through the T-cell receptor: central to rheumatoid arthritis pathogenesis? Arthritis Res. Ther. 2008;10:210. doi: 10.1186/ar2446. [DOI] [PMC free article] [PubMed] [Google Scholar]
- 21.Au-Yeung B.B., Deindl S., Hsu L.Y., Palacios E.H., Levin S.E., Kuriyan J., Weiss A. The structure, regulation, and function of ZAP-70. Immunol. Rev. 2009;228:41–57. doi: 10.1111/j.1600-065X.2008.00753.x. [DOI] [PubMed] [Google Scholar]
Associated Data
This section collects any data citations, data availability statements, or supplementary materials included in this article.