

Abstract
In our ongoing search for production improvements of bioactive secondary metabolites from marine Streptomyces through the induction of mutations using UV light, out of 145 isolates, mutant 10/14 was able to produce potent antibacterial metabolites other than the parent strain as established by chromatographic analysis. Up-scaling fermentation of mutant 10/14, followed by working up and isolation delivered five metabolites, phenazine, 1-acetyl-β -carboline, perlolyrin and erythromycin A, along with an oily substance. The latter two compounds were responsible for the antibacterial activity of the strain. In this article, we discuss with the mutation of the marine Streptomyces sp. AH2, bioactivity evaluation, fermentation and isolation of the microbial metabolites. Moreover, we study to first time in detail the 1D and 2D NMR and ESI MS data including ESI MS2 and MS3 patterns combined with HRESI MS of erythromycin A.
Keywords: Marine Streptomyces mutation, bioactivity evaluation, ESI-MS/MS, erythromycin A
In recent years, marine microorganisms have been given attention as a prodigious source of compounds with intriguing structures and interesting biological activity for drug development. Marine filamentous bacteria, belonging to the genus Streptomyces of Actinomycetes are an exceptionally rich source for a huge number of secondary metabolites. They are known as one of the most prospective natural sources for production of antibiotics and antitumor compounds1–3.
Many members of the anthracyclin family are clinically very useful antineoplastic agents with a broad spectrum of activities extending to certain solid tumours that are normally resistant to most other modes of chemotherapy4,5. The clinical use of such drugs, however, is hampered by a number of undesired side effects, the most serious being the dose-related cardiotoxicity. There is therefore a great interest in related natural or synthetic compounds having improved therapeutic indices4–6.
Induction of mutations is one of the applied techniques which uses different types of chemical and physical mutagens, either individually or in different combinations, doses and times7–10. Wieczorek and Mordarski11 treated S. olivaceus with UV irradiation leading to mutants different from the original strain, not only in their spectrum of antimicrobial activity, but also in the taxonomic properties, e.g. colour of the aerial mycelium, liquefaction of gelatine, growth on cellulose, production of ammonia and nitrate reduction. Lee and Rho12 obtained tylosin hyper-producing mutants after treatment of S. fradiae NRRL 2702 with either n-nitroso-guanidine (NTG) or exposing to UV. Cheng et al.13 have varied the productivity of S. hygroscopicus FC 904 (the producer of rapamycin) to 60-124% after mutagenesis by NTG and UV. Khattab and EL-Bondkly14 used TLC technique to distinguish the produced bioactive components obtained by selected superior mutants compared with the wild type strain. In connection with our search for bioactive components with potential medical application, the marine Streptomyces sp. isolate AH2 was subjected to mutation by UV-light. During our biological screening, the most prolific producer of bioactive constituents, mutant 10/14 was selected, upscaled and the bioactive constituents isolated and identified. The potent antibacterial activity of mutant 10/14 was attributed to the major two components, erythromycin A (1) and an oily substance, HM1. We report here the detailed ESI-MS analysis of erythromycin A (1) combined with HRESI-MS along with 2D NMR spectra.
MATERIALS AND METHODS
NMR spectra were measured on Varian Unity 300 (300.145 MHz) and Varian Inova 600 (599.876 MHz) spectrometers. ESI mass spectra were recorded on a Finnigan LCQ with quaternary pump Rheos 4000 (Flux Instrument). EIMS was performed on a Finnigan MAT95 (70 eV) with perfluorokerosene as reference. IR spectra were recorded on a Perkin-Elmer 1600 Series FT-IR spectrometer (KBr pellets). UV/Vis spectra were recorded on a Perkin-Elmer Lambda 15 UV/VIS spectrometer. Thin layer chromatography (TLC) was performed on Polygram SIL G/UV254 (Macherey-Nagel and Co.). Rf values were measured on Polygram SIL G/UV254 (Macherey-Nagel and Co.). Size exclusion chromatography was done on Sephadex LH-20 (Pharmacia).
Microorganisms and culture conditions:
Marine Streptomyces species AH2 was isolated from Suez Canal, Ismailia, Egypt, and was identified according to Bergey's Manual of Systematic Bacteriology 198915. The original marine Streptomyces sp. isolate AH2 and their mutants were cultivated at 28° on Trypticase Soy Broth (TSB) medium (Merck Co.) using 75% sea water and 25% distilled water. For seed culture preparation, a loopful of mycelium and spores were taken from the slope culture and used to inoculate 250 ml flask containing 25 ml of TSB medium and then incubated at 28° for 2 d. Five ml of seed culture were used to inoculate 250 ml flasks containing 50 ml TSB medium, and the cultivated flasks were further incubated for additional 5 days at 28° on a rotary shaker (220 rpm). For cultivation of the test bacterial strains (Escherichia coli NRRL B-766, Bacillus subtilis NRRL B-543 and Micrococcus luteus NRRL B-287) Luria Broth (LB) medium was used. It contains (g/l):tryptone (10); yeast extract (5); NaCl (10); Agar (15) and the pH was adjusted to 7.0. Discs used for Antibiotic assay, Whatman product No. 2017, six mm diameter, were saturated with 25 µl supernatant extract of each isolate in comparison with the original strain.
Mutagenesis:
Marine Streptomyces sp. AH2 spores from old slants (7 days) were suspended in sterile distilled water and exposed to UV light (Philips T-UV-30 W lamp type number 57413 p/40) for 5, 10 and 15 min at a distance of 20 cm. After irradiation, the treated suspensions were kept in dark for ~ one hour. Appropriate dilutions were spread on TSB medium and incubated at 28° for 5 d. The growing colonies were transplanted on slants for further studies14.
Fermentation of strain, extraction and separation:
Twenty litres of fermentation medium (TSB) were inoculated with 10% seeding of 10/14 mutant for five days at 28°. After fermentation, the pH of the culture broth had dropped to 3.9. The filtrate was extracted with ethyl acetate, and the organic extract was concentrated in vacuo to 500 ml, washed with brine (2×50 ml), then dried over Na2SO4, and then evaporated in vacuo to dryness. The dark brown extract (748 mg) was flash chromatographed on silica gel of particle size (30-60 μm, 2×70 cm) eluting with an n-hexane/ethyl acetate gradient to deliver five fractions I, n-hexane; II, n-hexane-EtOAc (9:1); III, n-hexane-EtOAc (3:1); IV, n-hexane-EtOAc (1:1); V, EtOAc. Purification of the fast fraction I using silica gel (0.014-0.040 μm, 0.8×50 cm) and eluting with n-hexane/DCM gradient led to phenazine (2 mg), a greenish-yellow solid. Purification of fraction II on silica gel (0.014-0.040 μm, 0.8×50 cm) eluting with petroleum ether/Et2 O-gradient led to 1-acetyl-β-carboline (5 mg) and perlolyrin (3 mg) as two pale yellow solids. On subjecting the middle polar fraction (III) to further purification on silica gel (0.014-0.040 μm, 0.8×50 cm) using n-hexane/ethyl acetate, a crude white solid substance was obtained. Re-crystallization of the substance from n-hexane/ethyl acetate and from chloroform, respectively, yielded 12 mg of erythromycin A (1) as a white solid. Finally, purification of the high polar fraction V by silica gel (0.014-0.040 μm, 0.8x50 cm) using a DCM/MeOH gradient followed by Sephadex LH-20 (DCM/40%MeOH) delivered 44 mg HM1 as an oily substance.
RESULTS AND DISCUSSION
Mutation was used as a major tool for the induction of a wide range of genetic variations for selection of higher antibiotic producers of marine streptomycetes. After treatment of the marine Streptomyces sp. AH2 with UV irradiation for different exposure times; 5, 10, 15 min, respectively, 145 isolates were obtained, and their productivity of bioactive compounds was examined.
Only 17, of all examined isolates were confirmed to produce higher (>10%) bioactivity than the original strain (AH2) (Table 1). Five (3.5%), nine (6.2%) and three (2.1%) mutants were isolated after treatment with UV light for 5, 10 and 15 min, respectively. It is obvious that a 10 min UV exposure time yields a higher number of mutants, with higher productivity of antibiotics than the parental strain. Three mutants (5/2, 10/9 and 10/14) were found to deliver 83.3% higher antibiotic activity against E. coli than the original strain, while four mutants 5/2, 10/9, 10/14 and 15/17 produced ~62.5% more antibiotic productivity than the original strain against B. subtilis. Seven mutants (5/2, 5/25, 10/9, 10/14, 10/15, 15/17 and 15/19) were observed to produce ~55.6% higher antibiotic activity against M. luteus. (Table 1)
TABLE 1.
TABLE 1: ANTIBIOTIC PRODUCTION CAPACITIES FOR MARINE STREPTOMYCES SP. INDUCED MUTANTS COMPARED WITH THE ORIGINAL STRAIN (AH2)
| Isolate | Antibiotic productivity | ||||||||
|---|---|---|---|---|---|---|---|---|---|
| E. coli | B. subtilis | M. luteus | |||||||
| mm* | μg/ml† | % versus W.T. | mm* | μg/ml† | % versus W.T. | mm* | μg/ml† | % versus W.T. | |
| W.T. | 16 | 300 | 100.0 | 22 | 400 | 100.0 | 25 | 450 | 100.0 |
| 5/2 | 22 | 550 | 183.3 | 30 | 650 | 162.5 | 30 | 700 | 155.6 |
| 5/6 | 18 | 400 | 133.3 | 25 | 500 | 125.0 | 27 | 525 | 116.7 |
| 5/8 | 18 | 400 | 133.3 | 28 | 575 | 143.8 | 28 | 600 | 133.3 |
| 5/15 | 17 | 350 | 116.7 | 26 | 525 | 131.3 | 28 | 600 | 133.3 |
| 5/25 | 20 | 500 | 166.7 | 29 | 600 | 150.0 | 30 | 700 | 155.6 |
| 10/3 | 18 | 400 | 133.3 | 26 | 525 | 131.3 | 28 | 600 | 133.3 |
| 10/8 | 19 | 450 | 150.0 | 28 | 575 | 143.8 | 29 | 650 | 144.4 |
| 10/9 | 22 | 550 | 183.3 | 30 | 650 | 162.5 | 30 | 700 | 155.6 |
| 10/11 | 18 | 400 | 133.3 | 26 | 525 | 131.3 | 28 | 600 | 133.3 |
| 10/12 | 17 | 350 | 116.7 | 25 | 500 | 125.0 | 28 | 600 | 133.3 |
| 10/14 | 22 | 550 | 183.3 | 32 | 700 | 175.0 | 33 | 750 | 166.7 |
| 10/15 | 20 | 500 | 166.7 | 29 | 600 | 150.0 | 30 | 700 | 155.6 |
| 10/19 | 19 | 450 | 150.0 | 28 | 575 | 143.8 | 29 | 650 | 144.4 |
| 10/22 | 18 | 400 | 133.3 | 26 | 525 | 131.3 | 26 | 500 | 111.1 |
| 15/17 | 20 | 500 | 166.7 | 30 | 650 | 162.5 | 30 | 700 | 155.6 |
| 15/11 | 19 | 450 | 150.0 | 28 | 575 | 143.8 | 29 | 650 | 144.4 |
| 15/19 | 20 | 500 | 166.7 | 29 | 600 | 150.0 | 30 | 700 | 155.6 |
Inhibition zone diameter
Antibiotic production according to erythromycin in standard cure
From the above study, the mutations of the marine Streptomyces sp AH2 genome by UV treatment, affected the production of antibiotics qualitatively and quantitatively. Chromatographic analysis of extracts of the selected 17 mutants using TLC in comparison with those of AH2, established that mutant 10/14 was the only one, which displayed more bands than the original one, and it was the most antibiotically active strain against all tested bacteria.
Chemical screening of the mutant 10/14 extract using TLC monitoring exhibited two major bands, which were not present in extracts of the parent strain. The first of them was Polar with no UV absorbance, which turned brown by spraying with anisaldehyde/sulphuric acid, and later to green. The other one showed an intensively blue UV fluorescence polar band, which turned yellow by anisaldehyde/sulphuric acid after heating.
Fermentation of a 20 L shaker culture using TSB medium at 28° was continued for 5 d. The culture broth was separated by centrifugation and extraction with ethyl acetate at pH 4. According to TLC monitoring, the mycelial cake did not contain interesting compounds and was discarded. The extract of filtrate was concentrated in vacuo followed by washing with brine and drying with anhydrous sodium sulphate. Finally, it was evaporated to dryness yielding a sticky brown extract.
Structures of the known compounds, phenazine16, 1-acetyl-β-carboline17 and perlolyrin18 were established on the bases of their chromatographic properties, NMR and MS spectroscopy as well as comparison with authentic spectra19.
Erythromycin A (1), a colourless solid, showed no UV absorbance (254 nm) or fluorescence (366 nm), however, it exhibited a brown colour by spraying with anisaldehyde/sulphuric acid, which turned later to green. The UV spectra displayed a peak at λmax ~ 280, which is slightly bathochromic shifted in acidic solution to λmax 289 nm. The IR spectra of 1 displayed an absorption band at ν 3450 cm-1 (hydroxyl/amino groups). Two strong bands at ν 1740 and 1720 are indicative for carbonyls of ester and ketone systems. It was lacking olefinic or aromatic signals, but displayed two strong bands between ν 1480~1340 cm-1 of methyl and methylene groups (Table 2).
TABLE 2.
PHYSICO-CHEMICAL PROPERTIES OF ERYTHROMYCIN A (1)
| Erythromycin A (1) | |
|---|---|
| Appearance | Colourless solid |
| Rf | 0.61‡ |
| Molecular formula | C37H68NO13 |
| (+)-ESI-MS: m/z (%) | 734.3 [M+H]+ (100), 756.4 [M+Na]+, (12), 1489.3 [2M+Na], (32) |
| (-)-ESI-MS: m/z (%) | 778.3 [M+HCOO]- |
| (+)-HRESI-MS | |
| Found | 734.46835 (M+H; C37H68NO13) |
| Calc. | 734.46850 (M+H; C37H68NO13) |
| IR (KBr) | 3450, 2950, 1740, 1720, 1480, 1450, 1440, 1380, 1340, 1250, 1050 |
| UV/VIS λmax | 282 (ε 30, EtOH), 278 (ε 27, MeOH), 289 (ε 25.7, pH 6 buffer) |
| (α)25D(EtOH) | -78 (c, 1.99) |
EtOAC/MeOH/ACOH/H2O (3:3:0:5:0:5)
ESI MS of 1 showed three quasi molecular ion peaks at m/z 734.3 (M+H), 756.4 (M+Na) and 1489.3 (2M+Na) in the (+)-ESI-MS mode, and one at m/z 778.3 (M+HCOO- ) in the (-)-ESI-MS mode. This established the molecular weight as 733 Dalton, which is indicative of the existence of an odd number of nitrogen atoms. HRESI MS of 1 [m/z 734.4683850, (M+H)] established the molecular formula as C37 H67 NO13, bearing 5 double bond equivalents. Compound 1 was subjected to detailed ESI-MS2 and MS3 fragmentations combined with HRESI-MS, from which, 9 and 11 peak-fragments, respectively, were assigned (Table 3).
TABLE 3.
ESI-MS2 AND ESI-MS3 FRAGMENTATIONS OF ERYTHROMYCIN A (1)
| HRESI-MS2- quasi ion fragments (MeOH+NH4OAc) | Formula | HRESI-MS3- quasi ion fragments (MeOH/H2O+Facid) | Formula |
|---|---|---|---|
| 576.37487 | C29H54NO10 | 716.45777 (M-H2O) | C37H66NO12 |
| 558.36408 | C29H52NO9 | 698.44724 (M-2H2O) | C37H64NO11 |
| 540.35349 | C29H50NO8 | 576.37484 (M-[3-methoxy-mycarose-H]) | C29H54NO10 |
| 522.34292 | C29H48NO7 | 558.36434 | C29H52NO9 |
| 464.30119 | C26H42NO6 | 540.35387 | C29H50NO8 |
| 408.27500 | C23H38NO5 | 522.34329 (M-[3-methoxy-mycarose-H]-3H2O) | C29H48NO7 |
| 342.22805 | C18H32NO5 | 464.30176 | C26H42NO6 |
| 233.15394 | C15H21O2 | 408.27500 | C23H38NO5 |
| 158.11770 | C8H16NO2 | 342.22863 | C18H32NO5 |
| 233.15369 | C15H21O2 | ||
| 158.11778 | C8H16NO2 |
The common base peak fragment in both cases at m/z 158.1177 (C8H16NO2) was attributed to desosamine (A), and the later was further established by the characteristic N(CH3)2 signal at δ 2.38 in the 1H NMR spectrum. On the other hand, the neutral sugar, 3-methoxy-mycarose (B) was established by the existence of a typical ion at m/z 576.37484 (C29H54NO10 M-[3-methoxy-mycarose-H]), beside a characteristic methyl ether signal in the NMR spectrum (δH 3.26 and δC 49.4). The conjugated macrolide system still containing the desosamine moiety (3, m/z 522.34329 (C29 H48 NO7)) afforded after a consecutive loss of water the fragment ions at m/z 716.45777 (M-H2O), 698.44724 (M-2H2O), followed by the expulsion of mycarose sugar moiety (fig. 2a,b). Compound 3 is not known from nature or synthetic chemistry, while 5-O-desosaminylerythronolid A (4) does naturally exist (fig. 1).
Fig. 2a.
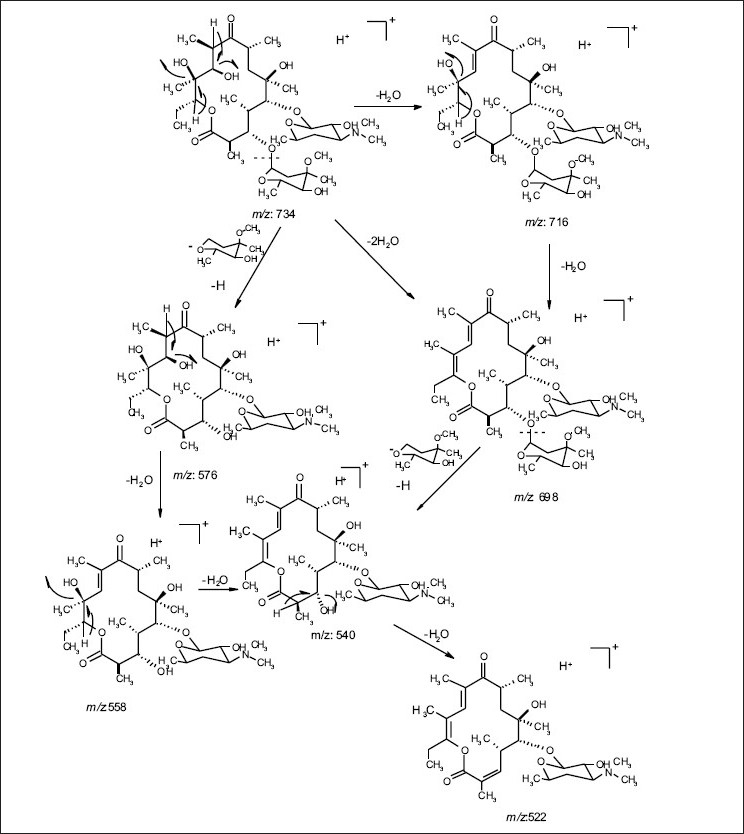
ESI-MS-MS fragmentations of erythromycin A(1)
Fig. 2b.
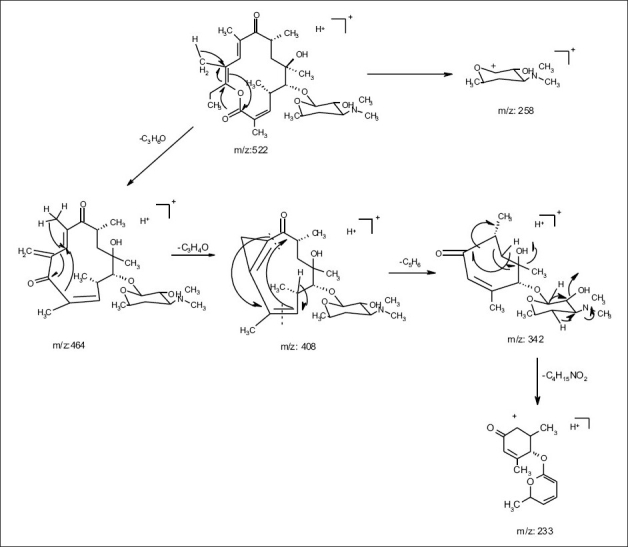
(+)-ESI-MS-MS fragmentations of erythromycin A (1)
Fig. 1.
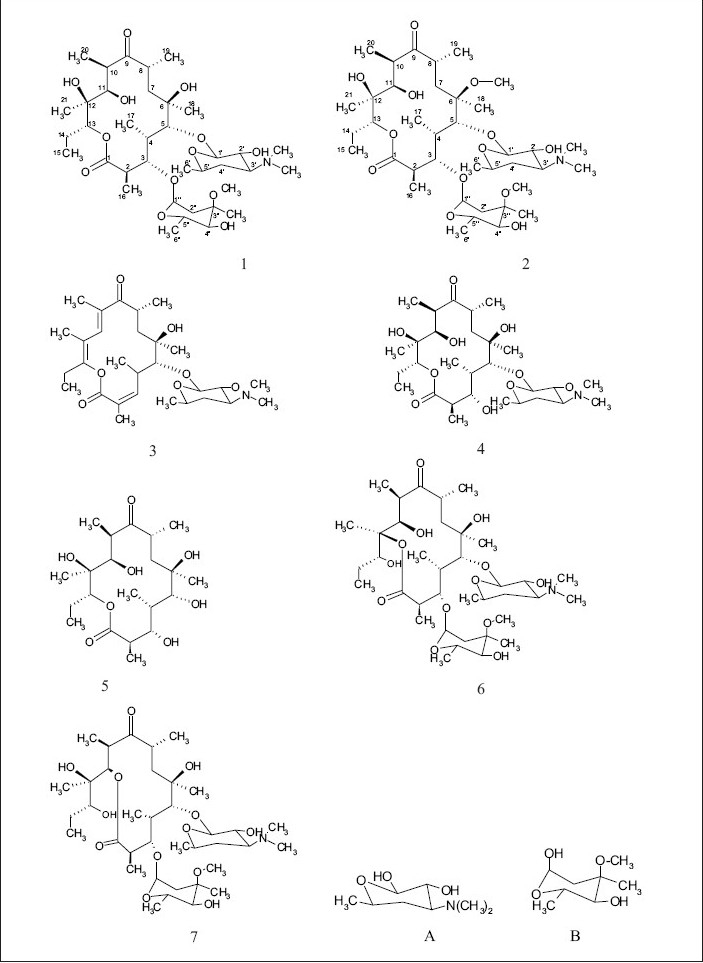
Structural formula of the macrolides 1-7 beside to the sugars A and B.
It has been shown20,21 that erythromycins are assembled in Sac. erythraea from propionate and methyl malonate units initially forming the ‘aglycone’ 6-deoxyerythronolide B (6-dEB), which is then further oxidised by cytochrome P-450s and glycosylated to yield erythromycin A22. The biosynthesis of erythromycins may proceed through a pathway involving compound 423, as it has been demonstrated, contrary to the prior held beliefs, that erythronolide A (5) is glycosylated to erythromycin A (1), and thus erythronolide A (5) might be not present in a free form (fig. 1).
Under EI MS conditions, the erythromycins displayed three characteristic ions at m/z 382 of the α γ unsaturated system of erythronolide A (5)24 (as a result of expulsion of the sugar moieties followed by elimination of 2H2O from C-2~C4), m/z 159 (cladinosyl, B) and finally a base peak at m/z 158 of the desosaminyl moiety (A). The lactone ring displayed also a fragmentation because of elimination of the C12-C15 fragment confirming the nature of the terminal methyl group bonded to C-15. Moreover, the neutral sugar was established based on two characteristic fragmentation peaks at m/z 127 and 11525.
In the 1H NMR spectra, compound 1 exhibited 6 methyl doublets (δ 1.25~1.12 ppm), 3 methyl singlets (δ 1.43~1.11 ppm), one methyl triplet (δ 0.84 ppm), one methoxy singlet (δ 3.26 ppm) and one N-(CH3 )2 singlet (δ 2.38 ppm). Two of the ten oxymethine protons (δ 5.05~2.95 ppm) were anomeric (δ 4.84 & 4.39 ppm), four were in the range of δ 3.05~2.66. Finally, it showed four methylene multiplets (δ 1.88~1.41 ppm).
The 13C NMR and HSQC spectra (Table 4) indicated 36 signals attributed to 37 carbons as demanded by the molecular formula. It depicted two carbonyl carbons, one of an ester (175.7 ppm) and the other one of a ketone system (222.0 ppm). The spectrum contained 13 methyl carbons, among them one methoxy and two equivalent methyls of the N-(CH3)2 moiety, 15 methine carbons, ten of them were oxygenated, and 4 methylene signals. Finally, 3 signals of quaternary sp3 carbons were visible. By careful interpretation of the 1D and 2D NMR data (fig. 3) in combination with the molecular formula and ESI-MS2 and ESI-MS3 fragmentations and comparison with related analogous23,26 (e.g. 6-O-methylerythromycin A (2)27, the structure of erythromycin A (1) was fully deduced, excluding also the initially suggested two macro-lactones with 13- and 12-memberd rings (6,7 fig. 1). This was confirmed by the direct cross-signal from the oxymethine proton at δ 5.05 ppm (H-13) towards the lactone carbonyl (C-1, 175.7 ppm) in the HMBC spectrum establishing the ring closure between C-13 and C-1 via oxygen, excluding structure 6. Moreover, the methine proton at δ 3.79 ppm (H-11) exhibited no correlation to the same lactone carbonyl, negating also structure 7.
TABLE 4.
13C NMR AND 1H NMR DATA OF ERYTHROMYCIN A(1) COMPARED WITH 6-O-METHYLERYTHROMYCIN A (2)
| Position | Erythromycin A (1) | 6-O-Methylerythromycin A (2) | ||
|---|---|---|---|---|
| δC ppm | δH ppm (J in Hz) | δC ppm | δH ppm | |
| 1 | 175.7 | - | 175.9 | - |
| 2 | 44.8 | 2.84 (dq, 10.0, 7.3) | 45.1 | 2.89 (dq) |
| 3 | 80.1 | 3.94 (dd, 10.0, 9.9) | 78.5 | 3.77 (dd) |
| 4 | 39.3 | 1.95 (ddq, 7.5, 7.3) | 39.3 | 1.92 (ddq) |
| 5 | 84.0 | 3.51 (d, 7.2) | 80.8 | 3.67 (d) |
| 6 | 74.96 | - | 78.5 | - |
| 7 | 38.5 | 1.88 (dd, 14.8, 7.8), 1.68 (dd, 14.8, 7.8) | 39.4 | 1.72 (dd), 1.85 (dd) |
| 8 | 45.1 | 2.66 (ddq, 7.7, 6.9) | 45.3 | 2.59 (ddq) |
| 9 | 222.0 | - | 221.1 | - |
| 10 | 37.76 | 3.05 (brq, 6.8) | 37.3 | 3.00 (dq) |
| 11 | 68.85 | 3.59 (brd, 9.8) | 69.1 | 3.76 (d) |
| 12 | 74.6 | - | 74.3 | - |
| 13 | 76.84 | 5.05 (dd, 9.9, 4.2) | 76.7 | 5.05 (dd) |
| 14 | 21.0 | 1.90 (ddq, 14.1, 10.1, 7.3 ), 1.22 (ddq, 14.1, 10.1, 7.3) | 21.1 | 1.48 (ddq), 1.92 (ddq) |
| 15 | 10.6 | 0.84 (t, 7.3) | 10.6 | 0.85 (t) |
| 16 | 16.0 | 1.17 (d, 7.3) | 16.0 | 1.20 (d) |
| 17 | 9.2 | 1.13 (d, 7.0) | 9.1 | 1.10 (d) |
| 18 | 26.9 | 1.43 (s) | 19.8 | 1.41 (s) |
| 19 | 18.3 | 1.16 (d, 6.9) | 18.0 | 1.14 (d) |
| 20 | 12.0 | 1.15 (d, 6.8) | 12.3 | 1.13 (d) |
| 21 | 16.2 | 1.14 (s) | 16.0 | 1.12 (s) |
| 6-OCH3 | - | - | 50.7 | 3.04 (s) |
| 1′ | 103.3 | 4.39 (d, 7.2) | 102.9 | 4.44 (d) |
| 2′ | 70.8 | 3.25 (dd, 10.1, 7.2) | 71.0 | 3.19 (dd) |
| 3′ | 65.2 | 2.66 (ddd, 12.5, 10.1, 3.9) | 65.6 | 2.41 (ddd) |
| 4′ | 29.3 | 1.74 (ddd, 12.5, 12.5, 10.1 ), 1.26 (ddd, 12.5, 12.5, 10.1) | 28.6 | 1.21 (ddd), 1.66 (ddd) |
| 5′ | 68.5 | 3.46 (ddq, 10.1, 7.3 6.0) | 68.8 | 3.48 (ddq) |
| 6′ | 21.3 | 1.22 (d, 6.0) | 21.5 | 1.23 (d) |
| 3′-N(CH3)2 | 39.8 | 2.38 (s) | 40.3 | 2.28 (s) |
| 1″ | 96.4 | 4.84 (dd, 5.0, 1.2) | 96.1 | 4.93 (dd) |
| 2″ | 35.0 | 1.54 (dd, 15.0, 10.1), 2.32 (dd, 15.0, 10.1) | 34.9 | 1.59 (ax, dd), 2.37 (eq, dd) |
| 3″ | 72.6 | - | 72.7 | - |
| 4″ | 78.0 | 3.02 (dd, 9.4, 3.1) | 78.0 | 3.02 (dd) |
| 5″ | 65.46 | 4.01 (dq, 9.4, 6.1) | 65.8 | 4.01 (dq) |
| 6″ | 18.6 | 1.25 (d, 6.1) | 18.7 | 1.30 (d) |
| 7″(3″-CH3) | 21.4 | 1.26 (s) | 21.5 | 1.25 (s) |
| 3″-OCH3 | 49.4 | 3.28 (s) | 49.5 | 3.33 (s) |
Fig. 3.

HMBC (→) and 1H, 1H COSY (↔) derived connectivities of erythromycin A (1)
The aglycone, erythronolide A (5) and more than 40 derivatives are known from nature28. Erythromycin derivatives are well known with potent activity against Gram-positive bacteria, most of them showing additional DNA binding properties29. Recently, erthromycin A (1) was found to be of therapeutic use for treatment of inflammatory immuneoreactions that may be the major cause of morbidity or mortality associated with “Bird Flue” influenza infection30.
Acknowledgments
We thank R. Machinek for the NMR spectra and Dr. H. Frauendorf for the mass spectra, and Prof. H. Laatsch for his kind support.
REFERENCES
- 1.Laatsch H. In: Marine Bacterial metabolites: Frontiers in marine biotechnology. Proksch P, Müller WEG, editors. Norfolk, UK: Horizon Bioscience; 2006. pp. 225–88. [Google Scholar]
- 2.Mellouli L, Ameur-Mehdi RB, Salem M, Bejar S. Isolation, purification and partial characterization of antibacterial activities produced by a newly isolated Streptomyces sp. US24 strain. Res Microbiol. 2003;154:345–52. doi: 10.1016/S0923-2508(03)00077-9. [DOI] [PubMed] [Google Scholar]
- 3.Keay BA, Rodrigo R. A convergent synthesis of (±) daunomycinone. Tetrahedron. 1984;40:4597–607. [Google Scholar]
- 4.Sasaki T, Tsukada Y, Deutsch HF, Hirai H. Daunomycin-arachidonic acid complex as a potential new antitumor agent. Cancer Chemother Pharmacol. 1984;13:75–7. doi: 10.1007/BF00257117. [DOI] [PubMed] [Google Scholar]
- 5.Taatjes DJ, Gaudiano G, Resing K, Koch TH. Alkylation of DNA by the anthracycline, antitumor drugs adriamycin and daunomycin. J Med Chem. 1996;39:4135–8. doi: 10.1021/jm960519z. [DOI] [PubMed] [Google Scholar]
- 6.Smith TH, Fujiwara AN, Lee WW, Wu HY, Henry DW. Synthetic approaches to adriamycin. 2 degradation of daunorubicin to a nonasymmetric tetracyclic ketone and refunctionalization of the A ring to adriamycin. J Org Chem. 1977;42:3653–60. doi: 10.1021/jo00443a004. [DOI] [PubMed] [Google Scholar]
- 7.Chen K, Lin Y, Wu J, Hwang SJ. Enhancement of clavulanic acid production in Streptomyces clavuligerus with ornithine feeding. Enzyme Microbial Technol. 2003;32:152–6. [Google Scholar]
- 8.EL-Bondkly AM, Khattab AA. Clavulanic acid and cephamycin improvement in Streptomyces clavuligerus by inducing combined resistant mutations and protoplast fusion. Egypt J Genet Cytol. 2004;33:217–30. [Google Scholar]
- 9.Lai R, Kanna M, Kaur H, Servostava N, Tripalhi KH, Lai S. Rifamycins: Strain improvement program. Crit Rev Microbiol. 1995;27:19–30. doi: 10.3109/10408419509113532. [DOI] [PubMed] [Google Scholar]
- 10.Paradkar AS, Mosher RH, Anders C, Griffin A, Griffin J, Hughes C, et al. Applications of gene replacement technology to Streptomyces clavuligerus strain development for clavulanic acid production. App Environ Microbiol. 2001;67:2292–7. doi: 10.1128/AEM.67.5.2292-2297.2001. [DOI] [PMC free article] [PubMed] [Google Scholar]
- 11.Wieczorek J, Mordarski M. Antibiotics produced by Streptomyces olivaceus 142, I: Characterization of the FPG-mutant and conditions of production of antibiotic WR 142-FPG. Arch Immunol Ther Exp. 1976;24:811–20. [PubMed] [Google Scholar]
- 12.Lee SH, Rho YT. Improvement of tylosin fermentation by mutation and medium optimization. Lett Appl Microbiol. 1999;28:142–4. doi: 10.1046/j.1365-2672.1999.00478.x. [DOI] [PubMed] [Google Scholar]
- 13.Cheng YR, Huang J, Qiang H, Lin WL, Demain AL. Mutagenesis of the rapamycin producer streptomyces hygroscopicus FC904. J Antibiot. 2001;54:967–72. doi: 10.7164/antibiotics.54.967. [DOI] [PubMed] [Google Scholar]
- 14.Khattab AA, EL-Bondkly AM. Construction of superior Streptomyces noursei fusants for nystatin and antibacterial antibiotics production. Arab J Biotechnol. 2006;9:95–106. [Google Scholar]
- 15.Williams ST, Sharpe ME. Streptomyces and related genera. In: Holt JG, editor. Bergey's manual of systematic bacteriology. Vol. 4. Baltimore, MD: Williams and Wilkins Company; 1989. section 29. [Google Scholar]
- 16.Schiebel M. Dissertation. 2002. Diskriminanzanalyse und HPLC-MS-Techniken im Screening nach neuen Metaboliten aus terrestrischen und marinen Bakterien. (Ger). [Google Scholar]
- 17.Shaaban M. Dissertation. 2004. Bioactive secondary metabolites from marine and terrestrial bacteria: Isoquinolinequinones, bacterial compounds with a novel pharmacophor. [Google Scholar]
- 18.Schröder D. Untersuchungen zum Sekundärmetabolismus arktischer und antarktischer Meereisbakterien. Dissertation. 2002 (Ger). [Google Scholar]
- 19.Department of natural products, institute of Organic and Biomolecular Chemistry. Germany: Göttingen University; The collection of NMR and MS spectra at Laatsch research group. [Google Scholar]
- 20.Martin JR, Perun TJ, Girlami RL. Studies on the biosynthesis of the erythromycins I: Isolation and structure of an intermediate glycoside, 3-α-L-mycarosylerythronolide B. Biochemistry. 1966;5:2852–6. doi: 10.1021/bi00873a011. [DOI] [PubMed] [Google Scholar]
- 21.Spagnoli R, Toscano L. Erythronolide A gylcosidation to erythromycin A by a blocked mutant of Streptomyces erythroeus. J Antibiot. 1983;36:435–7. doi: 10.7164/antibiotics.36.435. [DOI] [PubMed] [Google Scholar]
- 22.Rawlings BJ. Type I polyketide biosynthesis in bacteria (Part A--erythromycin biosynthesis) Nat Prod Rep. 2001;18:190–227. doi: 10.1039/b009329g. [DOI] [PubMed] [Google Scholar]
- 23.Kibwage IO, Janssen G, Busson R, Hoogmartens J, Vanderhaeghe H. Identification of Novel Erythromycin Derivatives in mother liquor concentrates of Streptomyces Erythreaus. J Antibiot. 1987;40:1–6. doi: 10.7164/antibiotics.40.1. [DOI] [PubMed] [Google Scholar]
- 24.Martin JR, Devault RL, Sinclar AC, Stanaszek RS, Jonson P. A new occurring erythromycins: Erythromycin F. J Antibiot. 1982;35:426–30. doi: 10.7164/antibiotics.35.426. [DOI] [PubMed] [Google Scholar]
- 25.Kibwage IO, Janssen G, Hoogmartens EJ, Vanderhaeghe H. Isolation of erythromycins and related substances from fermentation residues of Streptomyces erythreous by high performance liquid liquid chromatography on silica gel. J Chromatogr. 1985;346:309–19. [Google Scholar]
- 26.Neszmelyi A, Hull WE, Lukacs G. Natural abundance carbon-13-carbon-13 coupling constants observed via double quantum coherence: The two-dimensional Inadequate experiment for carbon-13 NMR spectral analysis of erythronolide-B. Tetrahedron Lett. 1982;23:5071–4. [Google Scholar]
- 27.Adachi T, Sasaki J, Omura S. Hydroxylation and N-demethylation of clarithormycin (6-O-methylerythromycin A) by Mucor Circinelloides. J Antibiot. 1989;42:1433–7. doi: 10.7164/antibiotics.42.1433. [DOI] [PubMed] [Google Scholar]
- 28.Laatsch H, AntiBase A Data Base for Rapid Structure Dereplication and Determination of Microbial Natural Products and annual updates, Wiley-VCH, Weinheim, Germany. [cited in 2007]. Available from: http://www.gwdg.de/~ucoc/laatsch/
- 29.Bonay P, Munro S, Fresno M, Alarcon B. Intra-Golgi transport inhibition by megalomicin. J Biol Chem. 1996;271:3719–26. doi: 10.1074/jbc.271.7.3719. [DOI] [PubMed] [Google Scholar]
- 30.Rainsford KD. Influenza (Bird Flu), inflammation and anti-inflammatory/analgesic drugs. Inflammopharmacology. 2006;14:2–9. doi: 10.1007/s10787-006-0002-5. [DOI] [PubMed] [Google Scholar]