Abstract
To assess the feasibility of small soft tissue avascular tumor micro-CT imaging with x-ray phase-contrast in-line holography, we have studied micro-CT imaging with in-line geometry of small spheroidal avascular tumor models with quiescent cell core (< 250 μm) and various distributions of the proliferating cell density (PCD) forming the outer shell. We have simulated imaging with an ultrafast laser-based x-ray source with a Mo target. We observe phase-contrast enhancement of the tumor boundaries in the reconstructed transaxial images, resulting in improved detection of small soft tissue tumors, providing that the PCD density gradient is sufficiently large.
Keywords: micro-CT imaging, x-ray phase-contrast in in-line holography, soft tissue avascular tumor model, tumor detection
1. INTRODUCTION
One of the major drawbacks of CT and micro-CT is their rather poor density resolution (smallest density variation in the object that can be resolved in the image). In-line x-ray phase-contrast imaging is a promising new technology that might afford improved soft tissue resolution [1-11]. This imaging method requires an x-ray source with a sufficiently small effective focal spot size, suitable spectral distribution, and an appropriate imaging geometry. An ultrafast-laser-based x-ray (ULX) source fulfills these requirements [12]. Therefore, we have investigated micro-tomographic imaging of soft-tissue small avascular tumors with ULX under Fresnel conditions, because they are most suitable for laboratory in vivo imaging [1].
2. MATERIALS AND METHODS
Using in-line geometry, we studied x-ray phase-contrast micro-CT imaging of small spheroidal avascular tumor models proposed by Jiang et al. [13] and Stein et al. [14]. We considered an invading tumor in an early stage of development (i.e. not containing a necrotic core) with quiescent cell core radius of 250 μm and diverse distributions of the proliferating cells forming the outer shell. This layer was modeled by various degrees of Gaussian blurring of the density profile across the interface with the surrounding tissue (FWHM in the 8–100 μm range). We used a simplified model of a mouse, namely a cylinder 28 mm in diameter and 300 mm in length. We assumed that the tumor was centrally located, that the tumor core had the same radiological properties as soft tissue, and that it was embedded in adipose tissue. Simulations were performed using an analytical model describing propagation of an x-ray wave through an object assuming that the “projection approximation” was valid, so that the amplitude Eout(x,y) of the wave transmitted through the object was related to the amplitude Ein(x,y) of the wave incident on the object as follows: Eout(x,y) = exp[iφ(x,y) − a(x,y)] Ein(x,y), where φ(x,y) and a(x,y) are the phase and the attenuation induced by the object, respectively. The free-space propagation from the object plane to the detector was modeled using a rigorous wave-optics formalism [15-18]. The following parameters of the imaging system were used in our simulations: σS = σD = 0 (point source and perfect detector), M = 1.1 and M = Mopt = 2 (optimum magnification corresponding to the point source and perfect detector), R = 2 m (total source-to-detector distance), and 20 keV x-ray energy. We created sets of micro-CT projection images and reconstructed them using a modified Feldkamp algorithm (Figs. 1-6). The data for Figs. 1 and 2 were created from 360 projection images, and, for Figs. 3-6, 1,440 projections were used. We also estimated image contrast in projection images for tumor models with diameter in the 0.2–2 mm range (Figs. 7, 8).
Fig. 1.
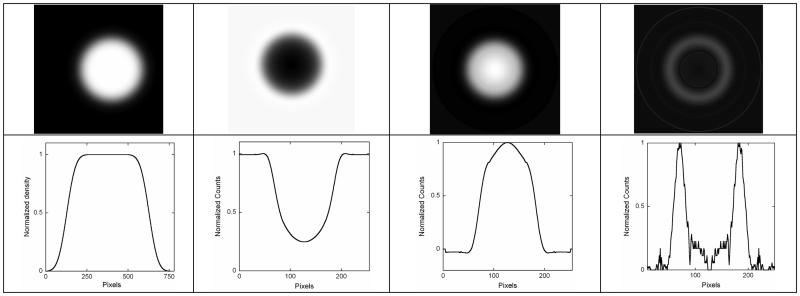
Top row: (left to right) tumor model with Gaussian boundary blurring FWHM = 8 μm, projection image (M=2), transaxial slice through the center obtained using tomographic reconstruction (modified Feldkamp) from 1,440 projections, and edges detected in the reconstructed image. Bottom row: (left to right) horizontal one-channel line profiles through the center of images for the object, projection, reconstruction, and edges. All images are normalized by their maxima.
Fig. 6.
Top row: (left to right) tumor model with Gaussian boundary blurring FWHM = 100 μm, projection image (M = 2), transaxial slice through the center obtained using tomographic reconstruction (modified Feldkamp) from 360 projections, and edges detected in the reconstructed image. Bottom row: (left to right) horizontal one-channel line profiles through the center of images for the object, projection, reconstruction, and edges. All images are normalized to their maxima.
Fig. 2.
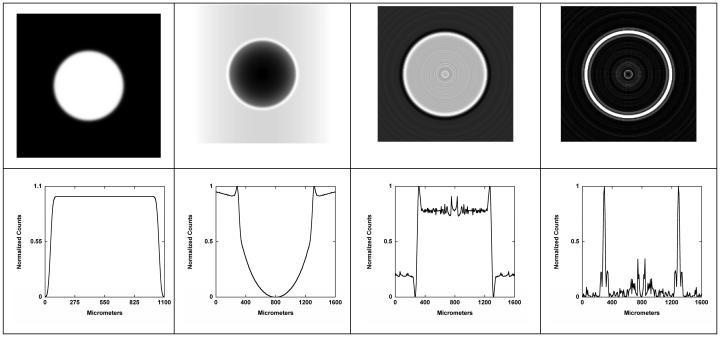
Top row: (left to right) tumor model with Gaussian boundary blurring FWHM = 8 μm, projection image (M = 1.1), transaxial slice through the center obtained using tomographic reconstruction (modified Feldkamp) from 1,440 projections, and edges detected in the reconstructed image. Bottom row: (left to right) horizontal one-channel line profiles through the center of images for the object, projection, reconstruction, and edges. All images are normalized to their maxima.
Fig. 3.
Top row: (left to right) tumor model with Gaussian boundary blurring FWHM = 20 μm, projection image (M = 2), transaxial slice through the center obtained using tomographic reconstruction (modified Feldkamp) from 1440 projections, and edges detected in the reconstructed image. Bottom row: (left to right) horizontal one-channel line profiles through the center of images for the object, projection, reconstruction, and edges. All images are normalized to their maxima.
Fig. 7.
Contrast vs. simulated tumor diameter d for 10, 50, and 100 μm (FWHM) proliferating-cell interface.
Fig. 8.
Contrast vs. gaussian blurring [μm] (FWHM) of proliferating-cell interface, for 1 mm diameter simulated tumor. Contrast is defined as (Max − Min) / (Max + Min)
3. RESULTS AND DISCUSSION
We have observed phase-contrast enhancement of the image contrast at the boundaries of the tumor in the projection images, and even stronger enhancement in the reconstructed transaxial images. The boundary enhancement depends strongly on the electron density gradient in the proliferating cell region. It is very strong for FWHM = 8 μm, moderate at FWHM = 50 μm, and difficult to detect for FWHM = 100 μm. At large values of the tumor radius, absorption contrast dominates (Fig. 7) and contrast is almost independent of the gradient of electron density at the boundary. For small tumors (r <1 mm), phase contrast dominates, but it rapidly decreases with increased blurring of the interface between the tumor and normal tissue.
4. CONCLUSIONS
X-ray phase-contrast micro-CT using in-line holography geometry could offer improved detection of small soft tissue avascular tumors in early stages of invasion, provided that the proliferating cell density gradient is sufficiently large.
Fig. 4.
Top row: (left to right) tumor model with Gaussian boundary blurring FWHM = 20 μm, projection image (M=1.1), transaxial slice through the center obtained using tomographic reconstruction (modified Feldkamp) from 1,440 projections, and edges detected in the reconstructed image. Bottom row: (left to right) horizontal one-channel line profiles through the center of images for the object, projection, reconstruction, and edges. All images are normalized to their maxima.
Fig. 5.
Top row: (left to right) tumor model with Gaussian boundary blurring FWHM = 50 μm, projection image (M=2), transaxial slice through the center obtained using tomographic reconstruction (modified Feldkamp) from 360 projections, and edges detected in the reconstructed image. Bottom row: (left to right) horizontal one-channel line profiles through the center of images for the object, projection, reconstruction, and edges. All images are normalized to their maxima.
5. Acknowledgements
This research has been supported in part by grant R21 EB005055-02 from NBIB/NIH.
We are grateful for cooperation of and encouragement by XRT, Ltd.
REFERENCES
- 1.Wilkins SW, Gureyev TE, Gao D, Pogany A, Stevenson AW. Phase-contrast imaging using polychromatic hard x-rays. Nature. 1996;384:335–338. [Google Scholar]
- 2.Pogany A, Gao D, Wilkins SW. Contrast and resolution in imaging with a microfocus x-ray source. Rev. Sci. Inst. 1997;68:2774–2782. [Google Scholar]
- 3.Gureyev TE, Raven C, Snigirev AA, Snigireva I, Wilkins SW. Hard x-ray quantitative noninterferometric phase-contrast imaging. SPIE Proceedings. 1999;3659:356–364. [Google Scholar]
- 4.Gureyev TE, Stevenson AW, Paganin D, Mayo SC, Pogany A, Gao D, Wilkins SW. Quantitative methods in phase-contrast x-ray imaging. J.Dig.Imag. 2000;13:121–126. doi: 10.1007/BF03167641. [DOI] [PMC free article] [PubMed] [Google Scholar]
- 5.Gureyev TE, Stevenson AW, Paganin DM, Weitkamp T, Snigirev A, Snigireva I, Wilkins SW. Quantitative analysis of two-component samples using in-line hard x-ray images. J. Synch. Rad. 2002;9:148–153. doi: 10.1107/s0909049502004971. [DOI] [PubMed] [Google Scholar]
- 6.Gureyev TE, Wilkins SW. On x-ray phase imaging with a point source. J. Opt. Soc. Am. 1998;A15:579–585. [Google Scholar]
- 7.Gureyev TE, Wilkins SW. On x-ray phase retrieval from polychromatic images. Opt. Comm. 1998;147:229–232. 154, 391. (erratum) [Google Scholar]
- 8.Honda C, Ohara H, Ishisaka A, Shimada F, Endo T. X-ray Phase Imaging Using a X-ray Tube with a Small Focal Spot-Improvement of Image Quality in Mammography. Jpn. J. Med. Phys. 2002;22:21–29. [PubMed] [Google Scholar]
- 9.Donnelly EF, Price RR, Pickens DR. Quantification of the effect of system and object parameters on edge enhancement in phase-contrast radiography. Med. Phys. 2003;30:2888–2896. doi: 10.1118/1.1617430. [DOI] [PubMed] [Google Scholar]
- 10.Wu X, Liu H. An experimental method of determining relative phase-contrast factor for x-ray imaging system. Med. Phys. 2004;31(5):997–1002. doi: 10.1118/1.1688213. [DOI] [PubMed] [Google Scholar]
- 11.Krol A, Kincaid RE, Jr., Servol M, Kieffer J-C, Nesterets Y, Gureyev T, Stevenson A, Wilkins S, Ye H, Lipson E, Toth R, Pogany A, Coman I. Initial experimentation with in-line holography x-ray phase-contrast imaging with an ultrafast laser-based x-ray source. Proceedings of the SPIE. 2007;6510:65100L. [Google Scholar]
- 12.Toth R, Kieffer JC, Fourmaux S, Ozaki T, Kincaid RE, Jr., Krol A. Evaluation of ultrafast laser-based hard x-ray sources for phase-contrast imaging. Physics of Plasmas. 2007;14:053506. [Google Scholar]
- 13.Jiang Yi, Pjesivac-Grbovic Jelena, Cantrell Charles, Freyer James P. A Multiscale Model for Avascular Tumor Growth. Biophysical Journal. 2005 Dec;89:3884–3894. doi: 10.1529/biophysj.105.060640. [DOI] [PMC free article] [PubMed] [Google Scholar]
- 14.Stein Andrew M., Demuth Tim, Mobley David, Berens Michael, Sander Leonard M. A Mathematical Model of Glioblastoma Tumor Spheroid Invasion in a Three-Dimensional In Vitro Experiment. Biophysical Journal. 2007 Jan;92:356–365. doi: 10.1529/biophysj.106.093468. [DOI] [PMC free article] [PubMed] [Google Scholar]
- 15.Nesterets YI, Wilkins SW, Gureyev TE, Pogany A, Stevenson AW. On the optimization of experimental parameters for x-ray in- phase-contrast imaging. Rev. Sci. Instr. 2005;76:093706. [Google Scholar]
- 16.Born M, Wolf E. Principles of Optics. 6th ed. Pergamon, Oxford: 1980. [Google Scholar]
- 17.Cowley JM. Diffraction Physics. 3rd ed. North Holland, Amsterdam: 1995. [Google Scholar]
- 18.Barrett H, Swindell W. Radiological Imaging. Rev. ed. Academic Press; San Diego: 1981. [Google Scholar]


