

Abstract
Solute carriers are eukaryotic membrane proteins that control the uptake and efflux of solutes, including essential cellular compounds, environmental toxins, and therapeutic drugs. Solute carriers can share similar structural features despite weak sequence similarities. Identification of sequence relationships among solute carriers is needed to enhance our ability to model individual carriers and to elucidate the molecular mechanisms of their substrate specificity and transport. Here, we describe a comprehensive comparison of solute carriers. We link the proteins using sensitive profile–profile alignments and two classification approaches, including similarity networks. The clusters are analyzed in view of substrate type, transport mode, organism conservation, and tissue specificity. Solute carrier families with similar substrates generally cluster together, despite exhibiting relatively weak sequence similarities. In contrast, some families cluster together with no apparent reason, revealing unexplored relationships. We demonstrate computationally and experimentally the functional overlap between representative members of these families. Finally, we identify four putative solute carriers in the human genome. The solute carriers include a biomedically important group of membrane proteins that is diverse in sequence and structure. The proposed classification of solute carriers, combined with experiment, reveals new relationships among the individual families and identifies new solute carriers. The classification scheme will inform future attempts directed at modeling the structures of the solute carriers, a prerequisite for describing the substrate specificities of the individual families.
Keywords: solute carrier transporters, pharmacogenetics, profile–profile alignment, sequence analysis, protein function prediction, family classification
Introduction
Solute carriers
Solute carriers are eukaryotic membrane proteins that control the uptake and efflux of various solutes, including amino acids, sugars, and drugs.1,2 Solute carriers and their prokaryotic homologs include facilitative transporters (energy for transport provided by an electrochemical gradient) as well as active transporters, including both cotransporters and exchangers (energy for transport provided by diverse energy coupling mechanisms).1–4
Sequence-based classification of solute carriers
The Gene Nomenclature Committee (HGNC) of the Human Genome Organization (HUGO)2 classifies ∼400 human solute carriers into 47 families.1 According to this classification, members of a family share a similar substrate and at least 20–25% sequence identity to at least one other member of the family.1 At least initially, atomic structures of transporters were apparently not considered in constructing this classification. Several other classifications have also been proposed.3,5 The transporter classification (TC) system aims to automatically classify transporters across all organisms (http://www.tcdb.org/).3 All known transporters, including solute carriers, are divided into a hierarchical system of “classes,” “subclasses,” and “families.” Human solute carriers are represented in several distinct classes of the TC database (TCDB).4 For example, the neurotransmitter family SLC6 is grouped into the various subclasses of 2.A.22.x.x. Another phylogenetic (tree-based) analysis of human solute carriers proposed that they consists of 15 related families that can be organized into four distinct clusters, as well as 32 additional unlinked families.5
Structures of solute carriers and their homologs
Solute carriers are typically composed of one large domain consisting of 10–14 transmembrane α-helices. Currently, the only solute carriers of known structure are the human Rhesus glycoprotein RhCG ammonium transporter (SLC42A3) (Gruswitz et al., submitted for publication), which belongs to the SLC42 family, and the cow mitochondrial ADP/ATP carrier (SLC25A4),6 which belongs to the SLC25 family. In addition, there are a number of structures for prokaryotic homologs of solute carriers.7–21 These structures revealed that some solute carrier families are related to each other, despite weak sequence similarities (even at less than 15% sequence identity). For example, the prokaryotic members of the SLC5 (vSGLT),22 SLC6 (LeuT),23 SLC7 (Arginine/agmatine antiporter (AdiC),11,12 and ApcT transporter13) families as well as the bacterial transporter NCS124 and the Na+/betaine symporter BetP14 are classified into the same structural family in the orientations of proteins in membranes (OPM) database (Fig. 1)25 and share similar transport mechanisms.10,28 In contrast, some solute carrier families have different folds (Fig. 1). For example, the SLC1 member Glp from Pyrococcus horikoshii has the proton glutamate symport fold,15 whereas the SLC6 member LeuT from Aquifex aeolicus vf5 adopts the SNF-like fold.8 Therefore, the use of the term superfamily to refer to all solute carriers is misleading, because it generally implies a common ancestor as well as detectably similar sequences and structures.29
Figure 1.
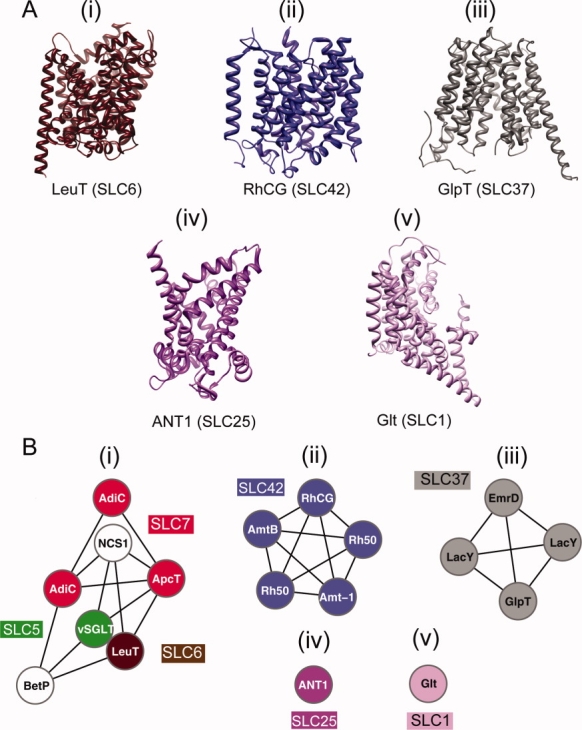
Structure-based classification of solute carriers. A: Structures of solute carriers and their homologs representing the currently known structural classes.25 The folds include (i) the NSF-like fold, (ii) the ammonium transporter fold, (iii) the MFS general substrate transporter fold, (iv) the mitochondrial carrier fold, and (v) the proton glutamate symport protein fold. B: The relationships between the structures are visualized using cytoscape, based on pairwise structural alignment scores computed by SALIGN.26 Each link represents a pairwise structural alignment with an SALIGN score of at least 30. The colored nodes represent proteins that are either a human solute carrier or similar in sequence to at least one human solute carrier. Nodes in white correspond to proteins that are not detectably similar in sequence to human solute carriers (i.e., an overlap of at least 150 residues of the target sequence to a sequence of a known structure at the sequence identity cutoff 20%, according to PSI-BLAST27).
Function and pharmacology of solute carriers
Solute carriers play a role in a variety of cellular functions. For instance, the sodium- and chloride-dependent neurotransmitter transporter family (SLC6) consists of important neurosignaling proteins, such as the dopamine and serotonin transporters.30,31 Many antidepressants selectively inhibit the SLC6A4 (SERT) serotonin transporter, which is responsible for serotonin reuptake from synaptic spaces.32,33 In addition, solute carriers can modulate drug levels within the body by regulating their absorption, distribution, metabolism, and elimination (ADME). For example, the organic ion transporter family (SLC22) mediates the uptake of anticancer and antiviral drugs into the liver and kidney.34,35 Thus, genetic variation in solute carriers may result in differential response to drugs (pharmacogenetics). For instance, the intracellular concentrations of the antidiabetic drug metformin are affected by genetic variations in the organic cation transporter 1 (SLC22A1 or OCT1).36–39 Consequently, solute carriers are principal drug targets of utmost clinical relevance.
Toward a description of specificity determinants in solute carriers
As with most proteins, the function of a solute carrier is determined by its structure and dynamics. For example, the shape and physicochemical properties of the binding site on the transporter (i.e., specificity determinants) determine what molecules do and do not bind to the transporter (i.e., binding specificity), which in turn helps determine what molecules do and do not get transported by the transporter (i.e., substrate specificity). The mechanism of transport, which can be different for different familes,10,20–23,28,40 describes how the specificity determinants of a transporter result in the binding specificity and substrate specificity. Therefore, an important step toward descriptions of their mechanisms of transport includes the characterization of their structures in different conformational states. Biochemical and crystallographic studies10,20–23,28,40 suggest that solute carriers from several structural families transport solutes using the “alternating access” mechanism, in which the transporter alternatively exposes its binding site to either side of the membrane.41
As one recent example, X-ray structures of the bacterial leucine transporter LeuT in complex with various amino acid ligands have provided insights into the substrate specificity of several human solute carrier families, including SLC5, SLC6, and SLC7.42 In particular, it has been suggested that for a substrate to be transported efficiently by LeuT, it needs to bind to the binding site on the transporter surface as well as fit within the binding cavity of the “occluded” transporter state42; occluded states are conformations that solute carriers from various structural families adopt during the transport process.10,21,40,43 Tryptophan is much larger than leucine, but like leucine it binds to the binding site of LeuT. However, it was suggested that tryptophan does not fit into the cavity in the occluded state and consequently traps the LeuT transporter in the “open-to-out” conformation, thereby acting as a competitive inhibitor of Leu transport.42 While this inhibition model was proposed based on a partially occluded state of LeuT, the recent structure of BetP reveals a fully occluded conformation supporting the transport mechanism for the structural family.14 Additionally, crystal structures of LeuT with several antidepressants proposed a noncompetitive inhibition mechanism for transport by LeuT that involves a second inhibitory binding site.44,45 It was suggested that this site binds another substrate molecule,46 allosterically triggering the intracellular release of the first substrate molecule. It was also suggested that the second site was occupied by the detergent used for the crystallization of LeuT,8,47 acting as a noncompetitive inhibitor.47
Here, we describe a comprehensive comparison of solute carriers to inform future attempts directed at modeling the structures of the solute carriers, a prerequisite for describing the substrate specificities of the individual families. Proteins with a common evolutionary origin adopt similar structures and tend to have related molecular functions. When their structures are not known, one way to detect relationships between proteins is through comparison of their sequences.48–51 The resulting sequence-based connections among related proteins can be useful for inferring similarities and differences in structural and functional features (e.g., fold, ligand binding site, and molecular mechanism) of uncharacterized proteins based on their characterized aligned homologs. In this article, similarity networks based on sequence profile alignments are employed to relate all known human solute carrier sequences. We refine the current classification of solute carriers and predict new connections between solute carriers. The connections are interpreted in terms of the structures, substrate type, transport mode, and tissue specificity of the proteins (see Results section). We then discuss our approach, and the utility of our results for improving comparative models of solute carriers and describing substrate specificity within the families (see Discussion section). Finally, we describe our comparison approaches, the databases of sequences and their functional annotations, as well the visualization software used in this study (see Materials and Methods section).
Results
Similarity maps confirm and refine current classification
We illustrate relationships in protein families using sequence similarity networks.52 The nodes in the graphs represent sequences of the known solute carriers, color coded by their family as annotated by Uniprot53 (or Genbank,54 if not in Uniprot); proteins not annotated as solute carriers are not included in this graph. To construct this map, we used a cutoff similar to that used originally by HGNC1,2 to define the solute carrier families [Fig. 2(A)]. The new similarity network is generally, but not always, in agreement with the current HGNC classification. While many families already appear well defined, the current classification needs to be refined. For instance, the nucleoside-sugar transporter family SLC35 is much more divergent in sequence than other families, and may contain subfamilies with more specific functions [Fig. 2(A)]. As another example, two variant forms of SLC22A18 are not connected to the rest of the SLC22 family. In fact, even when we used a looser similarity cutoff [Fig. 2(B)] to connect protein sequences, these two SLC22A18 isoforms are not connected to the rest of the SLC22 family; instead, they are more similar to members of the SLC46 family. The dissimilarity between the SLC22A18 isoforms and the rest of the SLC22 family is also demonstrated by a phylogenetic tree and co-occurrence of specific motifs in the SLC22 family (Fig. 6).
Figure 2.

Classification of solute carriers using similarity maps. The relationships between solute carrier sequences are visualized using the modified edge-weighted spring-embedded layout in cytoscape 2.6.1.55 Briefly, in the spring-embedded algorithm, the connected nodes are being attracted toward each other, while nodes that are unconnected are pushed apart. The nodes are connected by springs with resting lengths proportional to the shortest-path distance between them. The algorithm then iteratively adjusts the positions of each node to minimize the total “energy” of the system. The lengths of the springs are also determined by link weights, which are derived from the alignment scores better than a threshold. A: Each link represents a pairwise alignment with sequence identity of at least 25% and an E-value of less than 1. B: Each link represents a pairwise alignment with sequence identity of at least 10% and an E-value of less than 1.
Figure 6.
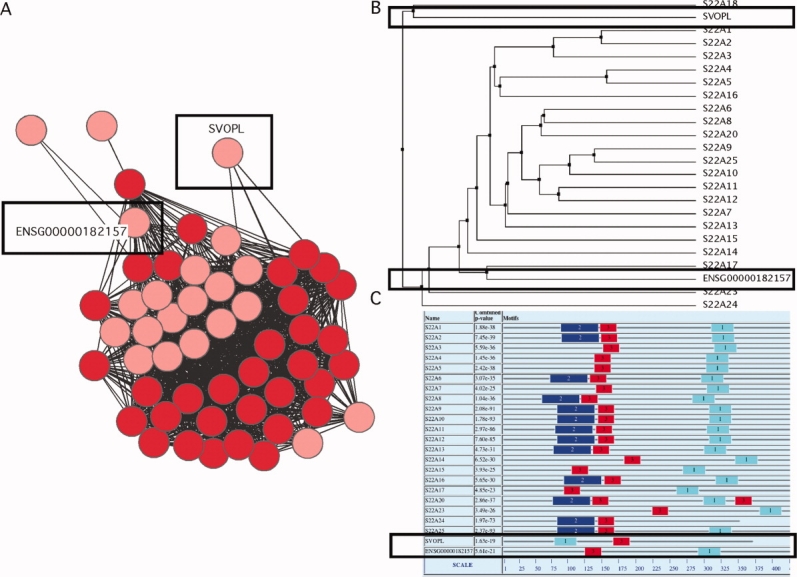
Predicted members of the SLC22 family. (A) Known SLC22 family members are represented by red nodes in the similarity network. An initial set of potential solute carriers is represented by pink nodes. Each link to these unannotated nodes indicates a pairwise alignment with sequence identity of at least 25% and an E-value of less than 1. The putative members of the SLC22 family were further evaluated using sequence analysis tools such as (B) phylogenetic trees and (C) analysis of family specific motifs. The SLC22 family is predicted to have two additional members [S22AX_HUMAN (ENS00000182157) and SVOPL_HUMAN] (black rectangles). A previous analysis of the SLC22 family also suggested that SVOPL might be an uncharacterized member.69
Sequence-based relationships are consistent with structural data
One potential advantage of a similarity network over a phylogenetic tree analysis is its ability to conveniently represent multiple links between proteins as a function of a similarity cutoff.52 Thus, to study relationships between solute carriers, we used a variety of cutoffs to connect the nodes (Fig. 2; Supporting Information Figures S1–S2). One of our goals was to use a cutoff that is so permissive to capture most distant relationships, albeit at a cost of requiring subsequent careful inspection to eliminate likely false positives. Therefore, we simultaneously used a sequence identity cutoff of 10% and an E-value cutoff of 1 [Fig. 2(B)] as the threshold to connect the nodes. Although this criterion may not always result in an accurate detection of a conserved structure-function relationship, a similar cutoff was previously shown to work well for the bacterial homologs of the SLC5 and SLC6 families.7
The observed structural similarity of SLC5 and SLC6 families was reflected in the close proximity of these two families in the similarity map [Fig. 2(B); brown and green circles]. Furthermore, three additional features of the similarity network at the “permissive” sequence identity cutoff of 10% and E-value cutoff of 1 were consistent with data not used to construct it: (i) the links between SLC6 and SLC7 family members are in agreement with the structural similarities among the prokaryotic members of the SLC711–13 and SLC68 families (Fig. 1); (ii) the separation between the SLC25, SLC37, SLC42, and SLC1 families is consistent with the structural dissimilarity among the cow SLC25A46 mitochondrial ADP/ATP carrier, the bacterial SLC37 homologs,16–19 the human SLC42A36 RhCG ammonium transporter, and the archaean SLC1 homolog15 (Figs. 1 and 2); and (iii) the separation of the SLC3 family from the rest of the solute carriers is in agreement with its unique fold containing only one predicted transmembrane helix (they are not transporters on their own and only become a part of a transporting complex when bound to SLC7 family members56) [Fig. 2(B)].
Unknown relationships between families are proposed
Generally, families that cluster together based on their sequences also have similar substrates [Fig. 3(A)]. For example, the organic anion transporter cluster (red) includes SLC16 (monocarboxylate transporters), SLC21/SLCO (organic anion transporters), SLC37 (sugar-phosphate transporters), and SLC17 (vesicular glutamate transporters). Another example is the amino acid transporter cluster (green), which includes the SLC36 (the proton-coupled amino acid transporters), SLC32 (the vesicular inhibitory amino acid transporters), SLC6 (the sodium- and chloride-dependent neurotransmitter transporters), and SLC7 families (the cationic amino acid transporter/glycoprotein-associated transporters). In contrast, some families with similar functions are not linked in the network, indicating that different folds have evolved to perform similar functions. For example, neurotransmitter transporters are found in three distinct clusters: (i) The SLC1 family (pink; the proton glutamate symport protein fold), (ii) the SLC6 and SLC32 families (brown and dark green, respectively; the NSF-like fold), and (iii) the SLC17 and SLC18 families (teal and light gray, respectively; the MFS general substrate transporter fold).
Figure 3.

Substrate type and transport mode mapped onto the solute carrier sequences. A: The colors represent the prototypical substrates of the transporters (see Materials and Methods section). In most cases, the sequence-based clustering also correlates with substrate type. For example, amino acid transporters, such as SLC6, SLC36, and SLC38, are clustered together (green). B: The colors represent the transport mode. The three major groups include cotransporters (yellow), exchangers (blue), and facilitators (red). “Orphan” nodes (cyan) represent transporters whose substrates are unknown, and “unknown” nodes (grey) represent transporters without a known transport mode. For some transporters, different modes of transport have been reported. For example, orange nodes mark transporters that are reported to be facilitators or cotransporters.
Interestingly, the organic ion transporter family (SLC22) is highly connected to the facilitative glucose transporter family (SLC2), indicating a possible evolutionary link between the families that has not been previously appreciated and is not obvious from their prototypical substrates.1 This relationship is also manifested in a high conservation of the type and spatial position of the functionally important residues (Supporting Information Figure S3). Further validation of this relationship is provided by the recent identification of the fructose transporter, GLUT9 (SLC2A9),57 as a transporter of urate.58,59 Urate, a prototypical endogenous substrate of SLC22A12 (URAT1),60 was also identified as a SLC2A9 substrate in our own uptake experiments (Supporting Information Figure S4). The interconnectivity of the SLC2 family with the SLC16, SLC17, SLC18, SLC21, SLC22, SLC37, SLC43, and SLC46 families [Fig. 2(B); bottom right] indicates that all these families share similar functions and the MFS fold.
When the similarity network is constructed based on the E-value cutoff alone (Supporting Information Figures S1–S2), many families are well-linked even for stringent cutoff values (E-value ≤ 0.001; Supporting Information Figure S2); again, the linked families are generally functionally related (e.g., SLC8 and SLC24). These links are missed with the sequence identity cutoff of 25% [Fig. 2(A)], which is frequently used to infer a sequence-structure relationship. Taken together, these data show that sequence identities alone may not always capture functional and structural similarities in solute carriers. Instead, it is beneficial to construct similarity networks with a variety of cutoff values on both the E-value and sequence identity.
Transport mode is conserved within clusters
We now examine the conservation of the transport mode within and across the HGNC families; the type of transport mode is indicated by color on the solute carrier similarity network [Fig. 3(B)]. Conservation of the transport mode within and across families can assist structural studies (e.g., cocrystallizing the target protein with a ligand to increase the odds of crystallization) as well as shed light onto the evolution of solute carriers (see Discussion section). Unsurprisingly, the mode of transport is conserved within most families; most families consist entirely of facilitative transporters [Fig. 3(B); red, e.g., SLC2], cotransporters (yellow; e.g., SLC6), or exchangers (blue; e.g., SLC8). Furthermore, clusters of sequence-related families also share the mechanism of transport. Most proteins from the cluster containing the SLC5, SLC6, SLC7, SLC11, SLC12, SLC32, SLC36, and SLC38 families are cotransporters. The majority of the proteins from the cluster containing the SLC2 and SLC22 families are facilitative transporters, and the majority of the proteins from the cluster containing the SLC8 and SLC24 families are exchangers. The conservation of functional traits such as substrate type and transport mode provide some validation for using the permissive cutoff (10% sequence identity and E-value of 1) for constructing the network.
Family function is weakly linked to organism complexity
Next, we looked at conservation of solute carriers across eukaryotes of varying “complexity” level [Fig. 4(A)]. The assignment of the most similar pairs of transporter sequences between any two organisms was obtained from the NCBI HomoloGene database (see Materials and Methods section). For instance, SLC25 proteins are found in all eukaryotes, including unicellular organisms [blue; Fig. 4(A)]. Members of the neurotransmitter transporter family SLC6 are only found in vertebrates and higher organisms [yellow; Fig. 4(A)].
Figure 4.

Conservation of solute carriers across eukaryotic organisms and tissues. A: The colors of the nodes indicate the oldest species in which the corresponding transporter is found, ranging from old (blue) to new (red). For instance, most members of the sugar transporter family SLC5 appeared for the first time in symmetrical organisms, whereas most SLC22 members appear only in higher mammals. B: The colors of the nodes indicate tissue specificity of the corresponding transporters, ranging from highly tissue-specific (red) to ubiquitous (blue). For example, SLC32 transporters, which are key proteins for synaptic release of inhibitory amino acids, are highly specific to the nervous system, whereas most members of the mitochondrial transporter family SLC25 are ubiquitously expressed.
We hypothesized that the solute carriers unique to higher eukaryotes may have evolved to perform specific functions, and will therefore also be tissue specific (e.g., expressed in the brain only). On the basis of mRNA expression levels in different tissues,38 we calculated a measure of tissue specificity ranging from 0 to 1 [see Materials and Methods section; Eq. (1)].61 The value of 0 [blue; Fig. 4(B)] indicates that the transporter is expressed at similar levels in all tissues and 1 [red; Fig. 4(B)] means that the protein is expressed in a single tissue. Some families confirm our hypothesis. For example, most SLC22 transporters are expressed in the liver, kidney, intestines, and brain—organs with specialized functions that do not exist in lower eukaryotes. Additional examples include the SLC6, SLC17, SLC18, and SLC32 families that are mostly expressed in specific tissues of the nervous system and also appeared late in evolution. In contrast, SLC25 (mitochondria transporters) and SLC35 (Golgi transporters) are found in all eukaryotes and are expressed ubiquitously. However, on average, there was no correlation between tissue specificity and organism complexity in eukaryotes (the correlation coefficient between tissue specificity and organism complexity rank derived from HomoloGene annotation was −0.03). Most of the families consist of a mix of tissue specific and ubiquitous members.
Unknown solute carriers are predicted using a sequence-based approach
We used a multistep approach to predict unknown solute carriers in humans (see Materials and Methods section; Fig. 5). To obtain a preliminary list of all human solute carriers, we expanded all currently annotated solute carrier sequences by their matches against all human proteins with at least six predicted transmembrane helices. This preliminary list contained 199 solute carriers representing 34 families. Because of the limitations of sequence-based function annotation,62–66 further computational analysis was performed. For example, of the 199 putative solute carriers, 21 were potential new members of the SLC22 family. We subsequently excluded entries that had been removed from the updated ENSEMBL67 database during the preparation of this manuscript, splice variants of known SLC22 transporters, and proteins that were recently annotated manually as SLC22 transporters54,68 [Fig. 6(A)]. After these sequences were removed, two potential new SLC22 members remained. We evaluated these putative SLC22 members using common sequence analysis approaches, such as multiple sequence alignment, phylogenetic tree construction, and motif detection (Figs. 5 and 6). Interestingly, ENS00000182157 is more similar to SLC22A17 than to any other member of the SLC22 family based on a phylogenetic tree [Fig. 6(B)]. Additionally, this protein contains the majority of the sequence motifs found in known SLC22 transporters by MEME70 [Fig. 6(C)]. We highlight four high-confidence predictions (Table I).
Figure 5.
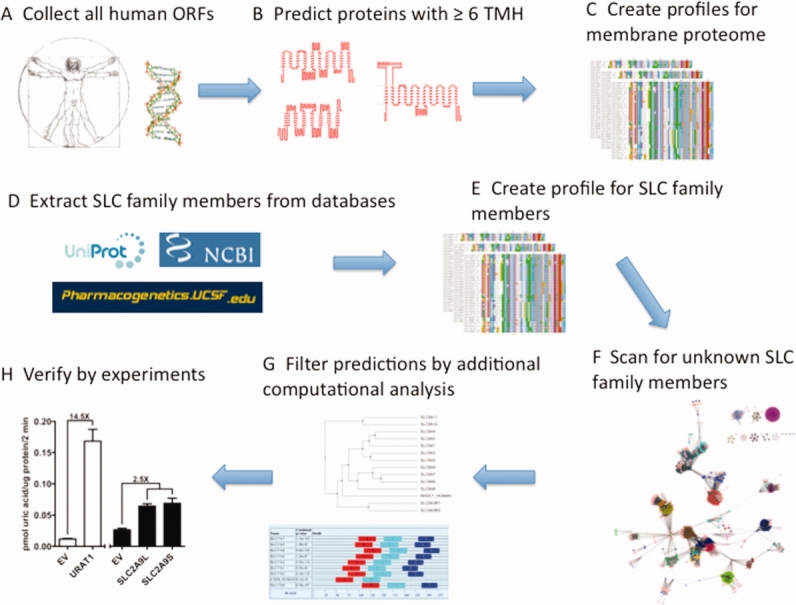
Steps in identifying and classifying unknown solute carriers. (A) We extracted all human ORFs from Ensembl, (B) filtered out proteins with less than six predicted membrane α-helices, and (C) constructed multiple sequence profiles for the remaining sequences. (D) Simultaneously, a list of known solute carriers was extracted from public databases, and (E) again, for each protein sequence we created a multiple sequence profile. (F) We aligned a profile of each known solute carrier sequence with each of the human membrane protein profiles, resulting in a list of human membrane proteins that are similar to at least one known solute carrier. (G) Additional bioinformatics analysis, including construction of phylogenetic trees and detection of family-specific sequence motifs, allows us to identify high confidence predictions. (H) Finally, we verify our computational predictions experimentally by measuring the rate of substrate uptake into cells expressing tested transporters.
Table I.
Putative Solute Carriers in the Human Proteome
| Familya | SwissProt/ UniProtb | Gene namec | Protein named | Family functione |
|---|---|---|---|---|
| SLC6 | A6NF70_HUMAN | — | Transporter | The sodium- and chloride-dependent neurotransmitter transporter family |
| SLC9 | NHDC1_HUMAN | NHEDC1 | Sodium/hydrogen exchanger-like domain-containing protein 1 | The Na+/H+ exchanger family |
| SLC22 | S22AX_HUMAN | — | Putative solute carrier family 22 member ENSG00000182157 | The organic cation/anion/ zwitterion transporter family |
| SVOPL_HUMAN | SVOPL | Putative transporter SVOPL |
Family marks the family of the closest known solute carrier homolog based on sequence identity, derived from profile–profile alignment.
SwissProt/UniProt marks the Swissprot/Uniprot52 identifier that was linked from the ENSEMBL gene found in the profile–profile scan against the human membrane proteome.
Gene name marks the name of the gene according to the “gene names” field in the corresponding SwissProt/UniProt entry.
Protein name marks the name of the protein according to the “protein names” field in the corresponding SwissProt/UniProt entry.
Family function marks the function of the predicted solute carrier family based on the HGNC classification described in Ref.1.
Discussion
Using profile–profile alignments and sequence-based clustering, we updated and extended the map of the solute carrier relationships. We then annotated different functional characteristics of the transporters onto the sequence-based network and found previously unknown sequence-function relationships within this diverse and important membrane transporters. Finally, we predicted unknown solute carriers. Our analysis can assist in improving models of solute carriers and highlighting functionally important residues.
Correlating functional attributes with solute carrier similarity networks is informative
Construction and visualization of similarity networks as well as the display of information on these networks were previously applied to study GPCRs, kinases, and crotonase enzymes.52 Similarity network topology of multidomain proteins, which are highly abundant in the human proteome, can be influenced by variations of domain organization across different families.52,71 Solute carriers usually consist of only one domain and similar membrane topology; therefore, using similarity networks is especially informative in studying these proteins. One advantage of similarity networks compared with phylogenetic trees is that they preserve all observed connections among proteins.52 This feature is particularly relevant for analyzing solute carriers because only a subset of distant pairwise relationships may be detectable by sequence comparison. Although some links between the nodes in the different similarity networks do not represent alignment scores traditionally considered for reliably transferring structure and function [Fig. 2(B)], the multiple connections in our network do capture known structural and functional similarities across families; families known to have similar structures, substrate types, and transport modes tend to be clustered together (Fig. 3).
For example, the SLC22 and SLC2 families are highly interconnected [Fig. 2(B)]. Although the links between these families represent weak similarities between their members (typically 8–15% sequence identity), they collectively result into a distinct cluster when visualized via the network (Fig. 2; Supporting Information Figures S1–S2). This clustering is coupled with the localization of functional residues (Supporting Information Figure S3), as well as the overlap in substrate type between particular members of each family (Fig. 3; Supporting Information Figure S4). Interestingly, transport mode differences indicate considerable divergence between the SLC2 and SLC22 families: SLC2 transporters are almost all facilitative transporters, whereas SLC22 transporters may be facilitative transporters, exchangers, or in some cases, cotransporters (e.g., SLC22A5).
The sequence-based link between the SLC2 and SLC22 families is supported by the common substrates among some of their members (Supporting Information Figure S4),58,59 and suggests that their structures may be similar. However, in the absence of experimentally determined structures from both families, a more definitive confirmation of the structural similarity requires additional experiments, such as site-directed mutagenesis assays, crosslinking experiments, and assessment of residue accessibility to membrane-impermeant reagents.72–74
Different information is provided by different classification schemes
One limitation of similarity networks is the absence of an underlying model of sequence duplication, divergence, and selection.52,75 Therefore, it was suggested that they are not as accurate as phylogenetic (tree-based) approaches when there is substantial variation in the rates of evolution between different solute carriers.75 To overcome this issue, we (i) constructed maps using a variety of similarity cutoffs (Fig. 2, Supporting Information Figures S1–S2), (ii) used profile–profile alignments that are more sensitive in detecting structural relationships in membrane proteins than other alignment approaches,76 (iii) verified the maps by known solute carrier structures (Fig. 1), and (iv) clustered the sequences using a complementary method—the Network Filtration Protocol (NFP) that filters dense similarity networks to estimate boundaries between families (see Materials and Methods section) (Supporting Information Figure S5) (Apeltsin et al., submitted for publication). NFP-based clustering indicates that SLC6, SLC16, and SLC22 are “hubs” in sequence space (i.e., they have a relatively large number of neighboring families). Hubs are particularly relevant targets for structural and functional characterization by the structural genomics consortia, which aim for complete coverage of integral membrane proteome,77 because hub structures can serve as templates for computational modeling of many other proteins with similar sequences (Kelly et al., submitted for publication).78,79 In addition, similarity to many other families may indicate a broad functional specificity of a family. For example, within the SLC22 family, there are transporters for organic cations [e.g., SLC22A1 (OCT1)] and organic anions [e.g., SLC22A6 (OAT1) and SLC22A12 (URAT1)]. This broad specificity of the SLC22 family is reflected in its similarity to both the SLC16 family, which transports an array of organic anions,80–82 and the SLC18 family, which transports organic cations (primarily monoamines). Further, as noted previously, URAT1 (SLC22A12) and GLUT9 (SLC2A9) both transport uric acid (Supporting Information Figure S4).
Implication for drug design: improving accuracy of comparative modeling and virtual screening
Computational methodologies can play a key role in several steps of the drug discovery process, significantly reducing its costs.83 For instance, virtual screening techniques can considerably decrease the time and cost of searching the chemical space for compounds that bind to a protein of known structure.84,85 When experimentally determined atomic structures are not available, comparative modeling may be used to predict target structures when homologous template structures are known. However, the accuracy of comparative models is correlated with the template-target percentage sequence identity. High-accuracy models are typically based on more than 40% sequence identity to their templates, whereas alignments of 30% sequence identity or less86–88 usually result in inaccurate models.
Because of the small number of experimentally determined structures of solute carriers and their homologs, they have been previously modeled based on alignments with low-sequence similarity to the templates, sometimes resulting in unreliable models. However, some models of solute carriers that were based on relatively low-sequence identity (as low as 10–15%) accurately captured mechanistic details that are critical for their functions.7,10,23,89–93 For instance, the outward-facing conformation of vSGLT (bacterial homolog of SLC5) was modeled based on the LeuT structure (a bacterial homolog of SLC6) using an alignment at 11% sequence identity.7 The model helped identify inverted structural repeats that are important for transport in both proteins23 and revealed a possible Na+ binding site in vSGLT based on the corresponding binding site in LeuT. Automatically derived models for all modelable solute carriers are shown in Supporting Information Figure S6 (http://modbase.compbio.ucsf.edu/projects/SLC/).
Identification of sequence conservation patterns across families and within them can potentially result in more accurate structural models of transporter/ligand complexes. First, detection and alignment of family-specific or cluster-specific motifs can improve template-target alignments, a crucial step in comparative modeling. Second, conservation of the transport mode and substrate type across proteins within clusters can help inform when it is appropriate to transfer function of specific residues from functionally characterized to uncharacterized solute carriers (Fig. 3). Third, the selection of ligand libraries for both high-throughput94 and virtual screening84 can be facilitated by considering known substrates of similarity network neighbors of the target solute carrier or family.
A glimpse into the evolution of solute carriers in eukaryotes: case study of the SLC25 family
Two proteins may exhibit similar structural and functional features without having similar sequences.48–51 Such cases may arise because the proteins diverged from a common precursor a long time ago (divergent evolution) or because they evolved independently to have similar structures and functions without sharing a common precursor (convergent evolution).
The mitochondrial transporter family SLC25 is the most functionally diverse solute carrier family as its different members have a wide range of substrates, such as amino acids, nucleotides, coenzyme A, organic ions, and inorganic ions. The majority of the SLC25 family members are found in organisms spanning the whole eukaryotic kingdom [Fig. 4(A)], and they are not typically tissue-specific [Fig. 4(B)], which is in line with the universal need for mitochondrial energy processes. Furthermore, none of the SLC25 members were detectably related in sequence to other solute carriers, despite the use of a sensitive profile–profile alignment method and a variety of similarity cutoffs (Fig. 2; Supporting Information Figures S1–S2).
SLC25 is an ancient family that is found in both prokaryotes and unicellular eukaryotes, so it is not surprising that the SLC25 family has diverged from other solute carrier families sufficiently to prevent us from detecting sequence similarity between them. These changes likely include acquiring short motifs responsible for the various functions of the different family members, rationalizing the wide range of substrate specificity of this family. Interestingly, the SLC25 sequences are relatively highly conserved within the family (Fig. 2; Supporting Information Figures S1–S2; purple circles), suggesting that there are some restraints on their evolution despite their varied substrate specificities.
Some of the SLC25 members share functions with members from other solute carrier families, even though they are not detectably related in sequence. For example, the mitochondrial glutamate carrier 1 (SLC25A22) and the excitatory amino acid transporter 3 (SLC1A1) are glutamate transporters that do not share statistically significant sequence similarity (Fig. 2). Previous studies have shown that it is possible to change a transporter's charge specificity by mutating only two amino acid residues.78 Therefore, it is plausible that SLC1A1 and SLC25A22 independently gained motifs responsible for their similar substrate specificity through convergent evolution.
Our comparison captures distant relationships between solute carriers
There are three methodological advantages of our approach over previous analyses. First, the profile–profile alignments used here are more sensitive for detecting similarities between proteins than the sequence–sequence alignments used in previous studies.2,5 Second, evolutionary relationships were previously established relying only on phylogenetic trees.5 Although phylogenetic tree construction is an extremely powerful tool for inferring evolutionary relationships between proteins, the trees do not show multiple links for a given node.52 Therefore, distant relationships between proteins, often representing nontrivial functional links between families, may not have been revealed in previous analyses. Third, it tends to be easier to observe trends in functional attributes of a large set of proteins when they are displayed on similarity maps rather than phylogenetic trees.
Previously, four distinct clusters consisting of only 15 solute carrier families have been identified, whereas the remaining 32 solute carrier families were not connected to any of these four clusters.5 Similarly, our map also links most of the 15 previously clustered families to each other. For example, the SLC2, SLC22, SLC16, SLC17, SLC18, and SLC37 families, which formed one cluster,5 are also highly connected to each other in the similarity map [Fig. 2(B)]. However, in contrast to the previous finding that the cluster containing SLC7 and SLC12 and the cluster containing SLC32, SLC36, and SLC38 were distinct,5 we found that both of these clusters are highly linked and also connected to the SLC5, SLC6, and SLC11 families. The links we identified are likely to be biologically meaningful as almost all transporters in this cluster are cotransporters that tend to transport chemically similar substrates (Fig. 3).
In summary, our comparison of the human solute carriers reveals new relationships between the individual families and identifies potential new members of this set. The classification scheme is likely to inform future modeling of the solute carrier structures, a prerequisite for describing their substrate specificities. Analysis of functional trends across the solute carrier similarity network provides guidance about which properties can be transferred across the solute carrier space through sequence similarity.
Materials and Methods
Solute carriers
We extracted sequences of solute carriers from UniProt,53 NCBI,54 and from the literature using keyword search. Our final set included 491 unique sequences. Because of different annotation procedures in the different databases, genes with the same name occasionally had slightly different sequences, often representing different isoforms. Sequences differing only in a single amino acid position were manually removed. The clustering results were not expected to depend on whether or not highly similar sequences are included; thus, we used all closely related sequences because only some of them may contain short functional motifs that may be useful in linking more divergent transporters (e.g., sugar binding motifs).
Constructing and visualizing sequence-based similarity maps
A sequence similarity network is made up of links corresponding to pairwise relationships that score better than a defined cutoff.52 The graphs representing the similarity networks were visualized using Cytoscape 2.6.1.55 We relied on the yFiles organic layout algorithm, which is partially based on the spring-embedded algorithm (http://www.cytoscape. org/manual/Cytoscape2_6Manual.html), and shows only node connectivity to illustrate relationships. Because of the correlation between sequence similarity within a family and the number of similarity relationships better than a cutoff, the algorithm partly captures relative distances between two nodes in two dimensions, even without including link weights52; sets of nodes that are highly interconnected tend to cluster closely in space. Similarity maps were constructed using significant hits corresponding to a variety of cutoffs (Fig. 2, Supporting Information Figures S1–S2).
Determining uric acid uptake in SLC22A12 (URAT1) and SLC2A9 (GLUT9) expressing cells
All cells were grown in a humidified incubator set at 37°C and 5% CO2. Uptake of uric acid was determined using transiently transfected HEK-293T cells cultured in 24 well poly-d-lysine coated plates. Cells were transfected with pcDNA5 (Invitrogen, Carlsbad, CA) containing either the full-length reference cDNA for human URAT1 or SLC2A9 (either the long or short isoform) or lacking any additional cDNA (EV) using Lipofectamine 2000 (Invitrogen), following the manufacturer's standard protocol. Uptake experiments in URAT1 expressing cells lasted for 2 min with a 3H-uric acid (Moravek Chemicals, Brea, CA) concentration of 25 μM in chloride free uptake buffer (125 mM sodium gluconate, 4.8 mM potassium gluconate, 1.2 mM K2PO4, 1.3 mM calcium gluconate, 1.2 mM MgSO4, and 25 mM HEPES, pH 7.0), whereas experiments in GLUT9 expressing cells lasted for 3 min with a radiolabeled uric acid concentration of 50 μM in chloride free uptake buffer. All experiments were performed at 37°C, terminated using ice-cold buffer, and uptake levels were quantified using liquid scintillation counting. All uptake results were normalized to total protein in each well.
Clustering using the NFP
The NFP provides a complementary way to elucidate complex relationships within large superfamilies from sequence data (Apeltsin et al., submitted for publication). The NFP takes as input an all-by-all sequence similarity network based on a BLAST alignment.27 It then groups the sequences into clusters using TribeMCL.95 Subsequently, the individual clusters are connected by placing the best-fitting links between the most similar clusters. The final result is a protein cluster topology, which subdivides the plausible clusters into neighbors and non-neighbors. Neighboring clusters are more likely to share greater structural and functional similarities than non-neighbors. This clustering allows us to estimate the structural and functional properties of uncharacterized families from their better-characterized neighbors.
Annotating substrate type
An initial annotation of the substrate type for each solute carrier was made based on data in the Bioparadigms database,1 followed by a PubMed literature search for individual transporters and transporter families. To enable visualization of functional similarities across different solute carrier families, relatively broad substrate type classes were used. For instance, bicarbonate transporters from the SLC4 family were grouped together with phosphate transporters from the SLC34 family under the common “small anion” label.
Annotating species conservation
Species orthologs of human solute carriers were extracted from the NCBI HomoloGene96 database, Release 63. The database contains proteins from 20 completely sequenced eukaryotic genomes, clustered to reveal species orthologs, as well as within-species paralogs. Each solute carrier was ranked by the age of the oldest species in which an orthologous protein was found. For example, rank 1 corresponds to transporters found only in humans [red, Fig. 4(A)], and 28 corresponds to transporters already found in the earliest single-cell eukaryotes [blue, Fig. 4(A)].
Calculating tissue specificity
Expression levels for 275 of the solute carriers in 75 different tissues were obtained from GEO dataset GDS596.97 The tissue specificity of each transporter's expression was determined using the Γ measure61:
| (1) |
where N is the number of examined tissues and xi is the expression level of gene i in a certain tissue, normalized to the maximum expression across all tissues. When Γ equals 1 [blue; Fig. 4(B)], the protein is expressed at similar levels in all human tissues; and when it equals 0, it is expressed in only one tissue [red; Fig. 4(B)].
Finding unknown solute carriers
To identify new solute carriers, we extracted sequences of all human open reading frames (ORF) derived from the ENSEMBL67 database. We then predicted integral membrane proteins containing six or more transmembrane α-helices using TMHMM2,98 as described previously.99 For each such sequence, we built a multiple sequence profile by scanning against UniProt,53 using MODELLER.100 Specifically, the profile.build command implements the Smith-Waterman local alignment method for scanning a single query sequence against a database of sequences. Scores and significance values were calculated similarly to the procedure described by Pearson101 and as already applied to membrane proteins (Kelly et al., submitted for publication). We scanned these profiles against profiles of known solute carrier sequences (including different isoforms), which were extracted from NCBI54 and UniProt.53 The initial list of predicted solute carriers corresponded to human proteins with at least six transmembrane helices whose profile–profile alignment with at least one known solute carrier has at least 25% sequence identity or an E-value lower than 1.
Overcoming limitations in homology-based annotation
While transferring function based on sequence similarity alone has proven to be beneficial, it is not always accurate, due to several reasons: (1) similar genes within the same organism (paralogs), which have resulted from gene duplication events, are frequently functionally divergent, on average much more so than the most similar homologous genes across multiple organisms (orthologs)62; (2) the hit or query may perform multiple functions (moonlighting proteins63); and (3) the hit may be a multidomain protein whose functional domain is not aligned to the query.64 Therefore, to refine our search for homologs, we also evaluated (i) whether or not the candidate homologs contain family signatures such as conserved motifs predicted by MEME70 and (ii) whether or not the candidate homologs cluster with other family members, based on multiple sequence alignment by MUSCLE102 and phylogenetic trees by JalView [Fig. 5(G)].103 Finally, we verified experimentally a high-confidence prediction; we tested the functional overlap between SLC2 and SLC22 families by measuring the rate of uric acid uptake in HEK cells expressing human URAT1 (SLC22A12) or GLUT9 (SLC2A9) [Fig. 5(H); Supporting Information Figure S4].
Visualizing similarity between SLC2 and SLC22 families
To locate the conservation patterns across the members of the SLC2 and SLC22 families, multiple sequence alignments were calculated using the MUSCLE web server.102 Alignment scores were calculated using JalView 2.4.104 The membrane topologies of selected members from each family were predicted using a majority vote consensus approach, based on individual predictions of membrane spanning domains by the TMHMM298 and TOPCONS (http://topcons.cbr.su.se/) web servers. The topology images were color-coded according to alignment scores, either from multiple alignments including all SLC2 and SLC22 family members, or from separate alignments for each family.
Acknowledgments
The authors thank Ron Kaback, Patricia Babbitt, Amber Dahlin, Holly Atkinson, Jeremy Phillips, and Keren Lasker for helpful suggestions, as well as Ben Webb, Elina Tjioe, and Narayanan Eswar for technical assistance and maintenance of the computational resources required for this study.
References
- 1.Hediger MA, Romero MF, Peng JB, Rolfs A, Takanaga H, Bruford EA. The ABCs of solute carriers: physiological, pathological and therapeutic implications of human membrane transport proteins—Introduction. Pflugers Arch. 2004;447:465–468. doi: 10.1007/s00424-003-1192-y. [DOI] [PubMed] [Google Scholar]
- 2.Povey S, Lovering R, Bruford E, Wright M, Lush M, Wain H. The HUGO Gene Nomenclature Committee (HGNC) Hum Genet. 2001;109:678–680. doi: 10.1007/s00439-001-0615-0. [DOI] [PubMed] [Google Scholar]
- 3.Saier MH., Jr A functional-phylogenetic classification system for transmembrane solute transporters. Microbiol Mol Biol Rev. 2000;64:354–411. doi: 10.1128/mmbr.64.2.354-411.2000. [DOI] [PMC free article] [PubMed] [Google Scholar]
- 4.Saier MH, Jr, Yen MR, Noto K, Tamang DG, Elkan C. The Transporter Classification Database: recent advances. Nucl Acids Res. 2009;37:D274–D278. doi: 10.1093/nar/gkn862. [DOI] [PMC free article] [PubMed] [Google Scholar]
- 5.Fredriksson R, Nordstrom KJ, Stephansson O, Hagglund MG, Schioth HB. The solute carrier (SLC) complement of the human genome: phylogenetic classification reveals four major families. FEBS Lett. 2008;582:3811–3816. doi: 10.1016/j.febslet.2008.10.016. [DOI] [PubMed] [Google Scholar]
- 6.Pebay-Peyroula E, Dahout-Gonzalez C, Kahn R, Trezeguet V, Lauquin GJ, Brandolin G. Structure of mitochondrial ADP/ATP carrier in complex with carboxyatractyloside. Nature. 2003;426:39–44. doi: 10.1038/nature02056. [DOI] [PubMed] [Google Scholar]
- 7.Faham S, Watanabe A, Besserer GM, Cascio D, Specht A, Hirayama BA, Wright EM, Abramson J. The crystal structure of a sodium galactose transporter reveals mechanistic insights into Na+/sugar symport. Science. 2008;321:810–814. doi: 10.1126/science.1160406. [DOI] [PMC free article] [PubMed] [Google Scholar]
- 8.Yamashita A, Singh SK, Kawate T, Jin Y, Gouaux E. Crystal structure of a bacterial homologue of Na+/Cl—dependent neurotransmitter transporters. Nature. 2005;437:215–223. doi: 10.1038/nature03978. [DOI] [PubMed] [Google Scholar]
- 9.Gether U, Andersen PH, Larsson OM, Schousboe A. Neurotransmitter transporters: molecular function of important drug targets. Trends Pharmacol Sci. 2006;27:375–383. doi: 10.1016/j.tips.2006.05.003. [DOI] [PubMed] [Google Scholar]
- 10.Krishnamurthy H, Piscitelli CL, Gouaux E. Unlocking the molecular secrets of sodium-coupled transporters. Nature. 2009;459:347–355. doi: 10.1038/nature08143. [DOI] [PMC free article] [PubMed] [Google Scholar]
- 11.Gao X, Lu F, Zhou L, Dang S, Sun L, Li X, Wang J, Shi Y. Structure and mechanism of an amino acid antiporter. Science. 2009;324:1565–1568. doi: 10.1126/science.1173654. [DOI] [PubMed] [Google Scholar]
- 12.Fang Y, Jayaram H, Shane T, Kolmakova-Partensky L, Wu F, Williams C, Xiong Y, Miller C. Structure of a prokaryotic virtual proton pump at 3.2 A resolution. Nature. 2009;460:1040–1043. doi: 10.1038/nature08201. [DOI] [PMC free article] [PubMed] [Google Scholar]
- 13.Shaffer PL, Goehring A, Shankaranarayanan A, Gouaux E. Structure and mechanism of a Na+-independent amino acid transporter. Science. 2009;325:1010–1014. doi: 10.1126/science.1176088. [DOI] [PMC free article] [PubMed] [Google Scholar]
- 14.Ressl S, Terwisscha van Scheltinga AC, Vonrhein C, Ott V, Ziegler C. Molecular basis of transport and regulation in the Na(+)/betaine symporter BetP. Nature. 2009;458:47–52. doi: 10.1038/nature07819. [DOI] [PubMed] [Google Scholar]
- 15.Yernool D, Boudker O, Jin Y, Gouaux E. Structure of a glutamate transporter homologue from Pyrococcus horikoshii. Nature. 2004;431:811–818. doi: 10.1038/nature03018. [DOI] [PubMed] [Google Scholar]
- 16.Huang Y, Lemieux MJ, Song J, Auer M, Wang DN. Structure and mechanism of the glycerol-3-phosphate transporter from Escherichia coli. Science. 2003;301:616–620. doi: 10.1126/science.1087619. [DOI] [PubMed] [Google Scholar]
- 17.Mirza O, Guan L, Verner G, Iwata S, Kaback HR. Structural evidence for induced fit and a mechanism for sugar/H+ symport in LacY. EMBO J. 2006;25:1177–1183. doi: 10.1038/sj.emboj.7601028. [DOI] [PMC free article] [PubMed] [Google Scholar]
- 18.Yin Y, He X, Szewczyk P, Nguyen T, Chang G. Structure of the multidrug transporter EmrD from Escherichia coli. Science. 2006;312:741–744. doi: 10.1126/science.1125629. [DOI] [PMC free article] [PubMed] [Google Scholar]
- 19.Abramson J, Smirnova I, Kasho V, Verner G, Kaback HR, Iwata S. Structure and mechanism of the lactose permease of Escherichia coli. Science. 2003;301:610–615. doi: 10.1126/science.1088196. [DOI] [PubMed] [Google Scholar]
- 20.Abramson J, Iwata S, Kaback HR. Lactose permease as a paradigm for membrane transport proteins. Mol Membr Biol. 2004;21:227–236. doi: 10.1080/09687680410001716862. (Review) [DOI] [PubMed] [Google Scholar]
- 21.Guan L, Kaback HR. Lessons from lactose permease. Annu Rev Biophys Biomol Struct. 2006;35:67–91. doi: 10.1146/annurev.biophys.35.040405.102005. [DOI] [PMC free article] [PubMed] [Google Scholar]
- 22.Karpowich NK, Wang DN. Structural biology: symmetric transporters for asymmetric transport. Science. 2008;321:781–782. doi: 10.1126/science.1161495. [DOI] [PMC free article] [PubMed] [Google Scholar]
- 23.Forrest LR, Zhang YW, Jacobs MT, Gesmonde J, Xie L, Honig BH, Rudnick G. Mechanism for alternating access in neurotransmitter transporters. Proc Natl Acad Sci USA. 2008;105:10338–10343. doi: 10.1073/pnas.0804659105. [DOI] [PMC free article] [PubMed] [Google Scholar]
- 24.Weyand S, Shimamura T, Yajima S, Suzuki S, Mirza O, Krusong K, Carpenter EP, Rutherford NG, Hadden JM, O'Reilly J, Ma P, Saidijam M, Patching SG, Hope RJ, Norbertczak HT, Roach PC, Iwata S, Henderson PJ, Cameron AD. Structure and molecular mechanism of a nucleobase-cation-symport-1 family transporter. Science. 2008;322:709–713. doi: 10.1126/science.1164440. [DOI] [PMC free article] [PubMed] [Google Scholar]
- 25.Lomize MA, Lomize AL, Pogozheva ID, Mosberg HI. OPM: orientations of proteins in membranes database. Bioinformatics. 2006;22:623–625. doi: 10.1093/bioinformatics/btk023. [DOI] [PubMed] [Google Scholar]
- 26.Madhusudhan MS, Webb BM, Marti-Renom MA, Eswar N, Sali A. Alignment of multiple protein structures based on sequence and structure features. Protein Eng Des Sel. 2009;22:569–574. doi: 10.1093/protein/gzp040. [DOI] [PMC free article] [PubMed] [Google Scholar]
- 27.Altschul SF, Madden TL, Schaffer AA, Zhang J, Zhang Z, Miller W, Lipman DJ. Gapped BLAST and PSI-BLAST: a new generation of protein database search programs. Nucl Acids Res. 1997;25:3389–3402. doi: 10.1093/nar/25.17.3389. [DOI] [PMC free article] [PubMed] [Google Scholar]
- 28.Abramson J, Wright EM. Structure and function of Na(+)-symporters with inverted repeats. Curr Opin Struct Biol. 2009;19:425–432. doi: 10.1016/j.sbi.2009.06.002. [DOI] [PMC free article] [PubMed] [Google Scholar]
- 29.Murzin AG, Brenner SE, Hubbard T, Chothia C. SCOP: a structural classification of proteins database for the investigation of sequences and structures. J Mol Biol. 1995;247:536–540. doi: 10.1006/jmbi.1995.0159. [DOI] [PubMed] [Google Scholar]
- 30.Blakely RD, DeFelice LJ. All aglow about presynaptic receptor regulation of neurotransmitter transporters. Mol Pharmacol. 2007;71:1206–1208. doi: 10.1124/mol.107.035493. [DOI] [PubMed] [Google Scholar]
- 31.Chen NH, Reith ME, Quick MW. Synaptic uptake and beyond: the sodium- and chloride-dependent neurotransmitter transporter family SLC6. Pflugers Arch. 2004;447:519–531. doi: 10.1007/s00424-003-1064-5. [DOI] [PubMed] [Google Scholar]
- 32.Manji HK, Drevets WC, Charney DS. The cellular neurobiology of depression. Nat Med. 2001;7:541–547. doi: 10.1038/87865. [DOI] [PubMed] [Google Scholar]
- 33.Nestler EJ, Barrot M, DiLeone RJ, Eisch AJ, Gold SJ, Monteggia LM. Neurobiology of depression. Neuron. 2002;34:13–25. doi: 10.1016/s0896-6273(02)00653-0. [DOI] [PubMed] [Google Scholar]
- 34.Leabman MK, Huang CC, DeYoung J, Carlson EJ, Taylor TR, de la Cruz M, Johns SJ, Stryke D, Kawamoto M, Urban TJ, Kroetz DL, Ferrin TE, Clark AG, Risch N, Herskowitz I, Giacomini KM. Natural variation in human membrane transporter genes reveals evolutionary and functional constraints. Proc Natl Acad Sci USA. 2003;100:5896–5901. doi: 10.1073/pnas.0730857100. Pharmacogenetics of Membrane Transporters Investigators. [DOI] [PMC free article] [PubMed] [Google Scholar]
- 35.Koepsell H, Schmitt BM, Gorboulev V. Organic cation transporters. Rev Physiol Biochem Pharmacol. 2003;150:36–90. doi: 10.1007/s10254-003-0017-x. [DOI] [PubMed] [Google Scholar]
- 36.Shu Y, Brown C, Castro RA, Shi RJ, Lin ET, Owen RP, Sheardown SA, Yue L, Burchard EG, Brett CM, Giacomini KM. Effect of genetic variation in the organic cation transporter 1, OCT1, on metformin pharmacokinetics. Clin Pharmacol Ther. 2008;83:273–280. doi: 10.1038/sj.clpt.6100275. [DOI] [PMC free article] [PubMed] [Google Scholar]
- 37.Shu Y, Sheardown SA, Brown C, Owen RP, Zhang S, Castro RA, Ianculescu AG, Yue L, Lo JC, Burchard EG, Brett CM, Giacomini KM. Effect of genetic variation in the organic cation transporter 1 (OCT1) on metformin action. J Clin Invest. 2007;117:1422–1431. doi: 10.1172/JCI30558. [DOI] [PMC free article] [PubMed] [Google Scholar]
- 38.Shu Y, Leabman MK, Feng B, Mangravite LM, Huang CC, Stryke D, Kawamoto M, Johns SJ, DeYoung J, Carlson E, Ferrin TE, Herskowitz I, Giacomini KM. Evolutionary conservation predicts function of variants of the human organic cation transporter, OCT1. Proc Natl Acad Sci USA. 2003;100:5902–5907. doi: 10.1073/pnas.0730858100. Pharmacogenetics of Membrane Transporters Investigators. [DOI] [PMC free article] [PubMed] [Google Scholar]
- 39.Dresser MJ, Gray AT, Giacomini KM. Kinetic and selectivity differences between rodent, rabbit, and human organic cation transporters (OCT1) J Pharmacol Exp Ther. 2000;292:1146–1152. [PubMed] [Google Scholar]
- 40.Hilgemann DW, Lu CC. GAT1 (GABA:Na+:Cl−) cotransport function. Database reconstruction with an alternating access model. J Gen Physiol. 1999;114:459–475. doi: 10.1085/jgp.114.3.459. [DOI] [PMC free article] [PubMed] [Google Scholar]
- 41.Jardetzky O. Simple allosteric model for membrane pumps. Nature. 1966;211:969–970. doi: 10.1038/211969a0. [DOI] [PubMed] [Google Scholar]
- 42.Singh SK, Piscitelli CL, Yamashita A, Gouaux E. A competitive inhibitor traps LeuT in an open-to-out conformation. Science. 2008;322:1655–1661. doi: 10.1126/science.1166777. [DOI] [PMC free article] [PubMed] [Google Scholar]
- 43.Andersen J, Kristensen AS, Bang-Andersen B, Stromgaard K. Recent advances in the understanding of the interaction of antidepressant drugs with serotonin and norepinephrine transporters. Chem Commun (Camb) 2009;25:3677–3692. doi: 10.1039/b903035m. [DOI] [PubMed] [Google Scholar]
- 44.Singh SK, Yamashita A, Gouaux E. Antidepressant binding site in a bacterial homologue of neurotransmitter transporters. Nature. 2007;448:952–956. doi: 10.1038/nature06038. [DOI] [PubMed] [Google Scholar]
- 45.Zhou Z, Zhen J, Karpowich NK, Goetz RM, Law CJ, Reith ME, Wang DN. LeuT-desipramine structure reveals how antidepressants block neurotransmitter reuptake. Science. 2007;317:1390–1393. doi: 10.1126/science.1147614. [DOI] [PMC free article] [PubMed] [Google Scholar]
- 46.Shi L, Quick M, Zhao Y, Weinstein H, Javitch JA. The mechanism of a neurotransmitter:sodium symporter—inward release of Na+ and substrate is triggered by substrate in a second binding site. Mol Cell. 2008;30:667–677. doi: 10.1016/j.molcel.2008.05.008. [DOI] [PMC free article] [PubMed] [Google Scholar]
- 47.Quick M, Winther AM, Shi L, Nissen P, Weinstein H, Javitch JA. Binding of an octylglucoside detergent molecule in the second substrate (S2) site of LeuT establishes an inhibitor-bound conformation. Proc Natl Acad Sci USA. 2009;106:5563–5568. doi: 10.1073/pnas.0811322106. [DOI] [PMC free article] [PubMed] [Google Scholar]
- 48.Chothia C, Lesk AM. The relation between the divergence of sequence and structure in proteins. EMBO J. 1986;5:823–826. doi: 10.1002/j.1460-2075.1986.tb04288.x. [DOI] [PMC free article] [PubMed] [Google Scholar]
- 49.Sander C, Schneider R. Database of homology-derived protein structures and the structural meaning of sequence alignment. Proteins. 1991;9:56–68. doi: 10.1002/prot.340090107. [DOI] [PubMed] [Google Scholar]
- 50.Brenner SE, Chothia C, Hubbard TJ. Assessing sequence comparison methods with reliable structurally identified distant evolutionary relationships. Proc Natl Acad Sci USA. 1998;95:6073–6078. doi: 10.1073/pnas.95.11.6073. [DOI] [PMC free article] [PubMed] [Google Scholar]
- 51.Rost B. Twilight zone of protein sequence alignments. Protein Eng. 1999;12:85–94. doi: 10.1093/protein/12.2.85. [DOI] [PubMed] [Google Scholar]
- 52.Atkinson HJ, Morris JH, Ferrin TE, Babbitt PC. Using sequence similarity networks for visualization of relationships across diverse protein superfamilies. PLoS ONE. 2009;4:e4345. doi: 10.1371/journal.pone.0004345. [DOI] [PMC free article] [PubMed] [Google Scholar]
- 53.The UniProt Consortium. The universal protein resource (UniProt) Nucl Acids Res. 2008;36:D190–D195. doi: 10.1093/nar/gkm895. [DOI] [PMC free article] [PubMed] [Google Scholar]
- 54.Benson DA, Karsch-Mizrachi I, Lipman DJ, Ostell J, Sayers EW. GenBank. Nucl Acids Res. 2010:D46–51. doi: 10.1093/nar/gkp1024. [DOI] [PMC free article] [PubMed] [Google Scholar]
- 55.Shannon P, Markiel A, Ozier O, Baliga NS, Wang JT, Ramage D, Amin N, Schwikowski B, Ideker T. Cytoscape: a software environment for integrated models of biomolecular interaction networks. Genome Res. 2003;13:2498–2504. doi: 10.1101/gr.1239303. [DOI] [PMC free article] [PubMed] [Google Scholar]
- 56.Palacin M, Kanai Y. The ancillary proteins of HATs: SLC3 family of amino acid transporters. Pflugers Arch. 2004;447:490–494. doi: 10.1007/s00424-003-1062-7. [DOI] [PubMed] [Google Scholar]
- 57.Manolescu AR, Augustin R, Moley K, Cheeseman C. A highly conserved hydrophobic motif in the exofacial vestibule of fructose transporting SLC2A proteins acts as a critical determinant of their substrate selectivity. Mol Membr Biol. 2007;24:455–463. doi: 10.1080/09687680701298143. [DOI] [PubMed] [Google Scholar]
- 58.Vitart V, Rudan I, Hayward C, Gray NK, Floyd J, Palmer CN, Knott SA, Kolcic I, Polasek O, Graessler J, et al. SLC2A9 is a newly identified urate transporter influencing serum urate concentration, urate excretion and gout. Nat Genet. 2008;40:437–442. doi: 10.1038/ng.106. [DOI] [PubMed] [Google Scholar]
- 59.Caulfield MJ, Munroe PB, O'Neill D, Witkowska K, Charchar FJ, Doblado M, Evans S, Eyheramendy S, Onipinla A, Howard P, Shaw-Hawkins S, Dobson RJ, Wallace C, Newhouse SJ, Brown M, Connell JM, Dominiczak A, Farrall M, Lathrop GM, Samani NJ, Kumari M, Marmot M, Brunner E, Chambers J, Elliott P, Kooner J, Laan M, Org E, Veldre G, Viigimaa M, Cappuccio FP, Ji C, Iacone R, Strazzullo P, Moley KH, Cheeseman C. SLC2A9 is a high-capacity urate transporter in humans. PLoS Med. 2008;5:e197. doi: 10.1371/journal.pmed.0050197. [DOI] [PMC free article] [PubMed] [Google Scholar]
- 60.Uldry M, Thorens B. The SLC2 family of facilitated hexose and polyol transporters. Pflugers Arch. 2004;447:480–489. doi: 10.1007/s00424-003-1085-0. [DOI] [PubMed] [Google Scholar]
- 61.Yanai I, Benjamin H, Shmoish M, Chalifa-Caspi V, Shklar M, Ophir R, Bar-Even A, Horn-Saban S, Safran M, Domany E, Lancet D, Shmueli O. Genome-wide midrange transcription profiles reveal expression level relationships in human tissue specification. Bioinformatics. 2005;21:650–659. doi: 10.1093/bioinformatics/bti042. [DOI] [PubMed] [Google Scholar]
- 62.Theissen G. Secret life of genes. Nature. 2002;415:741. doi: 10.1038/415741a. [DOI] [PubMed] [Google Scholar]
- 63.Jeffery CJ. Moonlighting proteins: old proteins learning new tricks. Trends Genet. 2003;19:415–417. doi: 10.1016/S0168-9525(03)00167-7. [DOI] [PubMed] [Google Scholar]
- 64.Hegyi H, Gerstein M. Annotation transfer for genomics: measuring functional divergence in multi-domain proteins. Genome Res. 2001;11:1632–1640. doi: 10.1101/gr.183801. [DOI] [PMC free article] [PubMed] [Google Scholar]
- 65.Ofran Y, Punta M, Schneider R, Rost B. Beyond annotation transfer by homology: novel protein-function prediction methods to assist drug discovery. Drug Discov Today. 2005;10:1475–1482. doi: 10.1016/S1359-6446(05)03621-4. [DOI] [PubMed] [Google Scholar]
- 66.Rost B. Enzyme function less conserved than anticipated. J Mol Biol. 2002;318:595–608. doi: 10.1016/S0022-2836(02)00016-5. [DOI] [PubMed] [Google Scholar]
- 67.Hubbard TJ, Aken BL, Ayling S, Ballester B, Beal K, Bragin E, Brent S, Chen Y, Clapham P, Clarke L, Coates G, Fairley S, Fitzgerald S, Fernandez-Banet J, Gordon L, Graf S, Haider S, Hammond M, Holland R, Howe K, Jenkinson A, Johnson N, Kahari A, Keefe D, Keenan S, Kinsella R, Kokocinski F, Kulesha E, Lawson D, Longden I, Megy K, Meidl P, Overduin B, Parker A, Pritchard B, Rios D, Schuster M, Slater G, Smedley D, Spooner W, Spudich G, Trevanion S, Vilella A, Vogel J, White S, Wilder S, Zadissa A, Birney E, Cunningham F, Curwen V, Durbin R, Fernandez-Suarez XM, Herrero J, Kasprzyk A, Proctor G, Smith J, Searle S, Flicek P. Ensembl 2009. Nucl Acids Res. 2009;37:D690–D697. doi: 10.1093/nar/gkn828. [DOI] [PMC free article] [PubMed] [Google Scholar]
- 68.Krogh A. What are artificial neural networks? Nat Biotechnol. 2008;26:195–197. doi: 10.1038/nbt1386. [DOI] [PubMed] [Google Scholar]
- 69.Jacobsson JA, Haitina T, Lindblom J, Fredriksson R. Identification of six putative human transporters with structural similarity to the drug transporter SLC22 family. Genomics. 2007;90:595–609. doi: 10.1016/j.ygeno.2007.03.017. [DOI] [PubMed] [Google Scholar]
- 70.Bailey TL, Williams N, Misleh C, Li WW. MEME: discovering and analyzing DNA and protein sequence motifs. Nucl Acids Res. 2006;34:W369–W373. doi: 10.1093/nar/gkl198. [DOI] [PMC free article] [PubMed] [Google Scholar]
- 71.Bashton M, Chothia C. The generation of new protein functions by the combination of domains. Structure. 2007;15:85–99. doi: 10.1016/j.str.2006.11.009. [DOI] [PubMed] [Google Scholar]
- 72.Kasho VN, Smirnova IN, Kaback HR. Sequence alignment and homology threading reveals prokaryotic and eukaryotic proteins similar to lactose permease. J Mol Biol. 2006;358:1060–1070. doi: 10.1016/j.jmb.2006.02.049. [DOI] [PMC free article] [PubMed] [Google Scholar]
- 73.Vadyvaloo V, Smirnova IN, Kasho VN, Kaback HR. Conservation of residues involved in sugar/H(+) symport by the sucrose permease of Escherichia coli relative to lactose permease. J Mol Biol. 2006;358:1051–1059. doi: 10.1016/j.jmb.2006.02.050. [DOI] [PMC free article] [PubMed] [Google Scholar]
- 74.Sorgen PL, Hu Y, Guan L, Kaback HR, Girvin ME. An approach to membrane protein structure without crystals. Proc Natl Acad Sci USA. 2002;99:14037–14040. doi: 10.1073/pnas.182552199. [DOI] [PMC free article] [PubMed] [Google Scholar]
- 75.Eisen JA. Phylogenomics: improving functional predictions for uncharacterized genes by evolutionary analysis. Genome Res. 1998;8:163–167. doi: 10.1101/gr.8.3.163. [DOI] [PubMed] [Google Scholar]
- 76.Forrest LR, Tang CL, Honig B. On the accuracy of homology modeling and sequence alignment methods applied to membrane proteins. Biophys J. 2006;91:508–517. doi: 10.1529/biophysj.106.082313. [DOI] [PMC free article] [PubMed] [Google Scholar]
- 77.Li M, Hays FA, Roe-Zurz Z, Vuong L, Kelly L, Ho CM, Robbins RM, Pieper U, O'Connell JD, III, Miercke LJ, Giacomini KM, Sali A, Stroud RM. Selecting optimum eukaryotic integral membrane proteins for structure determination by rapid expression and solubilization screening. J Mol Biol. 2009;385:820–830. doi: 10.1016/j.jmb.2008.11.021. [DOI] [PMC free article] [PubMed] [Google Scholar]
- 78.Punta M, Forrest LR, Bigelow H, Kernytsky A, Liu J, Rost B. Membrane protein prediction methods. Methods. 2007;41:460–474. doi: 10.1016/j.ymeth.2006.07.026. [DOI] [PMC free article] [PubMed] [Google Scholar]
- 79.Kelly L, Karchin R, Sali A. Protein interactions and disease phenotypes in the ABC transporter superfamily. Pac Symp Biocomput. 2007:51–63. [PubMed] [Google Scholar]
- 80.Feng B, Dresser MJ, Shu Y, Johns SJ, Giacomini KM. Arginine 454 and lysine 370 are essential for the anion specificity of the organic anion transporter, rOAT3. Biochemistry. 2001;40:5511–5520. doi: 10.1021/bi002841o. [DOI] [PubMed] [Google Scholar]
- 81.Zhang S, Lovejoy KS, Shima JE, Lagpacan LL, Shu Y, Lapuk A, Chen Y, Komori T, Gray JW, Chen X, Lippard SJ, Giacomini KM. Organic cation transporters are determinants of oxaliplatin cytotoxicity. Cancer Res. 2006;66:8847–8857. doi: 10.1158/0008-5472.CAN-06-0769. [DOI] [PMC free article] [PubMed] [Google Scholar]
- 82.Ahlin G, Karlsson J, Pedersen JM, Gustavsson L, Larsson R, Matsson P, Norinder U, Bergstrom CA, Artursson P. Structural requirements for drug inhibition of the liver specific human organic cation transport protein 1. J Med Chem. 2008;51:5932–5942. doi: 10.1021/jm8003152. [DOI] [PubMed] [Google Scholar]
- 83.Blundell TL, Sibanda BL, Montalvao RW, Brewerton S, Chelliah V, Worth CL, Harmer NJ, Davies O, Burke D. Structural biology and bioinformatics in drug design: opportunities and challenges for target identification and lead discovery. Philos Trans R Soc Lond B Biol Sci. 2006;361:413–423. doi: 10.1098/rstb.2005.1800. [DOI] [PMC free article] [PubMed] [Google Scholar]
- 84.Shoichet BK. Virtual screening of chemical libraries. Nature. 2004;432:862–865. doi: 10.1038/nature03197. [DOI] [PMC free article] [PubMed] [Google Scholar]
- 85.Kitchen DB, Decornez H, Furr JR, Bajorath J. Docking and scoring in virtual screening for drug discovery: methods and applications. Nat Rev Drug Discov. 2004;3:935–949. doi: 10.1038/nrd1549. [DOI] [PubMed] [Google Scholar]
- 86.Sanchez R, Sali A. Large-scale protein structure modeling of the Saccharomyces cerevisiae genome. Proc Natl Acad Sci USA. 1998;95:13597–13602. doi: 10.1073/pnas.95.23.13597. [DOI] [PMC free article] [PubMed] [Google Scholar]
- 87.Koehl P, Levitt M. A brighter future for protein structure prediction. Nat Struct Biol. 1999;6:108–111. doi: 10.1038/5794. [DOI] [PubMed] [Google Scholar]
- 88.Baker D, Sali A. Protein structure prediction and structural genomics. Science. 2001;294:93–96. doi: 10.1126/science.1065659. [DOI] [PubMed] [Google Scholar]
- 89.Landau M, Herz K, Padan E, Ben-Tal N. Model structure of the Na+/H+ exchanger 1 (NHE1): functional and clinical implications. J Biol Chem. 2007;282:37854–37863. doi: 10.1074/jbc.M705460200. [DOI] [PubMed] [Google Scholar]
- 90.Forrest LR, Tavoulari S, Zhang YW, Rudnick G, Honig B. Identification of a chloride ion binding site in Na+/Cl− dependent transporters. Proc Natl Acad Sci USA. 2007;104:12761–12766. doi: 10.1073/pnas.0705600104. [DOI] [PMC free article] [PubMed] [Google Scholar]
- 91.Celik L, Sinning S, Severinsen K, Hansen CG, Moller MS, Bols M, Wiborg O, Schiott B. Binding of serotonin to the human serotonin transporter. Molecular modeling and experimental validation. J Am Chem Soc. 2008;130:3853–3865. doi: 10.1021/ja076403h. [DOI] [PubMed] [Google Scholar]
- 92.Beuming T, Kniazeff J, Bergmann ML, Shi L, Gracia L, Raniszewska K, Newman AH, Javitch JA, Weinstein H, Gether U, Loland CJ. The binding sites for cocaine and dopamine in the dopamine transporter overlap. Nat Neurosci. 2008;11:780–789. doi: 10.1038/nn.2146. [DOI] [PMC free article] [PubMed] [Google Scholar]
- 93.Beuming T, Shi L, Javitch JA, Weinstein H. A comprehensive structure-based alignment of prokaryotic and eukaryotic neurotransmitter/Na+ symporters (NSS) aids in the use of the LeuT structure to probe NSS structure and function. Mol Pharmacol. 2006;70:1630–1642. doi: 10.1124/mol.106.026120. [DOI] [PubMed] [Google Scholar]
- 94.Macarron R. Critical review of the role of HTS in drug discovery. Drug Discov Today. 2006;11:277–279. doi: 10.1016/j.drudis.2006.02.001. [DOI] [PubMed] [Google Scholar]
- 95.Enright AJ, van Dongen S, Ouzounis CA. An efficient algorithm for large-scale detection of protein families. Nucl Acids Res. 2002;30:1575–1584. doi: 10.1093/nar/30.7.1575. [DOI] [PMC free article] [PubMed] [Google Scholar]
- 96.Wheeler DL, Church DM, Lash AE, Leipe DD, Madden TL, Pontius JU, Schuler GD, Schriml LM, Tatusova TA, Wagner L, Rapp BA. Database resources of the National Center for Biotechnology Information. Nucl Acids Res. 2001;29:11–16. doi: 10.1093/nar/29.1.11. [DOI] [PMC free article] [PubMed] [Google Scholar]
- 97.Su AI, Wiltshire T, Batalov S, Lapp H, Ching KA, Block D, Zhang J, Soden R, Hayakawa M, Kreiman G, Cooke MP, Walker JR, Hogenesch JB. A gene atlas of the mouse and human protein-encoding transcriptomes. Proc Natl Acad Sci USA. 2004;101:6062–6067. doi: 10.1073/pnas.0400782101. [DOI] [PMC free article] [PubMed] [Google Scholar]
- 98.Sonnhammer EL, von Heijne G, Krogh A. A hidden Markov model for predicting transmembrane helices in protein sequences. Proc Int Conf Intell Syst Mol Biol. 1998;6:175–182. [PubMed] [Google Scholar]
- 99.Kelly L, Pieper U, Eswar N, Hays FA, Li M, Roe-Zurz Z, Kroetz DL, Giacomini KM, Stroud RM, Sali A. A survey of integral alpha-helical membrane proteins. J Struct Funct Genomics. 2009;10:269–280. doi: 10.1007/s10969-009-9069-8. [DOI] [PMC free article] [PubMed] [Google Scholar]
- 100.Sali A, Blundell TL. Comparative protein modelling by satisfaction of spatial restraints. J Mol Biol. 1993;234:779–815. doi: 10.1006/jmbi.1993.1626. [DOI] [PubMed] [Google Scholar]
- 101.Pearson WR. Empirical statistical estimates for sequence similarity searches. J Mol Biol. 1998;276:71–84. doi: 10.1006/jmbi.1997.1525. [DOI] [PubMed] [Google Scholar]
- 102.Edgar RC. MUSCLE: multiple sequence alignment with high accuracy and high throughput. Nucl Acids Res. 2004;32:1792–1797. doi: 10.1093/nar/gkh340. [DOI] [PMC free article] [PubMed] [Google Scholar]
- 103.Retief JD. Phylogenetic analysis using PHYLIP. Methods Mol Biol. 2000;132:243–258. doi: 10.1385/1-59259-192-2:243. [DOI] [PubMed] [Google Scholar]
- 104.Clamp M, Cuff J, Searle SM, Barton GJ. The Jalview Java alignment editor. Bioinformatics. 2004;20:426–427. doi: 10.1093/bioinformatics/btg430. [DOI] [PubMed] [Google Scholar]
- 105.Eswar N, John B, Mirkovic N, Fiser A, Ilyin VA, Pieper U, Stuart AC, Marti-Renom MA, Madhusudhan MS, Yerkovich B, Sali A. Tools for comparative protein structure modeling and analysis. Nucleic Acids Res. 2003;31:3375–3380. doi: 10.1093/nar/gkg543. [DOI] [PMC free article] [PubMed] [Google Scholar]
- 106.Pieper U, Eswar N, Webb BM, Eramian D, Kelly L, Barkan DT, Carter H, Mankoo P, Karchin R, Marti-Renom MA, Davis FP, Sali A. MODBASE, a database of annotated comparative protein structure models and associated resources. Nucl Acids Res. 2009;37:D347–D354. doi: 10.1093/nar/gkn791. [DOI] [PMC free article] [PubMed] [Google Scholar]
- 107.Shen MY, Sali A. Statistical potential for assessment and prediction of protein structures. Protein Sci. 2006;15:2507–2524. doi: 10.1110/ps.062416606. [DOI] [PMC free article] [PubMed] [Google Scholar]