

Abstract
We aimed to compare disability rates associated with physical disorders versus psychiatric disorders and to establish treatment rates of both classes of disorder in the South African population. In a nationally representative survey of 4351 adults, treatment and prevalence rates of a range of physical and psychiatric disorders, and their associated morbidity during the previous 12 months were investigated. Physical illnesses were reported in 55.2% of the sample, 60.4% of whom received treatment for their disorder. Approximately 10% of the sample endorsed a mental illness with 6.1% having received treatment for their disorder. The prevalence of any mental illness reported was higher than that reported individually for asthma, cancer, diabetes and peptic ulcer. Mental disorders were consistently reported to be more disabling than physical disorders and the degree of disability increased as the number of comorbid disorders increased. Depression, in particular, was rated consistently higher across all domains than all physical disorders. Despite high rates of mental disorders and associated disability in South Africa, they are less likely to be treated than physical disorders.
Keywords: Disability, Mental Health, Physical Health, South Africa, Treatment
Introduction
The Global Burden of Disease (GBD) Study determined that the highest disease burden in 1990 (21.4% of the global total) was in sub-Saharan Africa (Murray and Lopez, 1997), and in 2001 found that almost half this burden was due to non-communicable diseases (Lopez et al., 2006). For example, neuropsychiatric disorders have been reported to cause 17.6% of all years lost due to disability (YLDs) in Africa (World Health Organisation, 2001), however, both public and private health-care systems have appeared to concentrate prevention and intervention efforts on major communicable diseases (The Institute of Medicine, 2001). In South Africa, neuropsychiatric disorders rank high in their disability adjusted life year (DALY) estimates (Bradshaw et al., 2007) and there is a need for a stronger health sector response to the these conditions.
Cost (and burden) of illness studies are relatively lacking in Africa and the rest of the developing world (Hu, 2006). However, findings from community-based studies in the developed world have documented significant psychiatric disability (Bijl and Ravelli, 2000; Kouzis and Eaton, 1997; Ormel et al., 1994), with several studies finding that respondents with one or more psychiatric disorder functioned worse than, or comparable to, respondents with a physical disorder (Kouzis and Eaton, 1997; Ormel et al., 1994; The ESEMeD/MHEDEA 2000 Investigators, 2004). A dose-response relationship has also been documented (i.e., increasing level of disability with an increase in the number of psychiatric disorders) (Alonso et al., 2004). Despite this, a large number of people with psychiatric disorders do not receive treatment (Weiner and Hanley, 1989; Eaton, 2004; Rupp, 1995; Wang et al, 2007). Clayer et al. (1998) have suggested that this may be because treatment is sought only when symptoms are deemed to interfere with a person’s ability to function adequately. Other possible reasons include fear of stigmatisation, low mental health literacy levels (Jorm et al., 1997), neglect by healthcare professionals and the lack of resources.
Owing to the scarcity of resources in South Africa and other parts of the developing world it is necessary that careful decisions are made regarding resource allocation (Landman and Henley, 1999). The negative economic consequences of psychiatric disorders far exceed the direct costs of treatment, thus making this group of disorders important to treat (Hu, 2006). As such, data on burden and cost, both direct (i.e., treatment costs) and indirect (i.e., impaired functioning in work and social roles, family burden, lost productivity) (Ormel et al., 1994; Spitzer et al., 1995) are important for both health planners and to inform health care policy.
Given these considerations, the aims of this paper were (i) to compare disability associated with physical disorders versus that associated with psychiatric disorders (depression and anxiety disorders) and (ii) to establish treatment rates of both classes of disorder in South Africa.
Methods
Sample
The South African Stress and Health Study (SASH) study was a national probability sample of 4351 adult South Africans living in both households and hostel quarters. Hostel quarters were included to maximize coverage of young working age males but the sample did not include individuals in institutions or in the military. Individuals of all race and ethnic backgrounds were included in the study. Full details of the sampling are provided in previous papers (Williams et al., 2004; Williams et al., 2008).
The sample was selected using a three-stage probability sample design. The first stage involved selecting a stratified probability sample of primary sampling areas equivalent to counties in the US or the UK based on the 2001 South African Census of Enumeration Areas (EAs). The EAs were sampled with probabilities proportionate to population size. The second stage involved selecting an equal- probability sample of housing units within each EA. The third stage involved selecting one random adult respondent from each sample housing unit. Interviewers selected a single adult respondent at random using the Kish procedure for objective respondent selection (Kish, 1949). A total sample of 5089 households was selected for SASH; of these, 4351 individuals agreed to participate and provided complete data that are included in this analysis.
Procedures
All interviews were conducted face-to-face by trained lay interviewers. Interviewers were trained in the administration of the interview in centralized group sessions lasting one week. The interviews were conducted in seven different languages: English, Afrikaans, Zulu, Xhosa, North Sotho, South Sotho and Tswana. The protocol, including all recruitment, consent and field procedures were approved by the Human Subjects Committees of the University of Michigan, Harvard Medical School, and by a single project assurance of compliance from the Medical University of South Africa that was approved by the National Institute of Mental Health.
Measures
Physical disorders were assessed with a standard chronic disorders checklist (Centers for Disease Control and Prevention, 2004; Schoenborn et al., 2000). Such checklists have been shown to yield more complete and accurate reports than estimates derived from responses to open-ended questions (Knight et al., 2001). In addition, methodological studies have documented moderate to good concordance between such reports and medical records in developed countries (Baker et al., 2001; Bergmann et al, 1998; Edwards et al., 1994; Kriegsman et al., 1996), although comparable studies do not exist in developing countries. The ten disorders considered here are: asthma, cancer, cardiovascular (hypertension, other heart disease), diabetes, musculoskeletal (arthritis, chronic back/neck pain), chronic headaches, other chronic pain disorders, and peptic ulcer. Symptom-based disorders (e.g., chronic headaches) were distinguished from silent disorders (e.g., hypertension), as respondents were asked to report whether they had each of the symptom-based disorders in the past 12-months and to say whether a doctor ever told them they had each of the silent disorders and, if so, whether they continued to have these disorders in the past 12 months. The implications of imperfect reliability and validity of this approach for assessing physical disorders were evaluated by carrying out analyses not only for all reported disorders, but also for the subset of these disorders that were treated. Treated cases are both more likely to meet full diagnostic criteria than self-reported untreated disorders and more likely to be disabling.
Psychiatric disorders were assessed with Version 3.0 of the World Health Organization (WHO) Composite International Diagnostic Interview (CIDI) (Kessler and Ustun, 2004), a fully structured lay-administered interview that generates diagnoses according to both DSM-IV and ICD-10 diagnostic systems. The three classes of disorders considered were anxiety disorders (panic disorder [PD], generalized anxiety disorder [GAD], social phobia [SAD], post-traumatic stress disorder [PTSD]), mood disorders (major depressive disorder [MDD] or dysthymia), and impulse-control disorders (intermittent explosive disorder [IED]). Substance use disorders were not considered in this paper. DSM-IV criteria are used in the current report and only disorders present in the past 12 months are considered. Generally good concordance has been found between CIDI diagnoses of anxiety and mood disorders and independent clinical assessment (Haro et al., 2006; Kessler et al., 2005).
Disability was assessed with the Sheehan Disability Scales (SDS) (Sheehan et al., 1996). The SDS asked respondents to rate, separately, the amount of disability caused by specific physical and psychiatric disorders in the domains of work, home management, social life, and close relationships during one month in the past year when the disorder was most severe. Ratings were made using a 0-to-10 visual analogue scale in which response option labels were none (0), mild (1–3), moderate (4–6), severe (7–9), and very severe (10). A global SDS disability score was also created by assigning each respondent the highest SDS domain score reported across the four domains. The SDS scales were administered separately for each of the ten psychiatric disorders and for one physical disorder selected randomly from among all the physical disorders reported by the respondent as being in existence during the 12 months before interview (there was a chart embedded in the interview, that allowed the interviewer to make a random selection given the number of chronic conditions that the respondent had endorsed). In order to correct for bias that may have been introduced by under-selection of comorbid physical disorders, a weight was applied to each case that was equal to the number of physical conditions reported by the respondent.
Treatment received was assessed separately for mental and physical disorders. For physical disorders, treatment was defined as seeing a medical doctor at least once in the past 12 months for the disorder. For psychiatric disorders, treatment was defined as getting any psychiatric health care in the past 12 months, either in a primary care setting or from specialty services. Self-report data have been shown in previous work to have generally good concordance with archival health care utilization records (Reijnveld and Stronks, 2001), although such work has been carried out exclusively in developed countries.
Statistical Analysis
All analyses incorporate individual-level weights to adjust for differential probabilities of selection within households, to match the sample to population socio-demographic distribution and to account for the complex survey design. In the case of physical disorders, an additional weight was applied to adjust for differential probability of selection as a function of number of physical disorders reported by the respondent. These weighted records were then pooled across samples for purposes of comparative analysis. Domain-specific and global SDS means, proportions rated “severe” or “very severe” (these groups were combined into a single category referred to here as “severe”), and the standard errors of these estimates were then calculated. Significance tests were then carried out to test the statistical significance of pair-wide differences in SDS means and proportions rated severe across all pairs of conditions. Between-disorder comparisons were made to determine whether disability ratings are systematically different for physical than for psychiatric disorders. All these significance tests were adjusted for the clustering and weighting of observations using the jackknife repeated replications pseudo-replication simulation method (Kish and Frankel, 1974). Significance was consistently evaluated at the 0.05 level with two-sided tests.
Results
Sociodemographic distribution of sample
The weighted distribution of the sample closely resembled the population as estimated in the 2001 census. 46.3% of the sample was male and 53.7% female. The majority (47.2%) fell into the 20 to 34 year age group, followed by the 35 to 49 year age group (30.4%). 76.2% of the sample was African (Black).
12-month prevalence of disorders and treatment in South Africa
The full list of disorders assessed is displayed in Table 1. Overall, 55.2% of the sample reported experiencing at least one physical illness in the last 12 months. The most prevalent self-reported physical disorders were headaches (32.5%) and, back/neck pain (26.1%). Cancer (0.8%) and heart disease (3.8%) were among the least reported conditions. By contrast, 9.6% reported any psychiatric illness, the most prevalent being depression (4.8%), followed by GAD and social phobia (both 1.9%). However, the prevalence of any mental illness reported was higher than that reported individually for asthma, cancer, diabetes and peptic ulcer.
Table 1.
Twelve-month prevalence of disorders and treatment
| Disorder Prevalence | Treatment Prevalence | ||||
|---|---|---|---|---|---|
| Categories | Disorder | N* | %(SE) | N** | %(SE) |
| I. Physical disorders | Arthritis | 453 | 10.0(0.5) | 59 | 53.5(8.7) |
| Asthma | 258 | 5.8(0.5) | 68 | 75.3(7.6) | |
| Back/neck | 1173 | 26.1(1.0) | 216 | 60.9(3.6) | |
| Cancer | 33 | 0.8(0.2) | 4 | 35.9(17.8) | |
| Chronic Pain | 533 | 12.1(0.8) | 89 | 58.8(7.0) | |
| Diabetes | 233 | 5.5(0.4) | 57 | 75.9(9.2) | |
| Headaches | 1464 | 32.5(1.3) | 328 | 52.8(3.0) | |
| Heart Disease | 184 | 3.8(0.3) | 33 | 58.1(8.6) | |
| High Blood Pressure | 767 | 16.7(0.7) | 203 | 68.1(4.2) | |
| Peptic Ulcer | 257 | 5.4(0.4) | 55 | 67.3(7.2) | |
| Any Physical Illness | 2450 | 55.2(1.4) | 1112 | 60.4(2.3) | |
| II. Mental disorders | Depression | 223 | 4.8(0.4) | 15 | 6.8(2.6) |
| GAD | 90 | 1.9(0.3) | 9 | 11.3(4.0) | |
| IED | 68 | 1.8(0.3) | 3 | 2.6(1.6) | |
| Panic Disorder | 37 | 0.8(0.2) | 2 | 7.4(5.3) | |
| PTSD | 27 | 0.6(0.1) | 4 | 24.8(11.5) | |
| Social Phobia | 89 | 1.9(0.3) | 8 | 9.1(3.6) | |
| Any Mental Illness | 431 | 9.6(0.7) | 27 | 6.1(1.5) | |
Number of respondents with the disorder
Number of cases in treatment
- Number of cases (N) are all unweighted
- Disorders with unweighted N less than 15 cases do not have percents
- N>15 restriction is based on number of cases in denominator
- % for treatment: Some %s are not consistent with the number of cases with disorder as the unweighted N in column 1 was based on all respondents who reported the disorder while the number of cases who received treatment were obtained only for the sub-sample of randomly selected physical disorders. However, randomly selected respondent were weighted to represent everyone who reported the disorder, thus the weighted number of cases who received treatment reflects the proportion of people who received treatment out of all reported the disorder.
GAD = generalized anxiety disorder; IED = intermittent explosive disorder; PTSD = post-traumatic stress disorder
The self-reported treatment rate for any physical illness was 60.4% and ranged from 35.9% for cancer to 75.9% for diabetes. Of those who indicated any psychiatric illness, 6.1% (ranging from 2.6% for IED to 24.8% for PTSD) had received any treatment in the previous year.
Physical and psychiatric disability ratings
The physical disorders with the highest mean global disability ratings were heart disease, peptic ulcer and asthma. Hypertension, arthritis and diabetes had the lowest global ratings. Of these, those with heart disease were most likely to rate their disorder as severe. Depression and GAD were the most globally disabling psychiatric disorders, and IED the least disabling. Those with panic disorder were most likely to rate their disorder as severe. Psychiatric disorders were consistently rated as more disabling than physical disorders (mean of 6.3 for psychiatric disorders vs 4.0 for physical disorders). Home management and work were the domains most severely affected by physical disorders whereas all domains were almost equally affected by psychiatric illness (Table 2). Women in the sample reported significantly less impairment on the home maintenance domain than did males (x2(1)4.7, p<0.030) and respondents with 16 or more years of education reported more impairment than those with less education in all domains (Global: x2(3)=26.7, p<0.000; Work: x2(3)=25.5, p<0.000; Home: x2(3)=13.8, p<0.003; Social: x2(3)=13.1, p<0.004) except for close relationships. Higher education was strongly associated with a greater likelihood of employment (x2(4)=195.4, p<0.000).
Table 2.
Disorder-specific Sheehan Disability Scale ratings
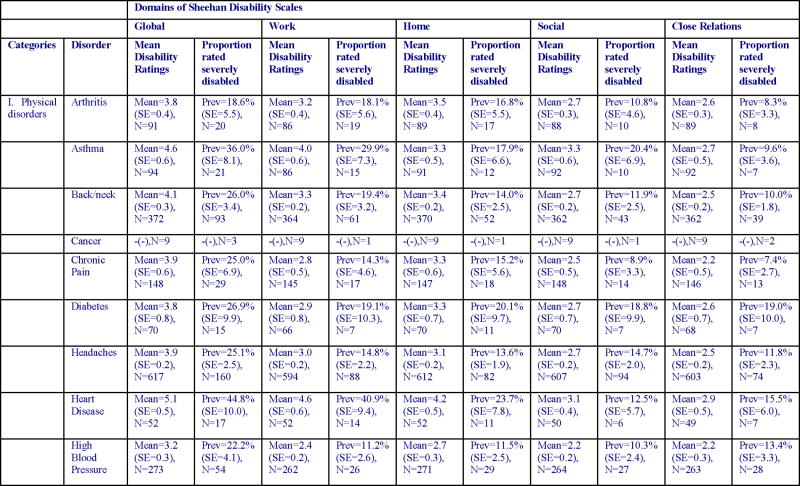
|

|
- N for means: Number of respondents with valid Sheehan scores for the randomly selected physical disorder or the mental disorder. Note that the numbers for physical disorder are substantially lower than those in Table 1, due to the fact that the prevalence estimates in Table 1 were based on all respondents who reported the disorder while the Sheehan scores were obtained only for the sub-sample of randomly selected physical disorders. The numbers for mental disorders in Table 2 are slightly lower than those in Table 1 because cases with missing values on Sheehan scores were omitted from Table 2 but not Table 1.
-N = Number of cases in treatment
-Disorders with unweighted N less than 15 cases do not have percents
-The N>15 restriction is based on number of cases in denominator
GAD = generalized anxiety disorder; IED = intermittent explosive disorder; PTSD = post-traumatic stress disorder
Psychiatric disorders consistently received higher overall disability ratings than physical disorders both for mean disability and for proportions rated severely disabled. This held true for treated (treated physical vs treated psychiatric) and untreated conditions. Treated physical disorders (which are assumed to be more severely disabling than untreated) were also compared overall with psychiatric disorders. Again disability ratings for psychiatric disorders were significantly higher than those for physical disorders (results available upon request).
Mann-Whitney tests (Table 3) revealed significantly higher psychiatric than physical global disability ratings for both mean disability ratings (z = 3.1, p < 0.002) and for the proportion rated severely disabled (z = 2.0, p < 0.046). Similar findings were obtained for social life (mean disability: z = 3.1, p < 0.002; proportion rated severe: z = 2.2, p < 0.030) and close relationships (mean disability: z = 3.4, p < 0.001; proportion rated severe: z = 2.5, p<= 0.011). Of the 45 logically possible pair-wise disorder-specific psychiatric-physical comparisons that could be made, mean disability ratings were higher for 44 (98%), and significantly higher for 27 (60%), of the psychiatric disorders (Table 4). With few exceptions higher psychiatric than physical disability ratings were also found when individual SDS domains were considered (heart disease and peptic ulcer were found to be more disabling than IED and SAD in the work domain and all physical disorders were reported to be more disabling on the household management domain than IED). These differences were more pronounced for disability in social life and personal relationships than in work or household management. Depression, in particular, was rated consistently higher across all domains than all physical disorders.
Table 3.
Mann-Whitney test between Pair-wise differences in the Sheehan Disability Scale disability ratings for all mental-physical disorder pairs
| Type | Domain | test_stat |
|---|---|---|
| Mean Sheehan Score comparison for Physical and Mental Illnesses | close relations | z=3.4*, P=0.001 |
| global | z=3.1*, P=0.002 | |
| home | z=1.8, P=0.070 | |
| social | z=3.1*, P=0.002 | |
| work | z=1.9, P=0.057 | |
| % severe (Sheehan score above 7) for physical and mental illnesses | close relations | z=2.5*, P=0.011 |
| global | z=2.0*, P=0.046 | |
| home | z=1.4, P=0.147 | |
| social | z=2.2*, P=0.030 | |
| work | z=0.8, P=0.415 |
Table 4.
Pair-wise differences in mean global Sheehan Disability Scale disability ratings for all mental-physical disorder pairs
| Categories | Depression | GAD | IED | Panic | PTSD | Social Phobia | Any Mental Disorder |
|---|---|---|---|---|---|---|---|
| Arthritis | diff=3.2*, X2=44.8, P=0.000 | diff=2.5*, X2=9.8, P=0.002 | diff=1.2, X2=1.6, P=0.209 | diff=2.3**, X2=4.4, P=0.035 | -(−) | diff=2.0*, X2=10.1, P=0.001 | diff=2.6*, X2=22.9, P=0.000 |
| Asthma | diff=2.3*, X2=13.6, P=0.000 | diff=1.7*, X2=4.0, P=0.046 | diff=0.3, X2=0.2, P=0.687 | diff=1.4+, X2=1.9, P=0.173 | -(−) | diff=1.1, X2=2.6, P=0.110 | diff=1.7*, X2=8.1, P=0.004 |
| Back/neck | diff=2.9*, X2=58.2, P=0.000 | diff=2.2*, X2=12.6, P=0.000 | diff=0.9, X2=1.4, P=0.235 | diff=2.0**, X2=4.1, P=0.042 | -(−) | diff=1.7*, X2=9.6, P=0.002 | diff=2.3*, X2=41.6, P=0.000 |
| Cancer | -(−) | -(−) | -(−) | -(−) | -(−) | -(−) | -(−) |
| Chronic Pain | diff=3.0*, X2=21.4, P=0.000 | diff=2.4*, X2=6.8, P=0.009 | diff=1.0, X2=1.2, P=0.280 | diff=2.1+, X2=3.0, P=0.085 | -(−) | diff=1.8*, X2=5.5, P=0.019 | diff=2.4*, X2=13.1, P=0.000 |
| Diabetes | diff=3.2*, X2=17.1, P=0.000 | diff=2.5*, X2=5.9, P=0.015 | diff=1.2, X2=1.0, P=0.329 | diff=2.2**, X2=4.8, P=0.029 | -(−) | diff=1.9*, X2=4.7, P=0.030 | diff=2.5*, X2=10.9, P=0.001 |
| Headaches | diff=3.0*, X2=80.3, P=0.000 | diff=2.4*, X2=13.6, P=0.000 | diff=1.0, X2=1.6, P=0.200 | diff=2.1**, X2=5.3, P=0.022 | -(−) | diff=1.8*, X2=13.4, P=0.000 | diff=2.4*, X2=46.1, P=0.000 |
| Heart Disease | diff=1.9*, X2=13.2, P=0.000 | diff=1.2, X2=2.8, P=0.097 | diff=-0.1, X2=0.0, P=0.949 | diff=0.9+, X2=1.1, P=0.292 | -(−) | diff=0.6, X2=1.6, P=0.212 | diff=1.3*, X2=6.6, P=0.010 |
| High Blood Pressure | diff=3.8*, X2=89.5, P=0.000 | diff=3.1*, X2=22.1, P=0.000 | diff=1.8*, X2=5.6, P=0.018 | diff=2.8**, X2=9.7, P=0.002 | -(−) | diff=2.5*, X2=21.2, P=0.000 | diff=3.2*, X2=60.7, P=0.000 |
| Peptic Ulcer | diff=2.0*, X2=12.9, P=0.000 | diff=1.3, X2=2.8, P=0.095 | diff=0.0, X2=0.0, P=0.955 | diff=1.1+, X2=1.0, P=0.322 | -(−) | diff=0.8, X2=1.4, P=0.245 | diff=1.4*, X2=5.8, P=0.016 |
| Any Physical Illness | diff=3.0*, X2=97.8, P=0.000 | diff=2.3*, X2=13.6, P=0.000 | diff=1.0, X2=1.7, P=0.189 | diff=2.1**, X2=5.1, P=0.024 | -(−) | diff=1.8*, X2=13.5, P=0.000 | diff=2.4*, X2=57.1, P=0.000 |
Significant physical-mental difference at the .05 level, two-sided test.
Significant at the .05 level but sub-sample of model less than 30
+sub-sample of model less than 30
#Each coefficient represents the difference between the mental disorder in the column and the physical disorder in the row. A positive coefficient means that the mental disorder has a higher mean than the physical disorder.
-Cells where one of the disorders have less than 15 cases with valid continuous Sheehan scores do not the difference calculated or the significance tests
GAD = generalized anxiety disorder; IED = intermittent explosive disorder; PTSD = post-traumatic stress disorder
For the moderate disability’ rated group, the greater the number of comorbid physical disorders present the greater was the level of disability reported with regards to heart disease, (x2=7.6, p<0.006) peptic ulcer(x2=13.4, p<0.000) and panic disorder (x2=11.2, p<0.001). For the ‘proportion rated severe’ group, the greater the number of comorbid physical disorders present the greater was the level of disability reported with regards to diabetes (x2=5.4, p<0.020) and heart disease (x2=6.5, p<0.014). In both groups, the greater the number of comorbid psychiatric illnesses present the greater was the disability reported for any physical illness (particularly back/neck pain (x2=5.2, p<0.023), headaches (x2=29.2, p<0.000) and heart disease (x2=10.4, p<0.001)) and for any psychiatric illness (particularly GAD (x2=4.5, p<0.035) and IED (x2=11.3, p<0.001)).
Discussion
More than half the sample (55.2%) endorsed at least one of the physical disorders assessed in the previous 12 months, and approximately one-tenth of the sample (9.6%) endorsed any psychiatric disorder. 60.4% of those with any physical disorder reported receiving treatment whereas 6.1% of those with a psychiatric disorder reported receiving treatment. Notably, the prevalence of any mental illness reported was higher than that reported individually for asthma, cancer, diabetes and peptic ulcer. Similarly, other studies (Merikangas et al., 2007) have found higher prevalence rates for many psychiatric than physical disorders. Despite this, like in the Ormel et al. (2008) cross-national comparison, treatment rates for physical disorders (ranging from 35.9% to 75.9%) were higher than those for any mental illness.
The marked difference in treatment rates may be explained on the basis of a lower proportion of psychiatric disorders recognised by healthcare professionals, an unwillingness of patients to disclose symptoms due to fear of stigmatization, low mental health literacy of patients or clinicians, or under-budgeting of mental health resources. It is also possible that individuals with mental health problems may seek help from family and friends as opposed to seeking help from healthcare facilities and clinicians.
Psychiatric disorders were consistently reported to be more disabling than physical disorders, even when treated physical disorders were compared to all psychiatric disorders. In order to minimize the effect of a higher proportion of sub-threshold cases of physical relative to psychiatric disorders being included in the analysis (owing to the more superficial assessment of the physical disorders in the survey), only treated physical disorders were examined. This was particularly evident in social life and close relationships domains. The finding that psychiatric disorders affect functioning as much as, or more, negatively than physical disorders is consistent with previous literature (Buist-Bouwman et al., 2006; The ESEMeD/MHEDEA 2000 Investigators, 2004; Clayer et al., 1998; Hays et al., 1995; Merikangas et al., 2007).
According to the GBD 2000 estimates, depression causes the largest amount of disability and accounts for almost 12% of all disability (World Health Organisation, 2001). In our study depression was also reported to be most disabling, followed by the anxiety disorders, with GAD being the most disabling and social phobia the least disabling within the anxiety disorders category. These results are consistent with the results of the NEMESIS study (Bijl and Ravelli, 2000) but contrast with the New Zealand Mental Health Survey (Wells et al., 2006; Dewa et al., 2007) and the ESEMeD study, a European study across 6 countries which found that anxiety disorders were more disabling than mood disorders (Buist-Bouwman et al., 2006). However, Buist-Bouwman et al. (2006) found agoraphobia (which we did not assess for here) to be the most disabling anxiety disorder followed by GAD, while SAD was the least disabling anxiety disorder (consistent with our findings).
Heart disease and peptic ulcer were the most disabling physical disorders, with heart disease being slightly more disabling than IED and peptic ulcer as equally disabling as IED. This finding is partially consistent with the European data in which heart disease was the most disabling disorder overall. However, other studies have found that musculoskeletal conditions have the greatest effect on disability, followed by depression (Knight et al., 2001; Baker et al., 2001; Merikangas et al., 2007).
Some authors have pointed out that psychiatric disorders that co-occur with physical illness are associated with a significantly higher odds of disability (Clayer et al., 1998; Dewa et al., 2007). Furthermore, compared to physical disorders, psychiatric disorders have generally been found to have stronger ‘cross-domain’ effects (Alonso et al., 2004). For example, Ormel et al. (1994) found that patients with one or more psychiatric disorder (irrespective of whether a GP had diagnosed a disorder or not) experienced higher levels of disability compared to patients with other ailments and no mental health symptoms. In line with this, comorbidity in our study increased the level of disability reported, particularly if a psychiatric disorder was the co-morbid disorder. Furthermore, disability increased as the number of comorbid conditions increased. Clayer et al. (1998) point out the clinical importance of this issue and emphasize the need to integrate treatment services for medically and psychiatrically ill patients. The consistent relationship of psychopathology and disability is also consistent with the compelling personal and socioeconomic impact of common psychiatric disorders across cultures (Ormel et al., 1994).
The only demographic correlates of note were that women reported less impairment in the home maintenance domain and respondents with 16 or more years of education reported more impairment in all domains except close relationships. It is possible that because maintenance of the home is, in most instances, left to women and may form part and parcel of their daily routine, women are less likely to endorse impairment in this domain. In terms of higher education, while there is data that links higher education with better functional outcomes in people with mental (Ellison et al., 2008) and physical (Shih et al., 2002) illness, our results contradict this. This may be explained by the fact that in this sample respondents with higher education were also more likely to be employed, and thus more likely to endorse impairments across several domains.
There are several limitations to this study. First, self-report measures were used to assess both disorders and functioning. This might have compromised validity owing to recall bias, fear of stigmatisation and knowledge of these disorders. Additionally, it has been suggested that respondents with psychiatric disorders may give overly pessimistic appraisals of their functioning (Buist-Bouwman et al., 2006; Ormel et al., 2008). Second, the physical conditions checklist did not include infectious diseases that play such an important part in the morbidity of developing countries (Ormel et al., 2008); nor were substance use and psychotic disorders assessed. Although the prevalence of psychotic disorders relative to mood and anxiety disorders is relatively low, in many instances these disorders are extremely disabling. Nonetheless, the disorders considered here are important sources of morbidity in South Africa. Third, psychiatric disorders were assessed with a fully structured lay interview whereas physical disorders were assessed with a checklist. More superficial assessment of physical disorders may have lead to the inclusion of more sub-threshold cases of physical than psychiatric disorders, as well as the exclusion of undiagnosed silent physical conditions, resulting in an underestimation of prevalence and/or disability of physical disorders (Merikangas et al., 2007; Ormel et al., 2008). However, the effect of this was reduced by comparing only treated physical disorders with all psychiatric disorders (treated and untreated).
Despite these limitations it is clear that psychiatric disorders contribute significantly to the global burden of disease, the costs of which need to be better recognized. Improved detection, prevention, and treatment are crucial if we are to address the burden of mental health and reduce associated costs, particularly as treatment of mental illness has been shown to be cost-effective (Chisholm et al., 2004). Furthermore, it is important to link treatment services and ensure a parity of resources for psychiatric and physical disorders. Studies on long-term treatment costs are needed in order to ensure a more cost-effective use of healthcare budgets. Improved access to healthcare for the psychiatrically ill is a key challenge for South Africa.
Acknowledgments
The South African Stress and Health study was carried out in conjunction with the World Health Organization World Mental Health (WMH) Survey Initiative. We thank the WMH staff for assistance with instrumentation, fieldwork, and data analysis. These activities were supported by the United States National Institute of Mental Health (R01MH070884), the John D. and Catherine T. MacArthur Foundation, the Pfizer Foundation, the US Public Health Service (R13-MH066849, R01-MH069864, and R01 DA016558), the Fogarty International Center (FIRCA R01-TW006481), the Pan American Health Organization, Eli Lilly and Company, Ortho-McNeil Pharmaceutical, Inc., GlaxoSmithKline, and Bristol-Myers Squibb. The South Africa Stress and Health study was funded by grant R01-MH059575 from the National Institute of Mental Health and the National Institute of Drug Abuse with supplemental funding from the South African Department of Health and the University of Michigan. Dan Stein and Soraya Seedat are also supported by the Medical Research Council (MRC) of South Africa. A complete list of WMH publications can be found at http://www.hcp.med.harvard.edu/wmh/.
Footnotes
Publisher's Disclaimer: This PDF receipt will only be used as the basis for generating PubMed Central (PMC) documents. PMC documents will be made available for review after conversion (approx. 2–3 weeks time). Any corrections that need to be made will be done at that time. No materials will be released to PMC without the approval of an author. Only the PMC documents will appear on PubMed Central -- this PDF Receipt will not appear on PubMed Central.
References
- Alonso J, Ferrer M, Gandek B, Ware JE, Aaronson NK, Mosconi P, Rasmussen N, Bullinger M, Fukuhara S, Kaasa S, Leplege A. Health related quality of life associated with chronic conditions in eight countries: results from the International Quality of Life Assessment (IQOLA) Project. Qual Life Res. 2004;13:283–298. doi: 10.1023/b:qure.0000018472.46236.05. [DOI] [PubMed] [Google Scholar]
- Baker M, Stabile M, Deri C. What do Self-Reported, Objective, Measures of Health Measure? J Human Resources. 2001;39:1067–1093. [Google Scholar]
- Bergmann MM, Byers T, Freedman DS. Validity of self-reported diagnoses leading to hospitalization: a comparison of self-reports with hospital records in a prospective study of American adults. Am J Epidemiol. 1998;147:969–977. doi: 10.1093/oxfordjournals.aje.a009387. [DOI] [PubMed] [Google Scholar]
- Bijl RV, Ravelli A. Current and residual functional disability associated with psychopathology: Findings from the Netherlands mental health survey and incidence study (NEMESIS) Psychol Med. 2000;30:657–668. doi: 10.1017/s0033291799001841. [DOI] [PubMed] [Google Scholar]
- Bradshaw D, Norman R, Schneider M. A clarion call for ation based on refined DALY estimates for South Africa. SAMJ. 2007;97 [PubMed] [Google Scholar]
- Buist-Bouwman MA, De Graaf R, Vollenbergh WAM, Alonso J, Bruffaerts R, Ormel J the ESEMeD/MHEDEA 2000 investigators. Functional disability of mental disorders and comparison with physical disorders: a study among the general population of six European countires. Acta Psychiatr Scand. 2006;113:492–500. doi: 10.1111/j.1600-0447.2005.00684.x. [DOI] [PubMed] [Google Scholar]
- Centers for Disease Control and Prevention. Health, United States. Washington DC: CDC; 2004. [Google Scholar]
- Chisholm D, Sanderson K, Ayuso-Mateos JL, Saxena S. Reducing the Global Burden of Depression. Population-level analysis of intervention cost-effectiveness in 14 world regions. Br J Psychiatry. 2004;184:393–403. doi: 10.1192/bjp.184.5.393. [DOI] [PubMed] [Google Scholar]
- Clayer J, Bookless C, Air T, McFarlane A. Psychiatric disorder and disability in a rural community. Soc Psychiatry Psychiatr Epidemiol. 1998;33:269–273. doi: 10.1007/s001270050054. [DOI] [PubMed] [Google Scholar]
- Dewa CS, Lin E, Kooehoorn M, Goldner E. Association of Chronic Work Stress, Psychiatric Disorders, and Chronic Physical Conditions With Disability Among Workers (2007) Psychiatr Serv. 2007;58:652–658. doi: 10.1176/ps.2007.58.5.652. [DOI] [PubMed] [Google Scholar]
- Eaton W. The NIMH epidemiological catchment area program: Implementation and major findings. Int J Methods Psychiatric Res. 1994;4:103–112. [Google Scholar]
- Edwards WS, Winn DM, Kurlantzick V. Evaluation of National Health Interview Survey Diagnostic Reporting. National Center for Health Statistics. Vital Health Stat 2: Data Evaluation and Methods Research. 1994;120:1–116. [PubMed] [Google Scholar]
- Ellison ML, Russinova Z, Lyass A, Rogers ES. Professionals and managers with severe mental illness: findings from a national survey. J Nerv Ment Dis. 2008;196:179–189. doi: 10.1097/NMD.0b013e318166303c. [DOI] [PubMed] [Google Scholar]
- Haro JM, Arbabzadeh-Bouchez S, Brugha TS. Concordance of the Composite International Diagnostic Interview Version 3.0 (CIDI 3.0) with standardized clinical assessments in the WHO World Mental Health Surveys. Int J Methods Psychiatric Res. 2006;15:167–180. doi: 10.1002/mpr.196. [DOI] [PMC free article] [PubMed] [Google Scholar]
- Hays RD, Wells KB, Sherbourne CD, Rogers W, Spritzer K. Functioning and well-being outcomes of patients with depression compared with chronic general medical illnesses. Arch Gen Psychiatry. 1995;52:11–19. doi: 10.1001/archpsyc.1995.03950130011002. [DOI] [PubMed] [Google Scholar]
- Hu TW. Perspectives: an international review of the national cost-estimates of mental illness, 1990–2003. J Ment Health Policy Econ. 2006;9:3–13. [PubMed] [Google Scholar]
- Jorm AF, Korten AE, Jacomb PA, Christensen H, Rodgers B, Pollitt P. “Mental health literacy”: a survey of the public’s ability to recognise mental disorders and their beliefs about the effectiveness of treatment. MJA. 1997;166:182–186. doi: 10.5694/j.1326-5377.1997.tb140071.x. [DOI] [PubMed] [Google Scholar]
- Kessler RC, Ustun TB. The World Mental Health (WMH) survey initiative version of the World Health Organization (WHO) Composite International Diagnostic Interview (CIDI) IntJ Methods Psych Res. 2004;13:93–121. doi: 10.1002/mpr.168. [DOI] [PMC free article] [PubMed] [Google Scholar]
- Kessler RC, Chiu WT, Demler O. Prevalence, severity, and comorbidity of 12-month DSM-IV disorders in the National Comorbidity Survey Replication. Arch Gen Psychiatry. 2005;62:617–627. doi: 10.1001/archpsyc.62.6.617. [DOI] [PMC free article] [PubMed] [Google Scholar]
- Kish L, Frankel MR. Inferences from complex samples. J R Stat Soc. 1974;36:1–37. [Google Scholar]
- Kish L. A procedure for objective respondent selection within the household. Am Stat Assoc J. 1949 Sept;:380–387. [Google Scholar]
- Knight M, Stewart-Brown S, Fletcher L. Estimating health needs: the impact of a checklist of conditions and quality of life measurement on health information derived from community surveys. J Pub Health Med. 2001;23:179–186. doi: 10.1093/pubmed/23.3.179. [DOI] [PubMed] [Google Scholar]
- Kouzis A, Eaton W. Psychopathology and the development of disability. Soc Psychiatry Psychiatr Epidemiol. 1997;32:379–386. doi: 10.1007/BF00788177. [DOI] [PubMed] [Google Scholar]
- Kriegsman DM, Penninx BW, van Eijk JT. Self-reports and general practitioner information on the presence of chronic diseases in community dwelling elderly. A study on the accuracy of patients’ self-reports and on determinants of inaccuracy. J Clin Epidemioly. 1996;49:1407–1417. doi: 10.1016/s0895-4356(96)00274-0. [DOI] [PubMed] [Google Scholar]
- Landman WA, Henley LD. Equitable rationing of highly specialised health care services for children: a perspective from South Africa. J Med Ethics. 1999;25:224–229. doi: 10.1136/jme.25.3.224. [DOI] [PMC free article] [PubMed] [Google Scholar]
- Lopez AD, Mathers CD, Ezzati M, Jamison DT, Murray CJ. Global and regional burden of disease and risk factors, 2001: systematic analysis of population health data. Lancet. 2006;367:1747–1757. doi: 10.1016/S0140-6736(06)68770-9. [DOI] [PubMed] [Google Scholar]
- Merikangas KR, Ames M, Cul L, Stang PE, Ustun TB, Von Korff M, Kessler R. The impact of comorbidity of mental and physical conditions on role disability in the US adult household population. Arch Gen Psychiatry. 2007;64:1180–1188. doi: 10.1001/archpsyc.64.10.1180. [DOI] [PMC free article] [PubMed] [Google Scholar]
- Murrey CJ, Lopez AD. Global mortality, disability and the contribution of risk factors: Global Burden of Disaese Study. Lancet. 1997;349:1436–42. doi: 10.1016/S0140-6736(96)07495-8. [DOI] [PubMed] [Google Scholar]
- Ormel J, Petukhova M, Chatterji S, Aguilar-Gaxiola S, Alonso J, Angermeyer MC, Bromet EJ, Burger H, Demyttenaere K, de Girolamo G, Haro JM, Hwang I, Karam E, Kawakami N, Lepine JP, Medina-Mora ME, Posada-Villa J, Sampson N, Scott K, Ustun TB, Von Korff M. Disability and treatment of specific mental and physical disorders across the world. Br J Psychiatry. 2008;192:368–375. doi: 10.1192/bjp.bp.107.039107. [DOI] [PMC free article] [PubMed] [Google Scholar]
- Ormel J, VonKorff M, Ustun TB, Pini S, Korten A, Oldehinkel T. Commom mental disorders and disability across cultures. Results from the WHO Collaborative Study on Psychological Problems in General Health Care. JAMA. 1994;272:1741–1748. doi: 10.1001/jama.272.22.1741. [DOI] [PubMed] [Google Scholar]
- Reijneveld SA, Stronks K. The validity of self-reported use of health care across socioeconomic strata: a comparison of survey and registration data. Int J Epidemiol. 2001;30:1407–1414. doi: 10.1093/ije/30.6.1407. [DOI] [PubMed] [Google Scholar]
- Rupp A. The economic consequences of not treating depression. Br J Psychiatry. 1995;(Suppl 27) [PubMed] [Google Scholar]
- Schoenborn CA, Adams PF, Schiller Summary health statistics for the U.S. population: National Health Interview Survey, 2000. Vital Health Stat. 2003;10 Data from the National Health Survey 1–83. [PubMed] [Google Scholar]
- Scott KM, McGee MA, Wells JE, Oakley Brown MA for the New Zealand Mental Health Research Team. Disability in Te Rau Hinengaro: The New Zealand Mental Health Survey. Aust N Z J Psychiatry. 2006;40:889–895. doi: 10.1080/j.1440-1614.2006.01908.x. [DOI] [PubMed] [Google Scholar]
- Sheehan DV, Harnett-Sheehan K, Raj BA. The measurement of disability. Int Clin Psychopharmacol. 1996;11 (Suppl 3):89–95. doi: 10.1097/00004850-199606003-00015. [DOI] [PubMed] [Google Scholar]
- Shih M, Hootman JM, Kruger J, Helmick CG. 2002 Physical activity in men and women with arthritis National Health Interview Survey. AM J Prev Med. 2006;30:385–393. doi: 10.1016/j.amepre.2005.12.005. [DOI] [PubMed] [Google Scholar]
- Spitzer RL, Kroenke K, Linzer M, Hahn SR, Williams JB, deGruy FV, III, Brody D, Davies M. Health-related quality of life in primary care patients with mental disorders: results from the PRIME-MD 1000 Study. JAMA. 1995;274:1511–1517. [PubMed] [Google Scholar]
- The ESEMeD/MHEDEA 2000 investigators. Disability and quality of life impact of mental disorders in Europe: results from the European Study of the Epidemiology of Mental Disorders (ESEMeD) project. Acta Psychiatr Scand. 2004;109:38–46. doi: 10.1111/j.1600-0047.2004.00329.x. [DOI] [PubMed] [Google Scholar]
- The Institute of Medicine. Neurological, Psychiatric, and Developmental Disorders: meeting the Challenge in the Developing World. National Academy Press; 2001. [PubMed] [Google Scholar]
- Wang PS, Aguilar-Gaxiola S, Alonso J, Angermeyer MC, Borges G, Bromet EJ, Bruffaerts R, de Girolamo G, de Graaf R, Gureje O, Haro JM, Karam EG, Kessler RC, Kovess V, Lane MC, Lee S, Levinson D, Ono Y, Petukhova M, Posada-Villa J, Seedat S, Wells JE. Use of mental health services for anxiety, mood, and substance disorders in 17 countries in the WHO world mental health surveys. Lancet. 2007;370:841–50. doi: 10.1016/S0140-6736(07)61414-7. [DOI] [PMC free article] [PubMed] [Google Scholar]
- Weiner JM, Hanley RJ. Measuring the activities of daily living among the elderly: a guide to national surveys. Committee on Estimates of Activities of Daily Living in National Surveys, Final Report; Canberra. 1989. [Google Scholar]
- Wells JE, Browne MA, Scott KM, McGee MA, Baxter J, Kokaua J for the New Zealand Mental Health Research Team. Prevalence, interference with life and severity of 12 month DSM-IV disorders in Te Rau Hinengaro: the New Zealand Mental Health Survey. Aust N Z Psychiatry. 2006;40:845–854. doi: 10.1080/j.1440-1614.2006.01903.x. [DOI] [PubMed] [Google Scholar]
- Williams DR, Herman A, Kessler RC, Sonnega J, Seedat S, Stein DJ, Moomal H, Wilson CM. The South African Stress and Health Study: Rationale and design. Metab Brain Dis. 2004;19:135–147. doi: 10.1023/b:mebr.0000027424.86587.74. [DOI] [PubMed] [Google Scholar]
- Williams DR, Herman A, Stein DJ, Heeringa SG, Jackson PB, Moomal H, Kessler RC. Twelve-month mental disorders in South Africa: prevalence, service use and demographic correlates in the population-based South African Stress and Health Study. Psychol Med. 2008;38:211–220. doi: 10.1017/S0033291707001420. [DOI] [PMC free article] [PubMed] [Google Scholar]
- World Health Organisation. Chapter 2: Burden of Mental and Behavioural Disorders. 2001 http://www.who.int/whr/2001/chapter2/en/index3.html.