

Abstract
This study sought to identify altered brain activation patterns in amnestic mild cognitive impairment (MCI) that could precede frank task impairment and neocortical atrophy. A high‐accuracy lexical decision (LD) task was therefore employed. Both MCI and normal seniors (NS) groups completed the LD task while functional magnetic resonance imaging (fMRI) was performed. Accuracy on the LD task was high (≥89% correct for both groups), and both groups activated a network of occipitotemporal regions and inferior frontal cortex. However, compared with the NS group, the MCI group showed reduced fMRI activation in these regions and increased activation in bilateral portions of anterior cingluate cortex. The results from a voxel‐based morphometry analysis indicated that altered activations in the MCI group were not within regions of atrophy. Receiver operating characteristic curves demonstrated that reduced fMRI response in the left and right midfusiform gyri accurately discriminated MCI from NS. When activation magnitude in both fusiform gyri were included in a single logistic regression model, group classification accuracy was very high (area under the curve = 0.93). These results showed that a disrupted functional response in the ventral temporal lobe accurately distinguishes individuals with MCI from NS, a finding which may have implications for identifying seniors at risk for cognitive decline. Hum Brain Mapp, 2010. © 2010 Wiley‐Liss, Inc.
Keywords: Alzheimer's disease, MCI, fMRI, structural imaging, lexical decision, fusiform gyrus
INTRODUCTION
As the population over age of 65 years increases, growing numbers will be at risk for Alzheimer's disease (AD). The development of objective neuroimaging markers of the prodromal stages of AD constitutes a major research goal because emerging interventions are most likely to be successful prior to generalized cognitive decline [Chong and Sahadevan, 2005; Chong et al., 2006]. Amnestic mild cognitive impairment (MCI) has been shown to represent early‐stage AD in the majority of cases that have come to autopsy or have been followed longitudinally to the point of transition to clinical dementia [Jicha et al., 2006; Markesbery et al., 2006; Morris et al., 2001; Petersen et al., 2006]. MCI is defined as a decline in episodic memory performance below the age‐adjusted normal range without significant impairment in global cognition or activities of daily living [Flicker et al., 1991; Petersen et al., 1999; Winblad, 2004].
It has been suggested that functional changes may precede macroscopic volumetric decline in some neocortical regions in MCI [Small, 2005]. A combination of functional and structural imaging techniques would be appropriate to address this question. To date, most combined functional–structural imaging studies conducted with MCI patients have used episodic memory‐encoding tasks that activate medial temporal lobe (MTL) regions [Dickerson et al., 2004, 2005; Jauhiainen et al., 2009]. The results from these studies have tended to report altered functional magnetic resonance imaging (fMRI) response in MTL regions in addition to reduced volume in some of those regions. These results are similar to previous findings of MTL volumetric reduction in MCI [Jack et al., 1997; Killiany et al., 2002] and provide important new information that fMRI signal is also altered in these MTL regions in MCI.
Knowledge about functional brain changes in MCI associated with tasks that do not rely on structurally compromised MTL regions is more limited. Altered fMRI responses in neocortical regions that remain structurally intact in MCI could reflect synaptic dysfunction associated with accumulating in situ pathology that precedes significant macroscopic structural decline [Small, 2005]. Identifying fMRI markers of MCI in regions that have not yet shown macroscopic volumetric decline is important for those emerging therapies that are more likely to be effective in preventing progression to AD rather than in reversing MTL atrophy already present in MCI [reviewed in Smith, 2007].
A related, underexplored aspect of the functional neuroanatomic response in MCI concerns activation patterns associated with preserved task performance. In most previous functional neuroimaging studies, the accuracy of the MCI group was well below that of the control group. When the performance of a neurological patient group is impaired relative to a normal group, fMRI activation differences could simply reflect those performance differences because activation in some brain regions has been found to correlate with behavioral performance in healthy participants [Gray et al., 2003; Rypma and D'Esposito, 1999]. In contrast, altered fMRI activation patterns in individuals with a progressive neurological disease, on a task they continue to perform accurately, may suggest a neural vulnerability that precedes impending task decline. Understanding the activation patterns associated with preserved task performance in MCI may thus be helpful in determining the effectiveness of emerging therapeutic interventions in preventing conversion to AD [Chertkow and Black, 2007].
The potential clinical utility of brain activation patterns in monitoring therapeutic intervention would be highest if MCI participants were found to show consistently altered fMRI responses in some brain regions. This issue can be explored using receiver operating characteristic (ROC) curves to determine the accuracy of activations in discriminating individuals with MCI from normal seniors (NS). Such ROC analyses have been used extensively in the structural imaging literature of AD and MCI [reviewed in de Leon et al., 2004]. However, little work has thus far explored the ability of fMRI activation changes to distinguish between individual MCI patients and NS.
To explore these issues we conducted a combined fMRI and structural imaging study, comparing MCI and NS control groups. A lexical decision (LD) task was used because previous research has shown that LD performance remains accurate in MCI but becomes impaired in AD [Bush et al., 2007; Duong et al., 2006]. Potential fMRI activation differences should thus reflect alterations in the MCI functional network that precede frank LD performance impairment. In addition, previous research has shown that LD recruits a network of neocortical regions that do not include structurally compromised MTL regions [Gold and Rastle, 2007; Hart et al., 2000; Madden et al., 2002; Rumsey et al., 1997]. The use of the LD task thus provided the opportunity to identify potentially altered functional activation patterns in regions that may still be structurally intact in MCI.
The objectives of this study were (1) to determine if MCI participants show fMRI changes on a task on which they continue to perform accurately, (2) to determine whether fMRI changes during the LD task overlap with regions showing volumetric reduction, and (3) to assess the accuracy with which fMRI changes in various brain regions can differentiate individuals with MCI from NS.
MATERIALS AND METHODS
Participants
The research procedures were approved by the Institutional Review Board of the University of Kentucky Medical Center, and all participants provided informed written consent. The participants were 14 NS without cognitive impairment (7 men, 7 women) between the ages of 72 and 88 (M = 77.0, SD = 4.4), and 12 seniors with MCI (7 men, 5 women) between the ages of 64 and 84 (M = 77.9, SD = 6.3). The NS and MCI groups did not differ in age [t(24) = 0.42, P = 0.67]. The two groups also did not differ in gender distribution [χ2(1) = 0.67, P = 0.85] or mean number of years of education (NS group: M = 16.4, SD = 2.7; MCI group: M = 15.3, SD = 1.9) [t(24) = 1.3, P = 0.20].
All participants were community‐dwelling individuals who were right‐handed, with normal or corrected‐to‐normal visual acuity. The participants were recruited from the University of Kentucky Alzheimer's Disease Center (UK‐ADC) longitudinal normal volunteer cohort. Inclusion criteria for this cohort are minimum 65 years of age, cognitive and neurological normality at enrollment, agreement to brain donation to the UK‐ADC at death, a designated informant for structured interviews, and willingness to undergo annual examinations. The participants were excluded from the cohort if they had a history of substance abuse (including alcohol), major head injury, major psychiatric illness, medical illnesses that are unstable and/or that have an effect on the CNS, chronic infectious diseases, stroke or transient ischemic attack, encephalitis, meningitis, epilepsy, parkinsonism, or other neurologic disease. The annual evaluation includes a comprehensive neuropsychological battery and general physical and neurological examinations that are detailed elsewhere [Schmitt et al., 2001].
If any of the following occurs, the subject was evaluated with a more detailed cognitive assessment and formal clinical assessment by study physicians: (i) the diagnosis from the examining physician changes to MCI or dementia; (ii) the supervising neuropsychologist suspects cognitive decline or the annual memory test scores drop below −1.5 SD cutoff from their prior annual assessment; (iii) a cholinesterase inhibitor, NMDA antagonist, or other treatment associated with the medical diagnosis of dementia by an outside physician was prescribed to the participant; or (iv) evidence of functional impairment secondary to cognitive decline was elicited from the subject or informant. The UK‐ADC consensus conference reviewed these data and a diagnosis of normal, MCI [Winblad et al., 2004], or AD [McKhann et al., 1984] was assigned. All seniors participated in this brain imaging experiment within 3 months of their diagnosis as normal or MCI.
Stimuli
Word stimuli were selected from our previous work [Gold et al., 2006]. Words were of high frequency (M = 109) [Kucera and Francis, 1967] and moderate length (M = 4.7 letters). The mean frequency and length of the target words were matched across lists. Pseudoword trials were also included to provide the “no” response for the LD tasks. Pseudoword targets were constructed by changing one or two letters of a group of word stimuli that were not used in this experiment. Pseudoword targets were matched with word targets for length.
Task Procedures
Participants were asked to decide, as quickly and accurately as possible, if letter strings were words or nonwords. Trials consisted of a target for 1,350 ms, and a fixation cross (+) for 650 ms. The experiment consisted of three separate runs, each run containing 120 trials. The order of runs was counterbalanced across participants. An event‐related design was employed including trials of interest and fixation trials (+) used for stimulus jittering. Different trial types were presented in a pseudorandom order and were separated from each other by a variable intertrial interval (range = 0–12 s, mean = 2.8 s) consisting of the fixation trials. Trial types were ordered for optimal experimental efficiency using optseq2 (http://surfer.nmr.mgh.harvard.edu/optseq/).
Stimulus presentation and recording of responses was implemented with E‐Prime software (Psychology Software Tools, Pittsburgh, PA), using an MRI‐compatible projection system (SilentVision SV‐6011 LCD; Avotec, Stuart, FL). Visual stimuli were projected onto a screen at the back of the magnet bore, viewed by subjects through a mirror mounted on the MR head coil. Stimuli were presented in black uppercase Courier font on a white background and subtended at a vertical visual angle of about 1° and an average horizontal visual angle of about 4.5° at the center of the field of view. Responses were made via button‐presses, using a fiber‐optic button‐box that registers latencies to the nearest millisecond. The reaction times (RTs) were measured from the onset of target display. Each participant's median RT was entered into statistical analyses to minimize the effect of outliers.
MRI Acquisition
MRI data were collected on a 3T Siemens Magnetom Trio MRI scanner. Foam padding was used to limit head motion within the coil. T2*‐weighted functional images were acquired using the body coil to transmit and an eight‐channel head array coil to receive. Main field B0 homogeneity was optimized at the start of each run using an automated shimming routine. Functional image runs were acquired in the transverse plane using a gradient‐echo, EPI sequence (TE = 30 ms, TR = 2,000 ms, flip angle = 77°). Thirty‐three interleaved slices were acquired (64 × 64 image matrix, 224 × 224 FOV, with isotropic 3.5‐mm voxels), covering the entire cerebrum and the upper cerebellum. A double‐echo gradient‐echo sequence (TE1 = 5.19 ms, TE2 = 7.65 ms) with slice position and spatial resolution matching those of the EPI acquisition was used to map the spatial inhomogeneity of the B0 field. A high‐resolution, 3D anatomic image was acquired using a T1‐weighted (MP‐RAGE) sequence (TR = 2,100 ms, TE = 2.93 ms, TI = 1,100 ms, flip angle = 12°, FOV = 224 × 256 × 192 mm, 1‐mm isotropic voxels, sagittal partitions) for the localization of functional activity in the stereotactic space of the Montreal Neurological Institute (MNI).
fMRI Data Analysis
fMRI data were analyzed with AFNI software [Cox, 1996]. Several preprocessing steps were employed to minimize artifacts. Following exclusion of the first few functional volumes (12 s), differences in timing between slices due to acquisition order were adjusted with sinc interpolation. Functional images were motion corrected and registered to the image collected closest in time to the high‐resolution anatomical image using a six‐parameter rigid body transformation. Images were then unwarped via B0 field maps (using FSL software; http://www.fmrib.ox.ac.uk/fsl) to reduce nonlinear magnetic field distortions. Finally, functional images were smoothed spatially with a 8‐mm FWHM isotropic Gaussian kernel and intensity normalized to yield subsequent activation measures expressed as percent signal change from baseline.
Deconvolution analysis was performed on each subject's preprocessed image time‐series to provide simultaneous parameter estimates of the hemodynamic response associated with each trial type [Glover, 1999]. The hemodynamic response was estimated at seven 2‐s time lags (0–14 s) after stimulus presentation for trials in each condition compared with baseline fixation. There were 14 regressors of interest (two trial types × seven time lags). Each regressor consisted of a series of delta functions, producing an estimate of the response to each trial type, with no assumptions about the temporal dynamics of the hemodynamic response. Nuisance regressors included in the model were each run's mean, linear trend, and six outputs from volume registration to account for residual variance from subject motion. Each subject's regressor datasets were then transformed to the standard space of the MNI, using landmarks from their anatomical datasets, and resampled at 2 mm3 resolution using cubic spline interpolation.
During second‐level analyses, group‐based, voxel‐wise t‐tests were performed on the mean of the two time points surrounding the peak activation in each condition (seconds 4–8 from the 14‐s estimated hemodynamic response). A mixed‐effect model was employed which treated condition as a fixed effect and participants as a random effect. Each group's LD trial types were first contrasted with visual fixation to identify the general network of regions involved in word recognition in each group. Monte Carlo simulations were run using AlphaSim in order to determine the number of contiguous voxels (at P < 0.001) needed to be active to achieve a corrected significance level of P < 0.05 for each group's LD fixation comparison. The Monte Carlo calculation used 104 trials and indicated a minimum cluster size of 11 contiguous active voxels at the spatial resolution of the original EPI acquisition (472 μL).
A conservative conjunction approach was then employed to explore potential between‐group differences in LD. Specifically, the comparison of each group's increased activation relative to the other group was masked by that group's own LD fixation map, and thresholded at P < 0.001. This served to screen out relative deactivations and reduce the number of multiple comparisons by searching for group differences only within regions activated within each group's general LD functional network. In addition to the main effects of group (group activation differences across word and pseudoword stimuli), potential group by stimulus interactions were explored. All between‐group activation differences meeting the significance level of P < 0.001 are presented in order to appreciate the continuity of the data and allow for future meta‐analyses. However, only clusters of ≥20 contiguous voxels are interpreted (Table I). Activation maps were projected onto semi‐inflated surfaces using Caret software [Van Essen et al., 2001].
Table I.
Activation coordinates for brain regions that showed group differences during lexical decision
| Region | ∼BA | X (mm) | Y (mm) | Z (mm) | Number of voxels |
|---|---|---|---|---|---|
| NS > MCI | |||||
| Right fusiform | 37 | 32 | −61 | −12 | 148 |
| Left fusiform | 37 | −31 | −59 | −14 | 126 |
| Left middle occipital gyrus | 19/37 | 30 | −76 | −7 | 109 |
| Left inferior frontal gyrus | 6/9 | −38 | 1 | 35 | 37 |
| Left lingual gyrus | 18 | −12 | −87 | −8 | 32 |
| MCI > NS | |||||
| Right precuneus | 7 | 24 | −71 | 31 | 41 |
| Right cingluate | 32/24 | 5 | 20 | 37 | 24 |
| Left cingulate | 24 | −2 | 13 | 36 | 20 |
NS, normal seniors; MCI, mild cognitive impairment; ˜BA, approximate Brodmann's area.
Structural Imaging Analysis
Voxel‐based morphometry (VBM) analysis was performed to determine if gray matter (GM) regions showing altered fMRI signal in the MCI group compared with the NS group also showed volumetric differences. VBM was performed using the statistical parametric mapping software package (statistical parametric map 5 [SPM5], http://www.fil.ion.ucl.ac.uk/spm) implemented in Matlab 6.5 (Math Works, Natick, MA), running on a Linux operating system.
VBM preprocessing
Preprocessing of images included segmentation, bias correction, and spatial normalization, incorporated into a single generative model [Ashburner and Friston, 2005]. Estimating the model parameters involves iteration among classification, bias correction, and normalization steps, providing improved results over previous SPM2 serial applications and obviating the need for creation of customized priors [Ashburner and Friston, 2005]. MR images were segmented into GM, white matter (WM), and cerebrospinal fluid (CSF) images using SPM5 prior probability templates. The intensity nonuniformity bias correction was applied to aid segmentation by correcting for scanner‐induced smooth, spatially varying intensity differences [Ashburner and Friston, 2005]. GM images were normalized to their own custom templates in the standard space of the MNI T1‐weighted template using a set of nonlinear basis functions. A modulation step was also incorporated into the preprocessing model to explore regional differences in absolute volume. Modulation compensates for regional adjustments to volume of certain brain regions inherent in nonlinear spatial normalization by multiplying (or modulating) voxel values in the segmented images by the Jacobian determinants derived from the spatial normalization step. Segmented images were inspected to ensure that classifications were anatomically consistent. Intracranial volume (ICV) was estimated as the sum of GM, WM, and CSF volumes for each participant (for use as a nuisance covariate in subsequent statistical analysis). As a final preprocessing step, all normalized, segmented, modulated images were smoothed with an 8‐mm FWHM isotropic Gaussian kernel.
VBM analysis
The preprocessed GM data were analyzed within the framework of the general linear model. Statistical parametric maps of differences in GM volume were determined using an analysis of covariance model with MCI versus NS as the between‐factor, and age, sex, education, and ICV as nuisance covariates. Second‐level, group linear contrasts were then conducted on parameter estimates from the model. The voxel values for the contrasts constituted an SPM of the t‐statistic. A brain mask was used to exclude voxels outside the brain. Differences between groups were assessed using the same threshold levels adopted for the fMRI data: a significance threshold of P < 0.001 (uncorrected) and a cluster threshold of 20 contiguous voxels.
ROC Analyses
The results from the combined fMRI–structural imaging analyses described above revealed alterations in MCI functional activations that did not overlap with structural changes. ROC curves were generated to explore the ability of these fMRI activations to discriminate MCI patients from NS. ROC curves were generated from logistic regression models by calculating the sensitivity and specificity of magnitudes in eight different ROIs in classifying MCI patients.
The eight ROIs explored reflected the eight regions in which between‐group differences were observed in the whole‐brain analyses (listed in Table I). Masks consisted of a three‐dimensional area including all contiguous voxels activated (P < 0.001) within 10 mm of the peak effect in the between‐group, whole‐brain comparison. These ROI masks were then applied to each subject's regressor dataset to extract the average fMRI magnitude in the LD task compared with baseline fixation. Thus, a single magnitude was extracted for each participant, for each ROI. The area under the curve (AUC) was used to assess the diagnostic accuracy of fMRI magnitudes in these eight ROIs in classifying MCI and normal individuals. A final ROC curve was generated which incorporated the two individual ROIs with the highest individual AUC (the left and right midfusiform gyri). All curves controlled for age, sex, and education level.
RESULTS
Behavioral Results
The performance measure of primary interest was accuracy. Both groups performed the LD task with very high accuracy (M of the NS group = 95%, SD = 0.04; M of the MCI group = 89%, SD = 0.64). ANOVA indicated a slight trend for higher accuracy in the NS group compared with the MCI group [F(1, 24) = 3.39, P = 0.10], and a main effect of stimulus type due to higher performance on the word stimuli than the pseudoword stimuli [F(1, 24) = 14.12, P < 0.001]. There was no group by stimulus interaction in accuracy [F(1, 24) = 2.13, P = 0.18].
As expected, RT was longer for the MCI group (M = 847 ms, SD = 164) than the NS group (M = 776, SD = 112) [F(1, 24) = 4.38, P < 0.05], and longer for pseudowords than words [F(1, 24) = 142.00, P < 0.0001]. There was no group by stimulus interaction in RT [F(1, 24) = 2.37, P = 0.14].
fMRI
Figure 1 presents activations associated with LD in each group. In NS group (top panel), LD was associated with activation of a network of regions, prominently involving occipitotemporal cortex and portions of prefrontal cortex. The MCI group (bottom panel) activated a similar network of occipitotemporal and prefrontal regions.
Figure 1.
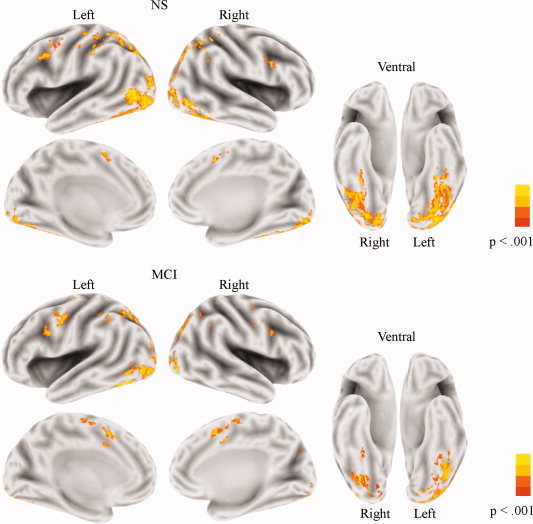
Brain activation patterns associated with lexical decision. Both the NS group (top) and the MCI group (bottom) activated a network of predominantly occipitotemporal regions, with additional activation in the frontal cortex. The level of significance is indicated by the color bar at the right side. A significance threshold of P < 0.001, corrected to P < 0.05 via cluster thresholding, was employed.
The results from the between‐group comparison of LD (across word and pseudoword stimulus types) are presented in Figure 2 and Table I. The MCI group showed reduced activation compared with the NS group in several regions of occipitotemporal cortex, with the largest activation differences centered on the fusiform gyri. The MCI group also showed reduced activation in a small portion of the left inferior frontal gyrus. In contrast, the MCI group showed increased activation compared with the NS group in bilateral portions of the anterior cingulate and the right precueus. No group (NS versus MCI) by stimulus (word versus pseudoword) fMRI interactions were observed.
Figure 2.

Between‐group differences in lexical decision activation. Warm colors (red–yellow) indicate regions showing increased activation in the NS group and cold colors (blue) indicate regions showing increased activation in the MCI group. The level of significance is indicated by the color bar at the right side. A significance threshold of P < 0.001 was employed, masked by activations in the lexical decision fixation comparison presented in Figure 1.
Structural Imaging
Several between‐group regional volume differences were observed (Fig. 3 and Table II). Specifically, the MCI group showed decreased volume compared with the NS group in bilateral portions of the hippocampi and two portions of the right parahippocampal gyrus. When a liberal, uncorrected significance level of P < 0.01 was adopted, MCI volumetric reductions were still confined to MTL regions (results not shown).There were no regions in which the NS showed decreased volume compared with the MCI group at either significance level.
Figure 3.
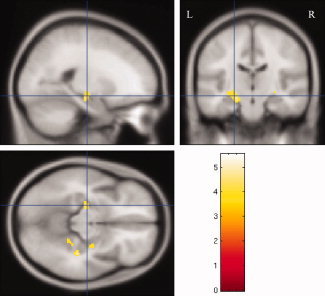
Regions of significantly smaller volume in the MCI group compared with the NS group. Maps depict volumetric differences on the canonical MNI T1 template after global intracranial differences have been removed. The intersection position of the cross lines is centered on the largest volumetric cluster, within the left hippocampus. The color bar presents t‐values of the clusters. A significance threshold of P < 0.001 (uncorrected) was employed.
Table II.
Regions of smaller volume in the mild cognitive impairment group compared with the normal seniors group
| Region | X (mm) | Y (mm) | Z (mm) | t‐value | Number of voxels |
|---|---|---|---|---|---|
| Left hippocampus | −27 | −16 | −14 | 4.57 | 102 |
| Right parahippocampal gyrus | 30 | −38 | −8 | 4.22 | 53 |
| Right parahippocampal gyrus | 34 | −32 | −14 | 5.31 | 40 |
| Right hippocampus | 28 | −12 | −13 | 3.75 | 30 |
ROC Analyses
The AUC was 0.87 for the left midfusiform gyrus (mid‐FFG) ROI and 0.83 for the right midfusiform ROI. None of the other ROIs had an AUC above 0.70. When the curve incorporated both the left and right mid‐FFG ROIs, the AUC improved to 0.93 (see Fig. 4). For this bilateral mid‐FFG curve, the sensitivity was 0.91 and specificity was 0.93. Adding other ROIs to this model did not improve the AUC.
Figure 4.

Receiver operator characteristic curve. The area under the curve (AUC) for a model combining the left and right mid‐FFG fMRI magnitudes during lexical decision. This bilateral mid‐FFG model was highly accurate in discriminating individuals with MCI from NS, with an AUC of 0.93.
DISCUSSION
The results demonstrated that fMRI activation is altered in neocortical regions involved in LD in MCI. In particular, the activation in mid‐FFG is decreased in MCI, and the reduced strength of this activation distinguishes MCI patients from NS with a high degree of accuracy. Atrophy was not detectible in regions activated during the LD task but was instead found elsewhere, in MTL. This atrophy pattern is in agreement with several previous studies of MCI. The observed functional anatomic findings could not be accounted for by age, sex, handedness, or education level. Below we discuss these findings in more detail and consider their implications for understanding the neurobiological basis of MCI.
Behavioral results indicated that MCI performance on the LD task was highly accurate (mean = 89% correct). There was, however, a slight trend (P = 0.10) for reduced LD accuracy in the MCI group compared with the NS group (mean = 95% correct). These behavioral data are consistent with previous results, suggesting that LD is generally preserved in MCI, although small accuracy reductions compared with NS are evident [Bush et al., 2007; Duong et al., 2006]. Both groups showed fMRI activation of a network of occipitotemporal regions and inferior frontal cortex. However, compared with the NS group, the MCI group showed reduced fMRI activation in several occipitotemporal regions and in a small portion of left inferior prefrontal cortex. Because performance on the LD is generally intact in MCI, but impaired in AD [Bush et al., 2007; Duong et al., 2006], the observed fMRI reductions in MCI may reflect functional anatomic precursors of impending LD performance impairment.
In contrast to the observed fMRI reductions in occipitotemporal and inferior frontal cortices, the MCI group showed increased activation relative to the NS group in bilateral portions of the anterior cingulate cortex and the right precuneus. These regions form part of a network involved in a broad range of visual attention processes [Cavanna and Trimble, 2006]. Given that increased activation in AD has been linked with compensatory processes [Grady et al., 2003], one interpretation of these functional increases is that the MCI group requires a greater contribution from attention systems than the NS group in order to maintain high performance on the LD task. An increased contribution from regions associated with general attention processes during LD in the MCI group, along with longer RT of this group, may reflect an attempt at compensation for the decreased contribution of occipitotemporal regions linked with linguistic components of visual word recognition.
A VBM analysis was conducted to determine if alterations in MCI functional activations overlapped with regions showing macroscopic structural changes. The results demonstrated that none of the neocortical regions showing altered fMRI signal in the MCI group showed reduced volume. Instead, volumetric reduction in the MCI group was observed in MTL regions. Specifically, MCI showed volumetric reductions in the hippocampus bilaterally and right parahippocampal gyrus. Our VBM results are consistent with previous reports of MTL volumetric reductions in MCI [Chetelat et al., 2002; Karas et al., 2004; Killiany et al., 2002] and pre‐MCI states [Martin et al., 2008; Smith et al., 2007]. These results suggest that functional alterations can be observed in MCI in occipitotemporal regions and inferior frontal cortex before macroscopic structural decline in these regions.
The potential sensitivity of between‐group fMRI activation differences in the ability to discriminate individuals with MCI from NS was considered using ROC curves. Our results are very encouraging in this regard. After controlling for age, sex, and education level, fMRI signal amplitude in the left mid‐FFG differentiated the MCI and NS groups with 87% accuracy. fMRI signal amplitude in the right mid‐FFG differentiated the MCI and NS groups with 83% accuracy. Combining the left and right mid‐FFG regions into a single model improved the discriminatory accuracy to 93%. The combined mid‐FFG activation model resulted in the misclassification of only one participant from each group. Addition of other ROIs associated with group activation differences in the cingulate gyrus, inferior frontal cortex, and occipital cortex did not improve the model's accuracy.
It is relevant to consider why activation magnitude in mid‐FFG was more accurate in classifying MCI patients than activation in other neocortical regions involved in the present LD task. There may be at least two reasons. The first reason may relate to the LD task employed. The chances of detecting reduced fMRI activation in a specific region in a patient group will of course be maximized if that region is prominently activated in the control group during the task being imaged. In LD, mid‐FFG is one of the most strongly activated regions in healthy adults, across studies using a variety of baseline control tasks [Hart et al., 2000; Madden et al., 2002; Price et al., 1994; Rumsey et al., 1997]. Mid‐FFG is likely to play a central role in LD, given that this region is thought to represent a converge zone, allowing for the integration of phonologic, semantic, and lexical codes [Buchel et al., 1996]. In addition, results from fMRI studies of priming suggest that one function of the mid‐FFG appears to relate to accessing stored lexical–semantic information in both young adults [Gold et al., 2006; Wheatley et al., 2005] and NS [Gold et al. (2009)].
A second reason for the high accuracy achieved by mid‐FFG magnitude in classifying MCI patients is likely that this region is affected by accumulating pathology earlier in the course of AD than other regions in the LD functional activation network. This suggestion is consistent with results from previous studies that have separately explored brain function or structure in MCI. For example, perfusion and functional neuroimaging studies have reported reduced activation of posterior ventral temporal cortex, including mid‐FFG, in MCI/mild AD and in normal individuals at genetic risk for AD [Caroli et al., 2007; Smith et al., 1999; Zahn et al., 2004]. In addition, early in the course of AD, both pathology and volumetric reduction are more prominent in ventral temporal cortex than occipital and frontal cortices [Brun and Englund, 1981; Busatto et al., 2003; Convit et al., 1997; Giannakopoulos et al., 1999]. Of particular relevance, Convit et al. [1997] found that, although volumetric reductions present in MCI were confined to MTL regions, the most salient additional reductions at the time of AD diagnosis reduction were in the fusiform gyrus. Together, these data suggest that the ventral temporal cortex may undergo pathological changes in MCI that can cause synaptic dysfunction detectable with fMRI, prior to imminent macroscopic changes in AD that are detectable with structural imaging.
Although the reduced functional response in ventral temporal cortex in the MCI group was not associated with macroscopic volumetric reduction in this region, we cannot rule out the possibility that this functional reduction was indirectly influenced by MTL atrophy. For example, dense connections between parahippocampal gyrus and fusiform gyrus have been observed in humans [Powell et al., 2004]. The fact that the parahippocampal gyrus and other MTL regions do not prominently contribute to the LD task does not necessarily exclude the possibility that potential reductions in MTL‐fusiform functional connectivity could contribute to a decreased mid‐FFG response in MCI. For example, some MTL regions could potentially modulate ventral temporal activations during LD via back projections. This issue deserves future study through correlation analysis between fMRI and diffusion tensor tractography data.
The identification of functional alterations that precede frank task impairment and rely on brain regions that are not significantly atrophied in MCI may have implications for monitoring the effectiveness of emerging therapeutic interventions. For example, Saykin et al. [2004] found that short‐term treatment with a cholinesterase inhibitor enhanced the activation of frontal response in MCI patients and their performance on a working memory task. The functional neuroanatomic enhancement effects were relatively specific to frontal cortex. However, such findings present hope that emerging therapies may be able to restore the functional response in other neocortical regions, prior to task impairment. For example, therapies that could restore or prevent further brain activation reduction in MCI patients associated with LD may prevent frank lexical–semantic performance declines before they occur in AD.
This study has several limitations. First, fMRI is susceptible to signal losses near air/tissue interfaces. Consequently, activations in some brain regions may have been missed in this study. Second, like most other normal control volunteer groups at AD centers, participants were highly educated. Future studies will be required to determine the extent to which the present and similar findings generalize to cohorts with lower levels of education. Our ADC is currently in the process of attempting to recruit lower education volunteers in the normal control cohort to address this question. Third, as with all cross‐sectional studies of MCI, we were not able to confirm that all MCI participants will develop AD. Although most individuals given a clinical diagnosis of MCI at our center show AD pathology [Markesbery et al., 2006], it was not possible to know what percentage of the present MCI or normal samples harbor significant AD pathology. Some misclassification of participants (according to the neuropathology gold standard) is thus possible. This issue should be addressable in the future because participants in the longitudinal normal cohort study at our ADC have agreed to brain donation at death.
In conclusion, our results demonstrate that LD‐fMRI activation is altered in MCI in a network of neocortical regions. This altered fMRI activation in neocortical regions in MCI was observed prior to impending neocortical structural atrophy and task impairment associated with AD. Within the network of activation changes observed in MCI, reduced response in ventral temporal mid‐FFG was of particular functional significance because this pattern served to distinguish individuals with MCI from NS with a high degree of accuracy. The future refinement of activation paradigms capable of detecting fMRI changes before task impairment has the potential to contribute to the objective assessment of AD risk and progression.
Acknowledgements
The authors thank Rickey Pack for help with data collection and Dr. David Powell for technical support.
REFERENCES
- Ashburner J, Friston KJ ( 2005): Unified segmentation. Neuroimage 26: 839–851. [DOI] [PubMed] [Google Scholar]
- Brun A, Englund E ( 1981): Regional pattern of degeneration in Alzheimer's disease: Neuronal loss and histopathologic grading. Histopathology 5: 549–564. [DOI] [PubMed] [Google Scholar]
- Buchel C, Price C, Friston K ( 1996): A multimodal language region in the ventral visual pathway. Nature 394: 274–277. [DOI] [PubMed] [Google Scholar]
- Busatto GF, Garrido GE, Almeida OP, Castro CC, Camargo CH, Cid CG, Buchpiguel CA, Furuie S, Bottino CM ( 2003): A voxel‐based morphometry study of temporal lobe gray matter reductions in Alzheimer's disease. Neurobiol Aging 24: 22–31. [DOI] [PubMed] [Google Scholar]
- Bush ALH, Allen PA, Kaut KP, Ogrocki PK ( 2007): Influence of mild cognitive impairment on visual word recognition. Aging Neuropsychol Cogn 14: 329–352. [DOI] [PubMed] [Google Scholar]
- Caroli A, Testa C, Geroldi C, Nobili F, Barnden L, Guerra UP, Bonetti M, Frisoni GB ( 2007): Cerebral perfusion correlates of conversion to Alzheimer's disease in amnestic mild cognitive impairment. J Neurol 254: 1698–1707. [DOI] [PubMed] [Google Scholar]
- Cavanna AE, Trimble MR ( 2006): The precuneus: A review of its functional anatomy and behavioral correlates. Brain 129: 564–583. [DOI] [PubMed] [Google Scholar]
- Chertkow H, Black S ( 2007): Imaging biomarkers and their role in dementia clinical trials. Can J Neurol Sci 34( Suppl 1): S77–S83. [DOI] [PubMed] [Google Scholar]
- Chetelat G, Desgranges B, De La Sayette V, Viader F, Eustache F, Baron JC ( 2002): Mapping gray matter loss with voxel‐based morphometry in mild cognitive impairment. Neuroreport 13: 1939–1943. [DOI] [PubMed] [Google Scholar]
- Chong MS, Sahadevan S ( 2005): Preclinical Alzheimer's disease: Diagnosis and prediction of progression. Lancet Neurol 4: 576–579. [DOI] [PubMed] [Google Scholar]
- Chong MS, Lim WS, Sahadevan S ( 2006): Biomarkers in preclinical Alzheimer's disease. Curr Opin Investing drugs 7: 600–607. [PubMed] [Google Scholar]
- Convit A, De Leon MJ, Tarshish C, De Santi S, Tsui W, Rusinek H, George A ( 1997): Specific hippocampal volume reductions in individuals at risk for Alzheimer's disease. Neurobiol Aging 18: 131–138. [DOI] [PubMed] [Google Scholar]
- Cox RW ( 1996): AFNI: Software for analysis and visualization of functional magnetic resonance neuroimages. Comput Biomed Res 29: 162–173. [DOI] [PubMed] [Google Scholar]
- de Leon MJ, Desanti S, Zinkowski R, Mehta PD, Pratico D, Segal S, Clark C, Kerkman D, DeBernardis J, Li J, Lair L, Reisberg B, Tsui W, Rusinek H ( 2004): MRI and CSF studies in the early diagnosis of Alzheimer's disease. J Intern Med 256: 205–223. [DOI] [PubMed] [Google Scholar]
- Dickerson BC, Salat DH, Bates JF, Atiya M, Killiany RJ, Greve DN, Dale AM, Stern CE, Blacker D, Albert MS, Sperling RA ( 2004): Medial temporal lobe function and structure in mild cognitive impairment. Ann Neurol 56: 27–35. [DOI] [PMC free article] [PubMed] [Google Scholar]
- Dickerson BC, Salat DH, Greve DN, Chua EF, Rand‐Giovannetti E, Rentz DM, Bertram L, Mullin K, Tanzi RE, Blacker D, Albert MS, Sperling RA ( 2005): Increased hippocampal activation in mild cognitive impairment compared to normal aging and AD. Neurology 65: 404–411. [DOI] [PMC free article] [PubMed] [Google Scholar]
- Duong A, Whitehead V, Hanratty K, Chertkow H ( 2006): The nature of lexico‐semantic processing deficits in mild cognitive impairment. Neuropsychologia 44: 1928–1935. [DOI] [PubMed] [Google Scholar]
- Flicker G, Ferris S, Reisberg B ( 1991): Mild cognitive impairment in the elderly: Predictors of dementia. Neurology 41: 1006–1009. [DOI] [PubMed] [Google Scholar]
- Giannakopoulos P, Gold G, Duc M, Michel JP, Hof PR, Bouras C ( 1999): Neuroanatomic correlates of visual agnosia in Alzheimer's disease: Clinicopathologic study. Neurology 52: 71–77. [DOI] [PubMed] [Google Scholar]
- Glover GH ( 1999): Deconvolution of impulse response in event‐related BOLD fMRI. Neuroimage 9: 416–429. [DOI] [PubMed] [Google Scholar]
- Gold BT, Rastle K ( 2007): Neural correlates of morphological decomposition during visual word recognition. J Cogn Neurosci 19: 1983–1993. [DOI] [PubMed] [Google Scholar]
- Gold BT, Balota DA, Jones SJ, Powell DK, Smith CD, Andersen AH ( 2006): Dissociation of automatic and strategic lexical‐semantics: Functional magnetic resonance imaging evidence for differing roles of multiple frontotemporal regions. J Neurosci 26: 6523–6532. [DOI] [PMC free article] [PubMed] [Google Scholar]
- Gold BT, Andersen AH, Jicha GA, Smith CD ( 2009): Aging influences the neural correlates of lexical decision but not automatic semantic priming. Cerebral Cortex 19: 2671–2679. [DOI] [PMC free article] [PubMed] [Google Scholar]
- Grady CL, McIntosh AR, Beig S, Keightley ML, Burian H, Black SE ( 2003): Evidence from functional neuroimaging of a compensatory prefrontal network in Alzheimer's disease. J Neurosci 23: 986–993. [DOI] [PMC free article] [PubMed] [Google Scholar]
- Gray JR, Chabris CF, Braver TS ( 2003): Neural mechanisms of general fluid intelligence. Nat Neurosci 6: 316–322. [DOI] [PubMed] [Google Scholar]
- Hart J Jr, Kraut MA, Kremen S, Soher B, Gordon B ( 2000): Neural substrates of orthographic lexical access as demonstrated by functional brain imaging. Neuropsychiatry Neuropsychol Behav Neurol 13: 1–7. [PubMed] [Google Scholar]
- Jack CR Jr, Petersen RC, Xu YC, Waring SC, O'Brien PC, Tangalos EG, Smith GE, Ivnik RJ, Kokmen E ( 1997): Medial temporal atrophy on MRI in normal aging and very mild Alzheimer's disease. Neurology 49: 786–794. [DOI] [PMC free article] [PubMed] [Google Scholar]
- Jauhiainen AM, Pihlajamaki M, Tervo S, Niskanen E, Tanila H, Hanninen T, Vanninen RL, Soininen H ( 2009): Discriminating accuracy of medial temporal lobe volumetry and fMRI in mild cognitive impairment. Hippocampus 19: 166–175. [DOI] [PubMed] [Google Scholar]
- Jicha GA, Parisi JE, Dickson DW, Johnson K, Cha R, Ivnik RJ, Tangalos EG, Boeve BF, Knopman DS, Braak H, Petersen RC ( 2006): Neuropathologic outcome of mild cognitive impairment following progression to clinical dementia. Arch Neurol 63: 674–681. [DOI] [PubMed] [Google Scholar]
- Karas GB, Scheltens P, Rombouts SA, Visser PJ, van Schijndel RA, Fox NC, Barkhof F ( 2004): Global and local gray matter loss in mild cognitive impairment and Alzheimer's disease. Neuroimage 23: 708–716. [DOI] [PubMed] [Google Scholar]
- Killiany RJ, Hyman BT, Gomez‐Isla T, Moss MB, Kikinis R, Jolesz F, Tanzi R, Jones K, Albert MS ( 2002): MRI measures of entorhinal cortex vs hippocampus in preclinical AD. Neurology 58: 1188–1196. [DOI] [PubMed] [Google Scholar]
- Kucera H, Francis WN ( 1967): Computational Analysis of Present‐Day American English. Providence, RI: Brown University Press. [Google Scholar]
- Madden DJ, Langley LK, Denny LL, Turkington TG, Provenzale, JM , Hawk TC, Coleman RE ( 2002): Adult age differences in visual word identification: Functional neuroanatomy by positron emission tomography. Brain Cogn 49: 297–321. [DOI] [PMC free article] [PubMed] [Google Scholar]
- Markesbery WR, Schmitt FA, Kryscio RJ, Davis DG, Smith CD, Wekstein DR ( 2006): Neuropathologic substrate of mild cognitive impairment. Arch Neurol 63: 38–46. [DOI] [PubMed] [Google Scholar]
- Martin SB, Smith CD, Collins HR, Schmitt FA, Gold BT ( 2008): Evidence that volume of anterior medial temporal lobe is reduced in seniors destined for mild cognitive impairment. Neurobiol Aging. [DOI] [PMC free article] [PubMed] [Google Scholar]
- McKhann G, Drachman D, Folstein M, Katzman R, Price D, Stadlan EM ( 1984): Clinical diagnosis of Alzheimer's disease: Report of the NINCDS‐ADRDA Work Group under the auspices of Department of Health and Human Services Task Force on Alzheimer's Disease. Neurology 34: 939–944. [DOI] [PubMed] [Google Scholar]
- Morris JC, Storandt M, Miller JP, McKeel DW, Price JL, Rubin EH, Berg L ( 2001): Mild cognitive impairment represents early‐stage Alzheimer disease. Arch Neurol 58: 397–405. [DOI] [PubMed] [Google Scholar]
- Petersen RC, Smith GE, Waring SC, Ivnik RJ, Tangalos EG, Kokmen E ( 1999): Mild cognitive impairment: Clinical characterization and outcome. Arch Neurol 56: 303–308. [DOI] [PubMed] [Google Scholar]
- Petersen RC, Parisi JE, Dickson DW, Johnson KA, Knopman DS, Boeve BF, Jicha GA, Ivnik RJ, Smith GE, Tangalos EG, Braak H, Kokmen E ( 2006): Neuropathologic features of amnestic mild cognitive impairment. Arch Neurol 63: 665–672. [DOI] [PubMed] [Google Scholar]
- Powell HW, Guye M, Parker GJ, Symms MR, Boulby P, Koepp MJ, Barker GJ, Duncan JS ( 2004): Noninvasive in vivo demonstration of the connections of the human parahippocampal gyrus. Neuroimage 22: 740–747. [DOI] [PubMed] [Google Scholar]
- Price CJ, Wise RJ, Watson JD, Patterson K, Howard D, Frackowiak RS ( 1994): Brain activity during reading: The effects of exposure duration and task. Brain 117: 1255–1269. [DOI] [PubMed] [Google Scholar]
- Rumsey JM, Horwitz B, Donohue BC, Nace K, Maisog JM, Andreason P ( 1997): Phonological and orthographic components of word recognition. Brain 120: 739–759. [DOI] [PubMed] [Google Scholar]
- Rypma B, D'Esposito M ( 1999): The roles of prefrontal brain regions in components of working memory: Effects of memory load and individual differences. Proc Natl Acad Sci USA 96: 6558–63. [DOI] [PMC free article] [PubMed] [Google Scholar]
- Schmitt FA, Wetherby MM, Wekstein DR, Dearth CM, Markesbery WR ( 2001): Brain donation in normal aging: Procedures, motivations, and donor characteristics from the Biologically Resilient Adults in neurological Studies. Gerontologist 41: 716–722. [DOI] [PubMed] [Google Scholar]
- Small SA ( 2005): Alzheimer disease, in living color. Nat Neurosci 8: 404–405. [DOI] [PubMed] [Google Scholar]
- Smith CD ( 2007): Mild cognitive impairment is too late: The case for presymtomatic detection and treatment for Alzheimer's disease. Cogn Sci 3: 127–177. [Google Scholar]
- Smith CD, Andersen AH, Kryscio RJ, Schmitt FA, Kindy MS, Blonder LX, Avison JM ( 1999): Altered brain activation in cognitively intact individuals at high risk for Alzheimer's disease. Neurology 53: 1391–1396. [DOI] [PubMed] [Google Scholar]
- Smith CD, Chebrolu H, Wekstein DR, Schmitt FA, Jicha GA, Cooper G, Markesbery WR ( 2007): Brain structural alterations before mild cognitive impairment. Neurology 68: 1268–1273. [DOI] [PubMed] [Google Scholar]
- Van Essen DC, Dickson J, Harwell J, Hanlon D, Anderson CH, Drury HA ( 2001): An integrated software system for surface‐based analyses of cerebral cortex. J Am Med Informat Assoc 41: 1359–1378. [DOI] [PMC free article] [PubMed] [Google Scholar]
- Wheatley T, Weisberg J, Beauchamp MS, Martin A ( 2005): Automatic priming of semantically related words reduces activity in the fusiform gyrus. J Cogn Neurosci 17: 1871–1885. [DOI] [PubMed] [Google Scholar]
- Winblad B, Palmer K, Kivipelto M, Jelic V, Fratiglioni L, Wahlund LO, Nordberg A, Bäckman L, Albert M, Almkvist O, Arai H, Basun H, Blennow K, de Leon M, DeCarli C, Erkinjuntti T, Giacobini E, Graff C, Hardy J, Jack C, Jorm A, Ritchie K, van Duijn C, Visser P, Petersen RC ( 2004): Mild cognitive impairment—beyond controversies, towards a consensus: Report of the International Working Group on Mild Cognitive Impairment. J Intern Med 256: 240–246. [DOI] [PubMed] [Google Scholar]
- Zahn R, Juengling F, Bubrowski P, Jost E, Dykierek P, Talazko J, Huell M ( 2004): Hemispheric asymmetries of hypometabolism associated with semantic memory impairment in Alzheimer's disease: A study using positron emission tomography with fluorodeoxyglucose‐F18. Psychiatry Res 132: 159–172. [DOI] [PubMed] [Google Scholar]