

Abstract
The role of the distal histidine in regulating ligand binding to adult human hemoglobin (HbA) was re-examined systematically by preparing His(E7) to Gly, Ala, Leu, Gln, Phe, and Trp mutants of both Hb subunits. Rate constants for O2, CO, and NO binding were measured using rapid mixing and laser photolysis experiments designed to minimize autoxidation of the unstable apolar E7 mutants. Replacing His(E7) with Gly, Ala, Leu, or Phe causes 20–500-fold increases in the rates of O2 dissociation from either Hb subunit, demonstrating unambiguously that the native His(E7) imidazole side chain forms a strong hydrogen bond with bound O2 in both the α and β chains (ΔGHis(E7)H-bond ≈ −8 kJ/mol). As the size of the E7 amino acid is increased from Gly to Phe, decreases in kO2′, kNO′, and calculated bimolecular rates of CO entry (kentry′) are observed. Replacing His(E7) with Trp causes further decreases in kO2′, kNO′, and kentry′ to 1–2 μm−1 s−1 in β subunits, whereas ligand rebinding to αTrp(E7) subunits after photolysis is markedly biphasic, with fast kO2′, kCO′, and kNO′ values ≈150 μm−1 s−1 and slow rate constants ≈0.1 to 1 μm−1 s−1. Rapid bimolecular rebinding to an open α subunit conformation occurs immediately after photolysis of the αTrp(E7) mutant at high ligand concentrations. However, at equilibrium the closed αTrp(E7) side chain inhibits the rate of ligand binding >200-fold. These data suggest strongly that the E7 side chain functions as a gate for ligand entry in both HbA subunits.
Keywords: Methods/FTIR, Oxygen/Binding, Protein/Heme, Protein/Ligand Binding, Hemoglobin, Oxygen Transport, Hemoglobin, Hydrogen Bonding, Laser Photolysis, Ligand Pathway
Introduction
In 1970, Perutz (1) proposed that the distal histidines located at the E7 helical positions,3 αHis-58 and βHis-63, play crucial structural roles for regulating both the affinities and rates of O2 binding to adult human hemoglobin (HbA).4 These ideas were based on the suggestion by Pauling (2) that His(E7) could stabilize bound O2 by donating a hydrogen bond to the partial negative charge on the superoxide-Fe(III)-like FeO2 complex and on the idea by Perutz and Mathews (3) that the distal histidine could also be acting as gate for ligand entry and exit. Studies of model heme compounds and naturally occurring globins with His(E7) replacements suggested strongly that the distal histidine also plays a key role in discrimination between O2 and CO binding (4–9).
The first mutagenesis studies on sperm whale Mb and human HbA reported that His(E7) to Gly mutations in α subunits and Mb cause marked increases in the rates of O2 dissociation and significant decreases in affinity, both of which indicate strong stabilization of the FeO2 complex by proton donation from the wild-type His(E7) side chain (7, 10, 11). In addition, the association rate constants for O2 and CO binding increased 5–10-fold. The latter results were interpreted in terms of the distal histidine gate mechanism, with the His(E7) to Gly mutation resulting in an open E7 channel. In contrast, neither the dissociation nor association rate constants for O2 binding to the R state βGly(E7) mutant of HbA appeared to increase significantly, implying no electrostatic stabilization of bound ligands by the native His(E7) in β subunits and an already open gate or alternative pathway. These surprising kinetic results were explained by the first high resolution structure of human oxyhemoglobin published by Shaanan (12), in which the NϵH atoms of distal histidine in β subunits seemed to be further away from the bound O2 atoms and pointing toward the heme plane.
Between 1989 and 1999, our group and others constructed large libraries of mammalian Mb mutants as a model system for understanding the structural mechanisms of ligand binding to vertebrate globins involved in O2 transport and storage. A detailed molecular mechanism for O2 binding has emerged. Ligand entry into myoglobin occurs through the distal histidine gate; hydrogen bond donation by the neutral NϵH tautomer of His(E7) regulates oxygen affinity, and electrostatic stabilization of bound oxygen represents the main determinant of discrimination between O2 and CO binding (13–18). During the same 10-year period, Champion and co-workers (19–21) came to similar conclusions when examining opening of the E7 channel by protonation of His(E7) in Mb. Their conclusions were verified by the low pH crystallographic studies of Yang and Phillips (22).
Similar mechanisms have been proposed to occur in the α and β subunits of HbA. However, the experimental evidence has been weak, due in part to the technical difficulties of generating large mutant Hb libraries, assigning rate and spectral parameters to the individual subunits within mutant/wild-type hybrid tetramers, and working with distal histidine mutants, which are highly unstable with respect to autoxidation, hemin loss, and denaturation (see Refs. 23, 24).
In 2000, Ho and co-workers (25) used heteronuclear NMR spectra of chain-selectively labeled samples to show that the Nϵ and not the Nδ atoms of the His(E7) imidazole rings are protonated and capable of donating hydrogen bonds to bound O2 in both the α and β subunits of HbO2. In 2006, Tame and co-workers (26) reported a new high resolution crystal structure (1.25 Å) of HbAO2. The distances between Nϵ of His(E7) and bound O2 in this structure are 2.6 and 3.0 Å in the α and β subunits, respectively. These structural observations indicate significant hydrogen bonding with bound ligands in both subunits, a result that is at odds with the lack of effect of the βHis(E7) to Gly mutation reported 20 years ago (11, 27).
To resolve the question of hydrogen bonding in β subunits and test the E7 gate hypothesis in HbA systematically, we constructed His(E7) to Gly, Ala, Leu, Gln, Phe, and Trp mutations in both genes of recombinant human hemoglobin, expressed wild-type/mutant hybrids, and isolated individual mutant subunits to verify assignments of kinetic and spectral properties within the initial tetramers. New methods were designed to measure rate constants for O2, CO, and NO binding under conditions that avoid autoxidation of these unstable mutants. The new kinetic results show unambiguously that bound O2 is stabilized by hydrogen bonding in both subunits of human hemoglobin and that ligands appear to enter each Hb subunit through the distal histidine gate.
EXPERIMENTAL PROCEDURES
Preparation of Recombinant Hemoglobin Mutants
All of the wild-type and mutant recombinant human hemoglobins were expressed and isolated using the plasmid, fermentation, and purification systems developed at Somatogen, Inc. (28), as described in supplemental Section A. In these recombinant Hbs, the N-terminal Val codons in both α- and β-globins are replaced by the initiator Met codon to yield the α(V1M)/β(V1M) double mutant. This wild-type recombinant Hb control has R state rate parameters that are virtually identical to those of native R state HbA (28). The Leu(E7) mutants were also expressed from the pHE2 plasmid designed by Ho and co-workers (29, 30) to examine the effects of the V1M mutation (see supplemental Table S1). Individual α and β mutants were separated and isolated using procedures initially developed by Parkhurst and Parkhurst (31) (see supplemental Section A).
Kinetic Measurements of O2, CO, and NO Binding
Parameters for O2 binding to the Hb E7 mutant tetramers and monomers were measured using laser flash photolysis of the stable HbCO complex in O2/CO mixtures to avoid prolonged exposure to oxygen and autoxidation (32). Descriptions of the 0.5-μs dye laser system and sample preparations are given in supplemental Section B.
In these experiments, the reaction is started by photolyzing HbCO to generate a deoxyHb species that can then react with the ligands present in solution (Scheme 1 and Fig. 1A). Two distinct phases are observed after photolysis. The initial fast phase represents bimolecular ligand binding with the transient deoxyHb species. The observed rate (kfast, Equation 1) is dominated by O2 binding because in most cases kO2′ > kCO′ (where kO2′ and kCO′ are CO and O2 association rate constants) (33). The slow replacement phase represents the displacement of transiently bound O2 by CO, and robs (Equation 2) is determined by the rate of O2 dissociation attenuated by the relative rates of O2 versus CO association. The bimolecular binding reaction is best observed at 436 nm, which is near the peak of deoxyHb, and the replacement reaction is best observed at 425 nm, near the peak for HbCO.
 |
SCHEME 1.
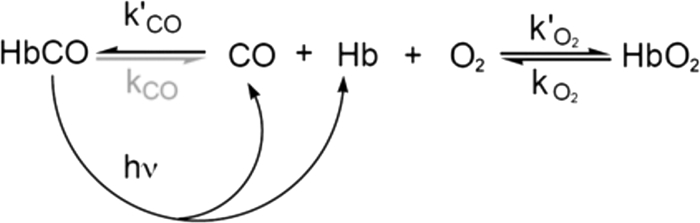
FIGURE 1.

Time courses for O2 binding to and displacement from isolated human Ala(E7) αCO subunits at pH 7. 4, 20 °C. A, reactions were carried out in buffers equilibrated with 1 atm of O2 and air, and no free CO, until after photolysis of the αCO sample. The time courses were fitted to single exponential expressions with an offset representing the 1,000-fold slower CO replacement reaction. B, time courses for the slower replacement reaction measured at 425 nm at 4 different [O2]/[CO] ratios. The amplitude of the slow phase decreases as [CO]/[O2] increases because CO begins to compete with O2 in the initial association reaction. C, dependence of the observed replacement rate on [CO]/[O2] and fits to Equation 2.
Partial photolysis (≤10% of the total absorbance change obtained for complete photolysis) was used for mutant/wild-type hybrid HbCOs to ensure that only rebinding to the R state tetramers was being examined. Full photolysis was used for isolated subunits, which are intrinsically in an R state-like conformation (see Fig. 1). The value of kCO′ was determined in a separate experiment by photolyzing HbCO in the presence of 1 mm CO with a small amount of dithionite added to eliminate residual oxygen and when necessary at various [CO] values. The slow rate for O2 displacement by CO was measured at 425 nm after 100% photolysis for both tetramers and monomers because, on these time scales, all Hb tetramers have either 3 or 4 ligands bound and remain in the R quaternary state (24, 33, 34).
The rate constants for CO dissociation from mutant Hb tetramers and monomers were determined by rapidly mixing the HbCO complexes with excess NO. Under these conditions, the observed rate for displacement of CO by NO equals kCO (where kCO is the carbon monoxide dissociation rate constant) (supplemental Section B) (33).
NO binding to the wild-type and mutant HbA samples was measured using a flow-flash system to allow initiation of the reaction by photolysis of FeCO complexes, which have quantum yields for photodissociation of CO into solvent of 0.4 to 1.0. In these experiments, a sample of HbCO is rapidly mixed with concentrated NO and then photodissociated 50 ms after flow stopped with a 0.5-μs excitation pulse (supplemental Section B). Bimolecular NO binding to the newly generated deoxyHb is followed at 436 nm. As shown in Scheme 2, the observed rate, kobs, is given by kNO′[NO] + kCO′[CO] ≈ kNO′[NO] (where kNO′ is the nitric oxide association rate constant), because the concentration of CO was kept low (∼50 μm) and kNO′ > kCO′ for all the samples examined. The rates of NO binding to HbA are roughly independent of quaternary state (35), and the observed rates of NO binding are linearly dependent on [NO] with an intercept effectively equal to 0 and a slope equal to kNO′ (see Fig. 5).
SCHEME 2.
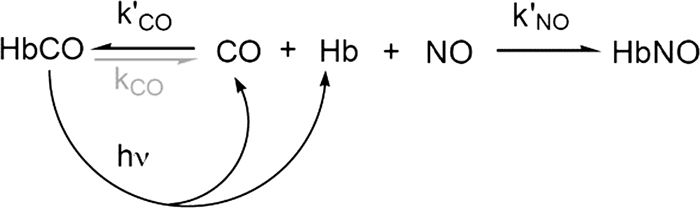
FIGURE 5.

NO binding to E7 mutants of HbA subunits. A, time courses for NO binding to isolated native α and β chains. HbCO samples (∼25 μm, after mixing) were rapidly mixed with NO (1000 μm in final reaction mixture) and then photolyzed ∼50 ms after flow stopped with a 500-ns dye laser pulse. Bimolecular NO binding was observed at 436 nm, and the time courses were normalized by the absorbance change immediately before and after photolysis. The offset after the reaction is complete represents the difference in absorbance between the final product HbNO and the starting HbCO sample. The open circles and open squares represent native α and β subunits, respectively. The black lines represent fits to single exponential expressions for the isolated α (kobs = 28,000 s−1) and β (kobs = 68,000 s−1) subunits. The inset shows the dependence of the observed pseudo first order rate constants of native α and β subunits and HbA tetramers on [NO]. The observed rates show a straight line dependence with a y-intercept equal to 0 because the NO dissociation rate constant is on the order of 10−4 s−1 (13). The open symbols in the inset correspond to the rates for isolated subunits, and the closed symbols represent the rates for the fast (β) and slow (α) HbA phases. The slopes represent the kNO′ values, which are given in Table 3. B, comparison of calculated rates of CO entry with the bimolecular rate constants measured for NO binding to recombinant Hb. Data were taken from Table 3. The closed and open circles represent isolated α and β subunit rate constants, respectively, and the open and closed triangles represent values for the closed α and slowly reacting βTrp(E7) conformers.
FTIR Measurements and Geminate Recombination for HbCO Complexes
Vibrational spectra for the bound C-O stretch were measured as described in supplemental Section C. Time courses for geminate CO recombination within isolated native, wild-type, and mutant Hb subunits were measured after photolysis with a 7-ns YAG laser. Complete descriptions of the instrument and experiments are given in supplemental Section D.
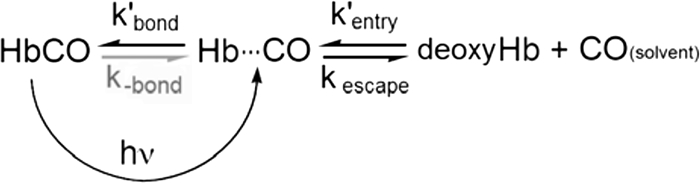
Geminate CO recombination in the individual α and β Hb subunits appears to be a simple first order process. A two-step binding scheme was assumed for analysis and involves internal bond formation between the ligand and the iron atom (kbond) and ligand escape (kescape) from or bimolecular return (kentry′) to the geminate state (Hb···CO) in Scheme 3. The rate parameters for these processes define the observed rates (kgem, Equation 4) and fractions (Fgem, Equation 3) of geminate recombination and the overall bimolecular association rate constants (kX′, Equation 5) (18, 36):
 |
 |
SCHEME 3.
RESULTS
Effects of E7 Mutations on O2 Association
In the past, O2 binding to hemoglobin was measured after flash photolysis of HbO2 complexes. This approach is difficult when examining distal histidine mutants because of the following: 1) the quantum yield for complete photodissociation of O2 into solvent is inherently small, ≤0.1, and decreases even further when His(E7) is replaced with an apolar amino acid; 2) the E7 apolar mutants autoxidize rapidly with half-lives ranging from a few minutes to less than 1 h; and 3) complete removal of CO from His(E7) mutants is very difficult because these variants have KCO/KO2 ratios in the range 4000–40,000 (where KCO is the carbon monoxide affinity constant and KO2 is the oxygen affinity constant). For example, CO can only be removed from Leu(E7) mutants by oxidation with ferricyanide under an intense light, and then the oxygenated complex has to be generated by reduction with dithionite in air followed by gel filtration to rapidly remove excess reducing agent.
We have addressed the photodissociation yield, autoxidation, and CO removal problems by examining O2 binding and release starting with HbCO complexes in mixtures of O2 and CO. Direct comparisons between our new data and older rate constant determinations are given in supplemental Section E and supplemental Table 1S.
Time courses for bimolecular O2 binding to isolated subunits in photolysis experiments with HbCO are shown in Fig. 2 for the complete set of E7 mutations. Similar experiments were carried out with hybrid tetramers at 10% photolysis. In the case of hybrid tetramers, the observed time courses were fitted to two exponential expressions, one for the wild-type subunit and one for the mutant subunit (34, 37). Although physiologically more relevant, the assignment of the phases to α and β subunits within Hb tetramers can be ambiguous, whereas the assignment of rate parameters is straightforward for isolated α and β chains. In some cases, the monomeric subunits do show slightly different ligand binding properties from those of the corresponding subunits in heterotetramers, but these differences are always small (≤2-fold, Table 1) (23).
FIGURE 2.

Bimolecular binding of O2 to native and E7 mutants of isolated α and β subunits of recombinant human HbA. In these experiments, ∼50 μm HbCO was photolyzed with a 0.5-μs dye laser excitation pulse in a mixture of 625 μm O2 and 500 μm CO in 0.1 m phosphate buffer, pH 7.0, or 50 mm HEPES, 0.1 m NaCl, 0.1 mm EDTA, pH 7.4, 20 °C (no differences were observed between these conditions for isolated subunits and R state tetramers in partial photolysis or replacement experiments). Under these conditions, the observed first order rate constant, kobs, equals kO2′[O2] + kO2 + kCO′ [CO] and, in most cases, is dominated by O2 binding. Bimolecular binding was monitored at 436 nm, and the time courses were normalized from the absorbance changes for the fast bimolecular phases for ease of comparison between the mutants. A, time courses for bimolecular O2 binding to mutant α subunits, where E7 refers to position 58; B, time courses for O2 binding to mutant β subunits, where E7 refers to position 63.
TABLE 1.
Rate and equilibrium constants for O2 binding to R state native HbA, mutant hybrid tetramers, and isolated mutant subunits with E7 substitutions
Conditions were 0.1 m phosphate buffer, pH 7.0, or 50 mm HEPES, 0.1 m NaCl, 0.1 mm EDTA, pH 7.4, 20 °C. Rates of bimolecular O2 binding and first order displacement were measured after laser flash photolysis in O2/CO mixtures. Oxygen association/dissociation rate constants were obtained by fitting sets of observed kfast and kslow as a function of [O2] and [CO] using Equations 1 and 2. Equilibrium association constants were calculated as KO2 = kO2′/kO2. The superscripts M and T refer to isolated monomers or WT/mutant hybrid tetramers, respectively.
| Subunit | kO2′ | kO2 | KO2 | Subunit | kO2′ | kO2 | KO2 |
|---|---|---|---|---|---|---|---|
| μm−1s−1 | s−1 | μm−1 | μm−1s−1 | s−1 | μm−1 | ||
| αGly(E7)M | 250 | 540 | 0.45 | βGly(E7)M | 160 | 680 | 0.24 |
| αGly(E7)T | 190 | 500 | 0.38 | βGly(E7)T | 95 | 310 | 0.31 |
| αAl▵E7)M | 160 | 880 | 0.18 | βAl▵E7)M | 120 | 860 | 0.14 |
| αAl▵E7)T | 170 | 320 | 0.53 | βAl▵E7)T | 120 | 520 | 0.23 |
| αLeu(E7)M | 91 | 450 | 0.2 | βLeu(E7)Ma | 110 | 4600 (40%) 630 (60%) | 0.02 0.18 |
| αLeu(E7)T | 100 ± 60 | 680 ± 180 | 0.14 ± 0.10 | βLeu(E7)T | 110 ± 23 | 600 ± 170 | 0.18 ± 0.1 |
| αGln(E7)M | 43 | 42 | 1.0 | βGln(E7)M | 70 | 26 | 2.7 |
| αGln(E7)T | 35 | 86 | 0.41 | βGln(E7)T | 72 | 42 | 1.7 |
| α NativeM | 40 ± 2 | 22 ± 6 | 2.5 ± 1.2 | β NativeM | 63 ± 12 | 16 ± 1.6 | 2.3 ± 1.0 |
| α NativeT | 32 ± 4.1 | 13 ± 2.9 | 2.6 ± 0.4 | β NativeT | 82 ± 15 | 28 ± 6.1 | 3.1 ± 1.0 |
| α WTM | 40 | 16 | 2.5 | β WTM | 52 | 14 | 3.7 |
| α WTT | 29 ± 11 | 14 ± 8 | 1.9 ± 0.5 | β WTT | 60 ± 12 | 31 ± 13 | 3.9 ± 0.6 |
| αPhe(E7)Mb | 51 (63, 28) | 9800 (13,500, 6600) | 0.0052 | βPhe(E7)Mb | 25 (13, 36) | 2400 (3500, 1900) | 0.01 |
| αPhe(E7)T | 47 | 3500 | 0.013 | βPhe(E7)T | 33 | 1700 | 0.02 |
| αTrp(E7)M | 210 | 450 | 0.47 | βTrp(E7)M | 1.7 | 190 | 0.009 |
| ∼0.5c | 0.001c | ||||||
| αTrp(E7)T | 260 | 940 | 0.27 | βTrp(E7)T | 4.1 | 200 | 0.02 |
a The replacement reactions for isolated Leu(E7) β subunits showed two measurably different phases, whereas the βLeu(E7)/WT mutant tetramers showed only one phase. The relative amplitudes of the two phases for the βLeu(E7) monomer O2 dissociation traces are given in parentheses.
b Although fits to a single exponential function are satisfactory approximations, the observed time courses for O2 binding to and dissociation from isolated α- and βPhe(E7) chains are slightly biphasic, and calculated kO2′ and kO2 values for each phase are presented in parentheses. We could only resolve one phase for the same mutants in hybrid tetramers. Because the heterogeneity was not dramatic (≤2–3-fold), we used the single values for the Phe(E7) monomers in all remaining analyses.
c The fast phases for bimolecular O2 binding to the αTrp(E7) monomer in the O2/CO mixtures appeared monophasic. Slow O2 binding to a closed conformer, similar to that seen for CO binding to this mutant (Fig. 3), is obscured in the oxygen binding experiments because the slow displacement phase (HbO2 + CO → HbCO + O2) occurs on roughly the same time scale. A slow bimolecular O2 binding phase was observed when we prepared oxygenated αTrp(E7) subunits in 1 atm of O2 and examined rebinding using the 0.5-μs dye laser system without any displacement phase. In this case, we observed a very small slow phase that suggested a bimolecular rate constant of ∼0.5 μm−1 s−1, which was similar in magnitude to that observed in the CO binding experiments. This rate constant was assigned to O2 binding to a closed αTrp(E7) conformer. The oxygen affinity of the closed conformer (KO2) was estimated as the ratio of the closed kO2′ value and kO2 from the replacement analysis.
A summary of the data for both isolated subunits and R state hybrid tetramers is given in Table 1. In β subunits, the rate constant for bimolecular O2 binding decreases significantly with increasing size of the E7 amino acid, from 160 μm−1 s−1 for βGly(E7) to 1.7 μm−1 s−1 for βTrp(E7) (Fig. 2B and Table 1). This dramatic ∼100-fold decrease strongly supports the idea that His(E7) is acting as a gate for ligand entry into β subunits. As expected, the His(E7) to Gln mutation has little effect on the association rate constants for O2 binding because it is similar in size and polarity to the wild-type histidine.
The results for α subunits are more complex. The value of kO2′ for αGly(E7) subunits in either R state tetramers or isolated subunits is also very large, 200–250 μm−1 s−1, and decreases as the amino acid size is increased from Ala to Leu to Phe and His(E7). The value of kO2′ for native αHis(E7) subunits is 35 μm−1 s−1 (Fig. 2A and Table 1).
The αPhe(E7) mutant binds O2 slightly more rapidly than the wild-type α subunit (∼50 versus ∼35 μm−1 s−1, respectively), even though the phenyl ring is bigger than the imidazole ring. This difference can be explained by the presence of a water molecule hydrogen-bonded to His(E7) in wild-type deoxy α subunits (26). Distal pocket water must be displaced from the active site of wild-type α chains before ligands can enter the heme pocket and coordinate to the iron atom. The distal pockets of Phe(E7) mutants are presumed to be anhydrous, and the only hindrance to binding is the large aromatic side chain of the E7 residue. The smaller kO2′ value for wild-type α subunits indicates that water displacement offers a larger barrier to ligand binding in this subunit than the benzyl side chain. In the case of the βPhe(E7) mutant, the value of kO2′ is 2-fold smaller than that for wild-type β subunits (∼30 μm−1 s−1 versus ∼ 60 μm−1 s−1, respectively). In this case, the lower rate of the mutant subunit is explained by the larger size of the Phe(E7) side chain because no water molecule is present in the distal pocket of native deoxy β subunits or, if present, is highly disordered and easily displaced (26).
The most remarkable result in Fig. 2A and Table 1 is the rapid rate of bimolecular O2 binding to the photolyzed αTrp(E7) mutant in either monomers or tetramers. The observed rate constant is 200–250 μm−1 s−1 for αTrp(E7), which is ∼5 times larger than kO2′ for wild-type α subunits and identical to that for the αGly(E7) and αAla(E7) mutants, in which the E7 gate is completely open. This result suggests that the indole side chain of αTrp(E7) adopts an outward pointing conformation when a ligand is bound and, after photolysis, cannot rotate back into the E7 channel on the time scales for bimolecular O2 binding. In contrast, O2 binding to photolyzed βTrp(E7) mutants is slow, indicating rapid relaxation of the indole ring into the E7 channel after photolysis of bound CO.
Bimolecular CO Binding and Movement of Trp(E7)
Time courses for bimolecular CO binding to mutant and native isolated α and β subunits are shown in Fig. 3, and fitted values of kCO′ are given in Table 2. The bimolecular rate constants for CO binding to isolated α and β subunits also decrease with increasing size for the Gly, Ala, Leu, and His series, from 50–100 to ∼5–10 μm−1 s−1. Again, CO binds slightly faster to the αPhe(E7) mutant than to the WT subunit (∼5.5 versus 4.5 μm−1 s−1), whereas the opposite order is observed for βPhe(E7) and WT subunits, presumably because of water in the distal pocket of unliganded wild-type α but not β subunits.
FIGURE 3.

Time courses for bimolecular CO binding to wild-type and E7 mutants of isolated human HbA subunits after laser photolysis. A, CO binding to mutant α subunits, and B, CO binding to mutant β subunits, both at [CO] = 1000 μm (1 atm). C, CO binding to isolated αTrp(E7) subunits at four different [CO] labeled beside each time course. The observed bimolecular rates for the fast phases of the reactions were as follows: 16,500 s−1, 50 μm CO; 46,000 s−1, 350 μm CO; 90,000 s−1, 750 μm CO; and 125,000 s−1, 1000 μm CO. The subunit concentration was 50 μm. D, more detailed comparison between the time courses for bimolecular CO binding to monomeric α- and βTrp(E7) mutants on both long and short time scales at [CO] = 1000 μm. Buffer conditions were the same as in Fig. 2. Several crystals of sodium dithionite were added into each cuvette to scavenge any residual O2.
TABLE 2.
Rate and equilibrium constants for bimolecular CO binding to native HbA, mutant hybrid tetramers, and isolated mutant subunits with E7 substitutions
Conditions were the same as in Table 1. The pseudo first order rate of CO association was measured after laser flash photolysis of 50 μm Hb at 1 atm CO (∼1000 μm), and this datum along with the fast and slow rates observed in the O2/CO mixture experiments were fitted simultaneously to obtain kCO′ (kO2′ and kO2) values. CO dissociation rate constants were measured independently by mixing HbCO in anaerobic buffer with 1 atm NO (∼2000 μm) in a stopped-flow spectrophotometer. CO equilibrium association constants for the R state, KCO, were calculated from kCO′/kCO. The superscripts M and T refer to isolated monomers or WT/mutant hybrid tetramers, respectively.
| Subunit | kCO′ | kCO | KCO | Subunit | kCO′ | kCO | KCO |
|---|---|---|---|---|---|---|---|
| μm−1 s−1 | s−1 | μm−1 | μm−1 s−1 | s−1 | μm−1 | ||
| αGly(E7)M | 100 | 0.013 | 7700 | βGly(E7)M | 40 | 0.016 | 2500 |
| αGly(E7)T | 77 | 0.0078 | 9900 | βGly(E7)T | 53 | 0.0084 | 6300 |
| αAl▵E7)M | 93 | 0.014 | 6600 | βAl▵E7)M | 64 | 0.012 | 5300 |
| αAl▵E7)T | 90 | 0.0096 | 9400 | βAl▵E7)T | 48 | 0.01 | 4800 |
| αLeu(E7)M | 53 | 0.0027 | 20,000 | βLeu(E7)Ma | 24 | 0.0056 | 4300 |
| αLeu(E7)T | 22 | 0.0019 | 12,000 | βLeu(E7)T | 29 | 0.0014 | 21,000 |
| αGln(E7)M | 6.3 | 0.0071 | 890 | βGln(E7)M | 10 | 0.0082 | 1200 |
| αGln(E7)T | 4.8 | 0.011 | 440 | βGln(E7)T | 13 | 0.0056 | 2300 |
| α NativeM | 5.2 ± 0.5 | 0.016 ± 0.003 | 330 ± 100 | β NativeM | 11 ± 3.3 | 0.010 ± 0.001 | 1100 ± 240 |
| α NativeTa | 2.9 ± 0.5 | 0.005 ± 0.002 | 600 ± 260 | β NativeTa | 7.1 ± 2.4 | 0.007 ± 0.003 | 1000 ± 550 |
| α WTM | 5.5 | 0.014 | 390 | β WTM | 7.2 | 0.0094 | 740 |
| α WTT | 4.0 ± 1.1 | 0.011 ± 0.004 | 360 ± 200 | β WTT | 7.1 ± 2.0 | 0.008 ± 0.001 | 890 ± 440 |
| αPhe(E7)Mb | 5.7 (3.5, 7.5) | 0.041 | 140 | βPhe(E7)Mb | 3.9 (1.8, 6) | 0.012 | 330 |
| αPhe(E7)T | 5.1 | 0.028 | 180 | βPhe(E7)T | 3.9 | 0.012 | 330 |
| αTrp(E7)Mc | 125 (77%) | 0.008 | 16,000 | βTrp(E7)Mc | 150 (≤15%) | ||
| 0.11 (23%) | 14 | 0.7 (70%) | 0.0037 | 190 | |||
| 0.08 (15%) | 22 | ||||||
| αTrp(E7)T | 53 | 0.0048 | 11,000 | βTrp(E7)T | 1.3 | 0.0058 | 220 |
a Rates for native tetrameric subunits were taken from Mathews et al. (11). A summary of these values is given in supplemental Table 1S.
b The observed time courses for CO binding to isolated α- and βPhe(E7) chains were slightly biphasic and analyzed by one and two exponential expressions. We used the single exponential fits in our analyses, and the results of the two exponential analyses are given in parentheses. Note that the differences between fast and slow rate parameters were not dramatic (≤2–3).
c The traces for CO rebinding to the monomeric Trp(E7) mutants contain at least two phases. For α subunits, the fraction of the fast phase is large in 1000 μm CO (77%), but the slow phase becomes dominant at low [CO] (Fig. 3). For β subunits, there is predominantly one phase (∼70%), which is relatively slow (kCO′ = 0.7 μm−1 s−1), and the parameter for this phase was used in further analyses. However, both very small, ultrafast, and ultraslow phases were detected. The ultrafast phase occurs on time scales similar to the major phase for bimolecular CO binding to αTrp(E7) subunits but can only be detected at the highest CO concentrations and was not analyzed further. The slow phase could be analyzed and gave the apparent bimolecular rate constant and amplitude shown.
The time courses for CO binding to the α- and βTrp(E7) mutants demonstrate the complexity implied in the results for O2 binding. Binding to αTrp(E7) subunits at a high ligand concentration (i.e. 1000 μm, see Fig. 3A) is dominated by a rapid bimolecular phase, which defines a kCO′ value equal to ∼120 μm−1 s−1 based on the dependence of kobs,fast on [CO]. However, a slow phase is clearly present, even at 1000 μm CO. When [CO] is decreased from 1000 to 50 μm in laser photolysis experiments, the fraction of the fast phase decreases from 77 to ∼20% (Fig. 3C). In the case of partial photolysis experiments with mutant hybrid tetramers, multiple phases are also seen but are almost impossible to resolve because of the presence of CO binding to wild-type subunits.
The slow phases in Fig. 3C for isolated αTrp(E7) subunits indicate a bimolecular rate constant of 0.11 μm−1 s−1 based on the dependence of the observed pseudo first order rate on [CO]. The presence of such a phase in the O2 binding experiments in O2/CO mixtures is obscured by the O2 replacement phase, which occurs on similar time scales. To look for this phase, we prepared a fully oxygenated sample of isolated αTrp(E7) subunits in the absence of CO and measured bimolecular O2 binding after laser photolysis of HbO2 samples. Two phases for bimolecular O2 rebinding were observed, and kO2′ values for the fast and slow phases were calculated to be 230 and 0.5 μm−1 s−1 (see Table 1). The latter rate constant is similar to the kCO′ value obtained from the slow phases shown in Fig. 3C.
All of these results suggest that the indole side chain of αTrp(E7) adopts an outward “open” conformation when ligands are bound. This conformation persists on microsecond time scales after photodissociation. The fast bimolecular phases after photodissociation represent O2 and CO binding before the indole side chain has moved back into the E7 channel. The slow phases represent ligand binding to the equilibrium conformational state of the α-deoxyHb mutant, in which the indole side chain fills the E7 channel and blocks ligand entry. Rotation of the indole side chain into the entry channel occurs at a rate that competes with bimolecular CO binding to the open conformation (∼104–105 s−1). When the external [CO] is high, ligand binding to the open conformer dominates, whereas at low [CO] the opposite is true.
In β subunits, Trp(E7) relaxation after complete photodissociation must be greater than ∼105 s−1 because only a small rapid bimolecular phase (∼150 μm−1 s−1, <15%) is observed at the highest CO concentration and is difficult to define (Fig. 3, B and D, inset). The majority of the bimolecular βTrp(E7) CO rebinding phase is slow with kCO′ equal to ∼0.7 μm−1 s−1 (70%). A small third phase is seen on longer time scales with a rate similar to that for αTrp(E7) subunits, ∼0.08 μm−1 s−1 (15%), indicating that slow relaxation to an even more blocked and hindered conformation occurs in β subunits.
This competition between Trp(E7) relaxation and ligand rebinding after photolysis in α subunits is similar to the competition between bimolecular ligand rebinding and internal His(E7) coordination that is seen after photolysis of the CO and O2 complexes of nonsymbiotic plant Hbs and neuroglobins. These globins are hexacoordinate in their equilibrium deoxyHb states (38–41). Tian et al. (20) observed a similar competition between both geminate and bimolecular CO rebinding and inward relaxation of His(E7) at low pH values where the imidazole side chain is in the protonated open conformation when ligands are bound and in the deprotonated closed state when the heme is unliganded.
Determination of Rate Constants for Ligand Entry into α- and β-E7 Mutants
Two other sets of experiments were carried out to verify that the E7 mutations are directly affecting the rate of ligand entry into hemoglobin. Internal CO geminate recombination was examined on nanosecond time scales to determine the fraction of geminate recombination and to estimate rates of internal ligand bond formation and escape using Equations 3–5. CO is the ligand of choice for hemoglobin subunits, because the quantum yield for formation of the initial CO geminate state is close to unity, and the observed rate of geminate CO recombination, 2–70 μs−1, is readily measured on nanosecond time scales. Geminate O2 rebinding to α and β chains in the R state is too rapid to measure readily with a 7-ns YAG laser pulse and exhibits a quantum yield of ≤0.2 for formation of the first geminate state (27). The rates of CO entry and exit appear to be the same as those for O2 and NO because all three diatomic gases have almost the same size and polarity (17, 18, 36, 42). The major differences are the iron coordination rates, kbond, with NO ≫ O2 > CO (36, 43, 44).
Time courses for geminate CO rebinding to isolated α- and β-E7 mutants are shown in Fig. 4. As in the case of Mb, the dependence of geminate recombination on the size of the E7 residue is complex (17, 45–47). Replacement of His(E7) with Gly, Ala, and Leu increases the fraction of internal recombination (Fgem) by removal of steric hindrance for ligand return to the iron atom, which results in 5–10-fold increases in kbond with little change in the computed rate constant for escape (Table 3) (45, 48). In contrast, the extents of geminate recombination in the wild-type, Gln(E7), and Phe(E7) subunits are all small values. As in Mb, the His(E7) and Gln(E7) side chains are close enough (≤3 Å) to donate hydrogen bonds to bound ligands, but this proximity results in steric hindrance of the initial photodissociated ligand, pushing it back into the distal pocket, inhibiting its return to the iron atom, and causing both kbond and Fgem to be small (45, 49). The same steric effect appears to occur for the Phe(E7) mutants.
FIGURE 4.

Geminate CO recombination in wild-type and E7 mutants of isolated α and β subunits of recombinant human HbA. In these experiments, ∼50 μm HbCO was photolyzed with a 7-ns Nd:YAG laser excitation pulse (at time 0.0) in 1000 μm CO. Buffer conditions were the same as in Fig. 2. Geminate recombination was monitored at 436 nm, and the absorbance changes were normalized for comparison between the mutants. Time courses were fitted to single exponential expressions; Fgem is calculated as (total ΔA436 − offset)/(total ΔA436); kgem is equal to the observed rate of the first order internal rebinding phase. A, time courses for geminate CO recombination to mutant α subunits, where E7 refers to position 58; B, time courses for geminate CO recombination to mutant β subunits, where E7 refers to position 63.
TABLE 3.
Rate constants for bimolecular CO and NO binding and parameters for CO geminate recombination to isolated α- and βE7 mutants
kNO′tetr represents NO binding to mutant subunits within Hb tetramers. All other parameters presented are for ligand binding to isolated subunits, and the various geminate parameters were computed as described under “Experimental Procedures” using Scheme 3 and Equations 3–5. Native α and β subunits have His(E7). Conditions were the same as in Table 1. ND means not determined.
| Subunit | kCO′ | Fgem | kgem | kbond | kescape | kentry′ | kNO′ | kNO′tetr |
|---|---|---|---|---|---|---|---|---|
| μm−1s−1 | μs−1 | μs−1 | μs−1 | μm−1s−1 | μm−1s−1 | μm−1s−1 | ||
| αGly(E7) | 100 | 0.63 | 25 | 17 | 8.6 | 150 | 170 | 140 |
| αAl▵E7) | 93 | 0.57 | 37 | 21 | 16 | 160 | 150 | 160 |
| αLeu(E7) | 53 | 0.66 | 45 | 30 | 16 | 80 | 82 | 64 |
| αGln(E7) | 6.3 | 0.23 | 22 | 5.1 | 17 | 27 | 45 | 42 |
| α Native | 5.2 | 0.14 | 24 | 3.4 | 21 | 36 | 31 | 25 |
| αPhe(E7) | 5.7 | 0.13 | 69 | 8.9 | 60 | 44 | 94 | 71 |
| αTrp(E7)a | 125 (77%) | 0.77 | 67 | 52 | 15 | 160 | 150 | ND |
| 0.11 (23%) | 0.14 | ∼0.4 | ||||||
| βGly(E7) | 40 | 0.45 | 20 | 9 | 11 | 89 | 140 | 120 |
| βAl▵E7) | 64 | 0.39 | 16 | 6.4 | 9.6 | 160 | 170 | 130 |
| βLeu(E7) | 24 | 0.55 | 14 | 7.7 | 6.3 | 44 | 91 | 68 |
| βGln(E7) | 10 | 0.22 | 6 | 1.3 | 4.7 | 45 | 69 | 63 |
| β Native | 9.2 | 0.22 | 7.6 | 1.7 | 6 | 42 | 68 | 66 |
| βPhe(E7) | 3.9 | 0.14 | 37 | 5.2 | 32 | 28 | 53 | 44 |
| βTrp(E7)a | 150 (<15%) | 250 | ||||||
| 0.7 (70%) | 0.61 | 70 | 43 | 27 | 1.2 | 5.4 | 6.4 | |
| 0.08 (15%) | 0.13 |
a The values of kentry′ for the Trp(E7) mutants were calculated using the single Fgem value listed in column 3 and the kCO′ values for all the observed phases.
The rate constant for ligand entry, kentry′, into the individual subunits of Hb, kentry′, is calculated empirically as the observed bimolecular rate constant divided by the experimentally determined fraction of internal recombination (kentry′ = kCO′/Fgem, Equation 5), regardless of the number of steps in the mechanism. Unlike the values of kbond and kescape, which assume only a two-step mechanism, kentry′ is relatively model independent (17). Our calculations assume that there are no CO geminate phases that cannot be observed on nanosecond time scales. Ultrafast picosecond processes do not occur for native HbCO and its subunits (27), and although they cannot be ruled out, we did not observe any significant decreases in nanosecond yields of photodissociation for the His(E7) variants.
As shown in Table 3, there is a general decrease in kentry′ with increasing size of the E7 amino acid. Again, the results for the Trp(E7) mutants warrant more careful consideration. In the case of α subunits, the large fractions of geminate rebinding and values for kbond almost certainly represent geminate CO recombination in an open conformation with the indole side chain pointing outward and with little or no steric hindrance near the iron atom. These parameters in combination with the rate for the fast bimolecular CO binding phase predict that kentry′ for the open conformation is ∼160 μm−1 s−1, which is similar to that for αGly(E7) and close to the diffusion limit, ∼200–500 μm−1 s−1, which is observed for pentacoordinate model hemes ((50, 51) and hemoglobins with unhindered active sites (i.e. leghemoglobins (52) and Cerebratulus lacteus mini-globin (32)). However, when αTrp(E7) relaxes to its equilibrium deoxyHb conformation, the rate of entry is markedly reduced, with a computed value of kentry′ ≈ 0.14 μm−1 s−1. In the case of isolated βTrp(E7) subunits, both slow phases for bimolecular CO binding after laser photolysis predict small values for kentry′ (Table 3).
To verify the kentry′ calculations based on CO kinetics, we measured the bimolecular association rate constants for NO binding to both mutant monomers and tetramers. Many workers have shown that the fraction of geminate recombination of NO in mammalian Hbs and Mbs is ≥0.99, with bond re-formation occurring on picosecond time scales (45, 47, 53) due to the high reactivity of the NO radical with high spin ferrous iron. In terms of Equation 5, Fgem ≈ 1.0 and kentry′ = kNO′. In the case of Mb, Scott et al. (17) showed that the rate constants for ligand entry computed from analysis of geminate and bimolecular O2 binding correlate linearly with the corresponding association rate constants for NO binding to ∼30 different mutants.
Time courses for NO binding to native α and β subunits are shown in Fig. 5A; summaries of all the bimolecular NO rate constants are listed in Table 3; and a strong linear correlation between kNO′ and the kentry′ values calculated from CO binding data is observed (Fig. 5B). These results confirm the following: 1) the ∼2-fold greater rate of ligand association with native β subunits than with α subunits; 2) the ∼200-fold decrease in the bimolecular rate constant for ligand entry in HbA with increasing size of the E7 side chain; and 3) the competition between αTrp(E7) relaxation to the closed conformation and ligand binding from solvent. In the latter case, two phases are observed for bimolecular NO binding to isolated αTrp(E7) subunits, with the dependence on [NO] suggesting fast and slow kNO′ values ≈150 and 0.4 μm−1 s−1, respectively. The slow phase kNO′ value is similar to that obtained from the slow phases for O2 and CO bimolecular binding to αTrp(E7) mutants (Tables 1 and 2).
Rate Constants for O2 and CO Dissociation from the α- and β-E7 Mutants
Rate constants for O2 dissociation were obtained by analyzing the slow phase time courses for the displacement of transiently bound O2 by CO after laser photolysis of the CO complexes of both isolated chains and mutant/wild-type recombinant HbA tetramers in O2/CO mixtures (Equations 1 and 2 and see Fig. 1). Sample time courses are shown in Fig. 6, and fitted kO2 (where kO2 is the oxygen dissociation rate constant) values for R state HbA are listed in Table 1.
FIGURE 6.

Time courses for O2 replacement by CO in native and E7 mutant α and β subunits. The solutions contained a mixture of 625 μm O2 and 500 μm CO. Buffer conditions were the same as in Fig. 2. Absorbance changes were detected at 425 nm and normalized for comparison between the mutants. In these experiments, HbO2 is transiently formed after photolysis of HbCO with a 0.5-μs dye laser pulse, and then O2 is slowly displaced by CO present in the solution. Only the slow O2 replacement phase of the reaction is shown, and for these time courses, the observed first order rate constant, robs, equals kO2/(1 + kO2′[O2]/kCO′ [CO]). A, O2 dissociation from α subunits, where E7 refers to position 58; B, O2 dissociation from α subunits, where E7 refers to position 63.
Replacement of His(E7) with apolar amino acids causes marked 20–500-fold increases in the rate of O2 dissociation from both subunits. As expected, the conservative His(E7) to Gln mutations cause the least effect, 2–4-fold increases in kO2, whereas the Phe(E7) mutations cause the largest increases, from ∼20 s−1 in WT HbO2 to ∼2,400 s−1 in βPhe(E7) chains and 9,800 s−1 in αPhe(E7) chains (Table 1). Similar trends were observed for the corresponding mutant subunits in hybrid tetramers, although the numerical values are almost always smaller.
The results for the Gly, Ala, and Leu(E7) mutations show that hydrogen bonding to the native His(E7) side chain stabilizes bound O2 roughly 20–30-fold in both subunits. In the case of βLeu(E7), heterogeneous O2 displacement time courses are observed for isolated mutant subunits but not in hybrid tetramers (Fig. 6 and Table 1). This heterogeneity for isolated Leu(E7) β subunits was verified in two independent preparations and does not depend on subunit concentration, ruling out differences between β monomers and tetramers (see supplemental material).
The much greater increase in kO2 observed for the Phe(E7) mutants suggests direct hindrance by the benzyl side chain, causing a greater rate of thermal bond disruption (k−bond in Scheme 3) and restriction of ligand return to the iron atom after dissociation. This interpretation is supported by the low fractions of geminate ligand rebinding to the Phe(E7) mutants (Fig. 4 and Table 3).
The rate constants for O2 dissociation from the Trp(E7) mutants are smaller than those for the Phe(E7) mutants and more similar to those of the other apolar mutants. Presumably, the indole ring cannot be accommodated in the active site when a ligand is bound and, in the “out” conformation, cannot directly clash with the bound ligand. In addition, the large indole ring may also block ligand exit from the distal pocket, even in the out conformation. Both of these effects increase geminate recombination and lower overall rates of ligand dissociation (see Fig. 4).
Rate constants for CO dissociation from isolated chains and intact tetramers are listed in Table 2. Unlike O2 dissociation, there is only a small variation in kCO, from ∼0.04 to 0.002 s−1 for the His(E7) mutants, with the native value of kCO being ∼0.01 s−1 for both subunits. There is little change in the rate of CO dissociation for the Gly and Ala(E7) mutations, but a 5-fold decrease in kCO is observed for both Leu(E7) mutations, giving these mutants unusually high affinities as has been observed for Leu(E7) mutants in several different mammalian Mbs (Table 3) (13, 14).
FTIR Spectroscopy
To confirm electrostatic stabilization of bound O2 by His(E7), we measured the C-O stretching frequencies of bound CO, νC-O, for the complete series of mutant subunits (Fig. 7 and Table 4). Many authors have shown that the positive electrostatic field from the NϵH atoms of His(E7) causes lower νC-O values for MbCO and HbCO complexes and that this parameter increases upon replacing the E7 residue with nonpolar amino acids (14, 21, 44, 54–57).
FIGURE 7.

FTIR spectra of wild-type and E7 mutants of human HbA. Buffer conditions were the same as in Fig. 2. A, spectra for wild-type HbA (solid black) and mutant hybrid Hb tetramers (solid spectra represent Hb tetramers containing mutant α chains; dashed spectra represent Hb tetramers containing mutant β chains). B, spectra of isolated native and mutant α (solid) and β (dashed) subunits.
TABLE 4.
Bound C-O stretching frequency peaks, νC-O, for WT and mutant α and β subunits of native and recombinant human hemoglobin
Conditions were the same as in Table 1. The superscripts M and T refer to isolated monomers or WT/mutant hybrid tetramers, respectively.
| Subunit | νC–O | Subunit | νC–O |
|---|---|---|---|
| cm−1 | cm−1 | ||
| α NativeM | 1950 | β NativeM | 1950 |
| α NativeT | 1950 | β NativeT | 1950 |
| α WTM | 1950 | β WTM | 1951 |
| α WTT | 1950 | β WTT | 1951 |
| αGln(E7)M | 1945,1950 | βGln(E7)M | 1950 |
| αGln(E7)T | 1945,1951 | βGln(E7)T | 1950 |
| αGly(E7)T | 1965,1973 | βGly(E7)T | 1965,1971 |
| αAl▵E7)M | 1972 | βAl▵E7)M | 1971 |
| αAl▵E7)T | 1971 | βAl▵E7)T | 1969 |
| αLeu(E7)M | 1969 | βLeu(E7)M | 1970 |
| αLeu(E7)T | 1969 | βLeu(E7)T | 1970 |
| αPhe(E7)M | 1967 | βPhe(E7)M | 1967 |
| αPhe(E7)T | 1967 | βPhe(E7)T | 1967 |
| αTrp(E7)M | 1970 | βTrp(E7)M | 1969 |
| αTrp(E7)T | 1970 | βTrp(E7)T | 1969 |
Representative FTIR spectra for wild-type and mutant hybrid tetramers in the region of the C-O stretching frequency (1900–2000 cm−1) are shown in Fig. 7A, and spectra for isolated Hb subunits with His (native), Phe, and Trp residues at the E7 position are shown in Fig. 7B. The values of the corresponding peak maxima for all the distal His mutants are summarized in Table 4. Mutation of His(E7) to apolar amino acids in HbA causes shifts of the νC-O peak, from 1950 cm−1 for wild-type and native subunits to ∼1970 cm−1 for the mutant subunits, both as monomers and in tetramers.
The FTIR spectra of the Gly(E7) mutants show a much broader high frequency peak, which in α subunits is clearly split into two peaks. The crystal structure of Gly(E7) metMb shows discrete distal pocket water molecules in positions similar to those of the Nδ and Nϵ atoms of His(E7) in the wild-type protein (46). Thus, multiple electrostatic fields exerted by different water conformers give rise to broadening and splitting of all the Gly(E7) mutant νC-O peaks. As expected, replacing His(E7) with Gln does not significantly change the position of the IR band. However, in both subunits, the peak is broader than that of wild-type protein, indicating greater conformational heterogeneity of the amide side chain. In the case of the αGln(E7) mutant subunits, a low frequency shoulder is observed at 1945 cm−1, implying a small fraction of a conformer with a more positive field near bound CO than that in native α subunits containing His(E7) (Fig. 7 and Table 4).
Twenty years ago, Yu and co-workers (58) obtained very similar νC-O values for CO bound to αGln and Gly(E7) and to βGln, Gly, Val, and Phe (E7) mutant/wild-type hybrid tetramers using resonance Raman techniques. Our new results and their previous data suggest strongly that positive electrostatic fields occur near bound ligands in both HbA subunits and are lost when His(E7) is mutated to an apolar amino acid.
DISCUSSION
O2 Affinity and Hydrogen Bonding
The 1.25 Å resolution crystal structures of the α and β subunits in oxygenated human HbA are shown in Fig. 8 (26). Even a cursory examination shows that the imidazole side chains in both subunits have roughly the same conformation and are equidistant from the bound O2 atoms. The reported distances between the His(E7) NϵH atoms and the ligand atoms in the α and β subunits are 2.7 and 3.0 Å, respectively (26). These distances are similar to the values reported for MbO2, 2.6–2.8 Å (46, 59). The effects on oxygen affinity of the apolar E7 amino acid substitutions allow an assessment of the relative strengths of the apparent hydrogen bonds within HbA subunits and myoglobin.
FIGURE 8.

Structures of the α and β active sites in HbO2. The figures were constructed from the high resolution structure of human oxyhemoglobin A (2DN1) determined by Park et al. (26). The key residues of the heme pocket are labeled and shown in sticks. The atoms of the key amino acids are colored as following: white, carbon; blue, nitrogen; red, oxygen; yellow, the atoms of other amino acids lining the binding site; red, O atoms of bound dioxygen; and orange, heme iron. The blue dotted lines in the α subunits represent H-bonds between His (CE3) and the carboxylate oxygen atoms of the heme 6-propionate, and Lys (E10) and the carboxylates of the heme 7-propionate.
The free energy released when O2 binds to a globin can be divided into four components: 1) the intrinsic free energy change for binding to an unhindered pentacoordinate heme in an apolar environment, ΔGheme0; 2) the free energy changes associated with movement of the iron into the plane of the heme, which is governed by constraints on the geometry of the Fe-His(F8) complex and back-bonding by the proximal imidazole, ΔGprox0; 3) hindrance with surrounding distal pocket amino acids, ΔGdistal0, which excludes possible steric clashes with E7 residue; and 4) both favorable and unfavorable interactions with the E7 side chain, ΔGE70 (Equation 6).
Interactions with the E7 amino acid side chain can be divided into three categories (Equation 7): (a) stabilization of the bound ligand by hydrogen bond donation, ΔG(E7)H-bond0; (b) inhibition of ligand binding by distal pocket water, which in the native deoxyHb subunits can be hydrogen-bonded to the imidazole side chain, ΔG(E7)water0; and (c) direct or indirect steric hindrance with the bound ligand, ΔG(E7)steric0.
 |
When His(E7) is mutated to smaller apolar amino acids, i.e. Gly, Ala, and Leu, the values of ΔGheme0, ΔGprox0, and ΔGdistal0 should be unaltered. The effects of small apolar E7 substitutions on the overall free energy of O2 binding, δΔGmutant0, can be calculated from the ratio of the mutant to wild-type equilibrium constants (Equation 8) and should equal δΔGE70.
 |
Because these amino acid side chains are small and apolar, they do not interact with bound ligands nor do they stabilize internal water molecules, and all three terms in Equation 7 should be zero for O2 binding to these variants. As a result, δΔGE70 in Equation 8 should be approximately equal to −(ΔGHis(E7)water0 + ΔGHis(E7)H-bond0), which represents the free energy difference between the loss of the unfavorable requirement to displace water noncovalently attached to His(E7) and the loss of favorable electrostatic stabilization of the bound ligand by His(E7) (13). In this analysis, it is assumed that there are no unfavorable steric interactions between bound ligands and His(E7) (ΔGHis(E7)steric0 = 0) and that the close proximity of the imidazole side chain to bound O2 and CO is due to favorable hydrogen bonding interactions.
Values of −δΔGE70for α and β subunits of HbA were calculated using the average values for the Gly, Ala, and Leu(E7) mutants for KO2(mutant) in Equation 7 and are compared in Table 5 with that computed for sperm whale Mb using the average KO2 value for Ala, Val, and Leu(E7) mutants. Gly(E7) Mb was excluded because there are discrete water molecules in the distal pocket that clearly stabilize bound O2 (60). The results in Table 5 demonstrate that net stabilization of bound O2 by His(E7) (ΔGHis(E7)H-bond0 + ΔGHis(E7)water0) is roughly the same, −5.6 kJ/mol, in both subunits of HbA and ∼2-fold weaker than the net stabilization observed in mammalian Mb, ∼−10 kJ/mol at 20 °C, pH 7.0.
TABLE 5.
Effects of small apolar E7 mutations on ΔG0 for O2 binding to HbA and sperm whale Mb
δΔGmutant = δΔGE7 = −RTln(KO2(mutant)avg/KO2(native)), where KO2(mutant)avg represents the average O2 affinity for unhindered E7 mutants containing Gly, Ala, and Leu at the E7 position (Equations 6 and 7). Oxygen affinities for these calculations were taken from Table 1. The KO2 values for sperm whale Mb (Mb SW) were taken from Ref. 17 as described in the text. Superscript M and T stand for monomer and tetramer, respectively. As described in the text, −δΔGE7 for small apolar mutations defines the net electrostatic stabilization of bound O2 His(E7) defined as the sum, Δ GHis(E7)water0 + Δ GHis(E7)H-bond0. Estimates of free energy for water displacement from native deoxyHb or deoxyMb were computed from −(−RTln(kO2′(mutant)T,M, avg/kO2′(native,WT)avg)), where kO2′(mutant)T,M, avg is the average O2 association rate constant for Gly, Ala, and Leu(E7) mutants in monomers and tetramers of Hb subunits and Ala, Val, and Leu(E7) mutants of Mb. Estimates of the free energy for H-bond donation to bound O2 were computed from −RTln(kO2(mutant)T,M, avg/kO2(native,WT)avg), where kO2(mutant)T,M, avg is the average O2 dissociation rate constant for Gly, Ala, and Leu(E7) mutants in monomers and tetramers of Hb subunits and Ala, Val, and Leu(E7) mutants of Mb. All rate parameters for HbA subunits were taken from Table 1, and those for Mb were taken from Scott et al. (17).
| Globin | E7 substitutions | KO2,avg | KO2(mutant)avg/KO2(native, WT)avg | δΔGE7 | − δΔGE7(avg) | ΔGHis(E7)water0 | ΔGHis(E7)H-bond0 |
|---|---|---|---|---|---|---|---|
| μm−1 | kJ/mol | kJ/mol | kJ/mol | kJ/mol | |||
| αHbA | His | 2.5 ± 1.2 | |||||
| Gly, Ala, LeuM | 0.28 ± 0.15 | 0.11 ± 0.08 | 5.4 ± 1.8 | ||||
| HisT | 1.9 ± 0.5 | − 4.7 ± 1.2a | +3.7 ± 1.0 | − 8.6 ± 1.0 | |||
| Gly, Ala, LeuT | 0.35 ± 0.20 | 0.18 ± 0.11 | 4.1 ± 1.5 | ||||
| βHbA | HisM | 2.3 ± 1.0 | |||||
| G,A,LM | 0.18 ± 0.05 | 0.08 ± 0.04 | 6.2 ± 1.3 | ||||
| HT | 3.9 ± 0.6 | − 6.5 ± 0.7a | +1.5 ± 0.7 | − 8.0 ± 1.2 | |||
| Gly, Ala, LeuT | 0.24 ± 0.07 | 0.06 ± 0.02 | 6.8 ± 0.8 | ||||
| Mb SW | His | 1.1 ± 0.2 | |||||
| Ala, Val, Leu | 0.020 ± 0.008 | 0.018 ± 0.008 | 9.8 ± 1.0 | − 9.8 ± 1.0a | +4.1 ± 1.0 | − 14.5 ± 2.1 |
a The value of −δΔGE7(avg) can also be estimated from the sum of the ΔGHis(E7)water0 and ΔGHis(E7)H-bond0 values calculated from an analysis of the effects of mutagenesis on the O2 association and dissociation rate constants, respectively. The correspondence between values of −δΔGE7(avg) calculated from the sum of the entries in last two columns and that calculated from the ratio of observed equilibrium constants is quite good indicating that the analyses are self-consistent.
Olson and Phillips (13) have suggested that increases in O2 association rate constants due to apolar amino acid substitutions provide a measure of the loss of distal pocket water. They estimated the value of ΔGHis(E7)water0 from −RTln(kO2′ (small apolar E7 mutant)avg/kO2′(WT, native)), arguing that, in Mb, a significant barrier to ligand entry is displacement of distal pocket water. ΔGHis(E7)water0 was estimated using average values of kO2′ for the Gly(E7), Ala(E7), and Leu(E7) mutants of Hb subunits and Ala(E7), Val(E7), and Leu(E7) mutants of Mb (Table 5).
Olson and Phillips (13) also argued that the strength of His(E7) hydrogen bonding to bound O2 could be estimated from a comparison of the apolar mutant dissociation rate constants with those for wild-type and native Mb (i.e. ΔGHis(E7)H-bond0 ≈ −RTln(kO2(small apolar E7 mutants)/kO2 (WT, native)); last column in Table 5). This calculation assumes that kO2 reflects primarily the thermal rate of Fe-O2 bond breakage, which will be reduced markedly by the favorable free energy of hydrogen bonding. The overall value of kO2 is reduced by geminate recombination and increased by direct steric hindrance, but these effects are normally small compared with the 10–100-fold reduction in rate due to electrostatic interaction with His(E7) (Tables 1 and 3) (13).
The results in Table 5 are clear and supported by the published structures of Mb and HbA. Both α subunits and Mb contain distal pocket water (26, 46), which reduces the free energy liberated during O2 binding by ∼ +4 kJ/mol. In contrast, no observable water is present in the distal pocket of deoxygenated β subunits (26), and ΔGHis(E7)water0 is only +1.5 kJ/mol, which is roughly zero considering the errors in the measurements. The extents of electrostatic stabilization of bound O2 in both subunits of HbA are roughly the same, ∼−8 kJ/mol, and almost half that observed in Mb, where GHis(E7)H-bond0 is ∼−14.5 kJ/mol.
The enhanced H-bonding in myoglobin is supported by the lower νC-O value of native MbCO (∼1941 cm−1) compared with those of tetrameric and isolated αCO and βCO subunits (∼1950 cm−1, see Table 4). In contrast, the νC-O values for the apolar mutants of all three globins are in the 1965–1968 cm−1 range. Clearly, there is a stronger positive electrostatic field adjacent to bound ligands in Mb than in the subunits of human HbA, accounting for the greater net stabilization of bound O2.
Correlations between KCO and KO2
Fig. 9A shows a plot of logKCO versus logKO2 for all the mutants listed in Tables 1 and 2. The apolar mutant equilibrium constants fall on a straight line with a slope of 1. The smaller amino acid substitutions show KCO and KO2 values that cluster together in the upper right of Fig. 9A. Increasing the size of the E7 side chain from Leu to Phe and Trp causes, with one exception, uniform decreases in both affinity constants. In the case of αTrp(E7), two sets of constants were estimated, one for the transient open conformer observed directly after laser photolysis and one for the equilibrium closed conformation. The transient open conformer shows affinities and rate constants for CO and O2 binding that are similar to those of the Gly(E7) and Ala(E7) mutants (Fig. 9A, upper open circles), whereas the closed conformer shows the lowest affinity constants (Fig. 9A, lower open circles). The polar variants (His and Gln(E7)) have much higher oxygen affinities due to preferential electrostatic stabilization of bound O2 (Fig. 9A, solid circles), and the KO2 and KCO values cluster significantly to the right of the line for the apolar E7 variants.
FIGURE 9.

Effects of E7 mutants on KCO,KO2, and their ratio M. A, correlation between logKCO and logKO2 of wild-type and E7 mutant HbA subunits and tetramers. Closed circles represent data for subunits containing polar His and Gln(E7) side chains; open circles represent data for apolar E7 mutants. There is strong linear correlation between logKCO and logKO2 values for the apolar mutants, whereas the polar E7 variants are clearly outliers and show little correlation as a group. B, effects of mutagenesis on ligand discrimination expressed as log(KCO/KO2) or log(M) and plotted as function of the size of the E7 amino acid. Black bars represent α-E7 mutants, and the gray bars represent β-E7 mutants. The upper dashed line represents the logarithm of the average M value for all the apolar mutants, and the lower dashed line represents the logarithm of the average M for HbA subunits. (M) and (T) in the name of the mutant specifies whether log(KCO/KO2) was calculated for isolated subunit monomers or the mutant subunit in hybrid tetramers, respectively. NatHisE7 and WTHisE7 stand for native HbA (derived from red blood cells) and wild-type recombinant HbA (expressed in E. coli). Data for the diagrams were taken from Tables 1 and 2.
Ligand Discrimination and Polarity
The traditional way of looking at discrimination in favor of O2 versus CO binding is to examine the dependence of the ratio KCO/KO2 (M value) on ligand size and polarity as shown in Fig. 9B (KCO and KO2 values from Tables 1 and 2). The results are very clear. The average M value for all the apolar E7 mutants is 34,000, and although the variation in the KCO/KO2 ratio appears large, ±85%, this σ value is small compared with 2–3 orders of magnitude variation in the absolute values of KCO and KO2 (Fig. 9A). When Gln is present at the E7 position, the average M value for the α and β subunits is ∼900 ± 400, and the average M value for the wild-type His(E7) subunits is 260 ± 150. The latter value is 10 times greater than that for mammalian Mb, for which M ≈ 30. The increase in M value for the α and β subunits correlates well with the less negative values of ΔG(E7)H-bond and the higher νC-O frequencies of the HbCO complexes compared with the corresponding parameters for sperm whale Mb. The strength of the positive electrostatic field near bound ligands, which preferentially enhances O2 binding, is clearly larger in Mb than in the subunits of HbA.
Steric Hindrance by Phe(E7) and Trp(E7)
The marked decreases in KO2 for βPhe(E7), βTrp(E7), αPhe(E7), and the closed αTrp(E7) mutants shown in Fig. 9A and Table 1 imply a large ΔG(E7)steric0 term in Equation 7 for these mutants. This increase is due to either direct hindrance of the bound ligand by the aromatic E7 side chains or indirect inhibition by the need to displace the side chain from the active site before incoming ligands can be captured. The extent of this “extra” hindrance by the benzyl and indole side chains can be estimated by computing δΔGPhe(E7) or δΔGTrp(E7) from −RTln(KO2,mutant/KO2,native) and then subtracting the δΔGsmall,apolar E7 term determined from effects of the Gly, Ala, and Leu(E7) mutations, which take into account the loss of hindrance by distal pocket water and the loss of stabilization of bound O2 by the native His(E7) side chain (i.e. the ΔGHis(E7)H-bond0 + ΔGHis(E7)water0 terms in Equation 7). The results of these calculations for the Phe and Trp(E7) mutants are summarized in Table 6.
TABLE 6.
Effects of Phe(E7) and Trp(E7) mutants on O2 binding to HbA and sperm whale Mb
δΔGPhe(E7) or δΔGTrp(E7) values were calculated as −RTln(KO2,mutant/KO2,native) and found to be significantly larger than the δΔGE7 values computed for the smaller Gly, Ala, and Leu mutants, implying steric hindrance by the larger Phe and Trp side chains. The extent of this effect was estimated as ΔG(E7)steric = δΔGPhe(E7) or δΔGTrp(E7) − δΔGsmall, apolar E7, where δΔGsmall, apolar E7 was taken from monomer and tetramer values for δΔGE7(avg) in Table 5 for each subunit. O2 affinities for the Phe(E7) and Trp(E7) were taken from Table 1. KO2 values for sperm whale Mb (Mb SW) were taken from Ref. 17. Superscripts M and T stand for monomer and tetramer, respectively. The estimated errors for δΔG(E7)steric are assumed to similar to those for the δΔGE7 values in Table 5, i.e. ≤ ±2 kJ/mol. Thus, the values of ΔG(E7)steric for the open conformation of αTrp(E7) and the Phe(E7) and Trp(E7) mutants of Mb are very close to zero, and the decreases in KO2 for these mutants are similar to those for the corresponding small apolar E7 mutants.
| Globin | E7 mutants | KO2(mutant)/KO2(native) | δΔGPhe or δΔGTrp(E7) | δΔGsmall, apolar E7 | ΔG(E7)steric |
|---|---|---|---|---|---|
| kJ/mol | kJ/mol | kJ/mol | |||
| αHbA | Phe(E7)M | 0.0021 | 15.0 | 5.4 | 9.6 |
| Phe(E7)T | 0.0068 | 12.1 | 4.1 | 8.0 | |
| Trp(E7)M closed | 0.0004 | 19.1 | 5.4 | 13.7 | |
| Trp(E7)M open | 0.24 | 3.4 | 5.4 | −2.0 | |
| Trp(E7)T open | 0.14 | 4.7 | 4.1 | 0.6 | |
| βHbA | Phe(E7)M | 0.0043 | 13.2 | 6.2 | 7.0 |
| Phe(E7)T | 0.0051 | 12.8 | 6.8 | 6.0 | |
| Trp(E7)M | 0.0039 | 13.5 | 6.2 | 7.3 | |
| Trp(E7)T | 0.0051 | 12.8 | 6.8 | 6.0 | |
| Mb SW | Phe(E7) | 0.0067 | 12.1 | 9.8 | 2.4 |
| Trp(E7) | 0.064 | 6.7 | 9.8 | −3.1 |
For α and β subunits, the introduction of the benzyl side chain causes both the loss of net electrostatic stabilization and significant hindrance by the aromatic ring, with ΔGPhe(E7)steric0 ≈ +7 to +9 kJ/mol. As a result, the O2 affinities of these Phe(E7) mutants are very small, i.e. KO2 ≈0.01 μm−1 or P50 ≈ 100 μm in the R state. The βTrp(E7) mutation causes a similar amount of added hindrance, ΔGTrp(E7)steric0 ≈ +7 kJ/mol.
The closed unliganded conformer of αTrp(E7) shows a dramatic amount of steric inhibition, leading to an estimated O2 association equilibrium constant equal to ∼0.001 μm−1 (P50 ≈ 1000 μm) and ΔGTrp(E7)steric0 ≈ +14 kJ/mol. In contrast, the transient open conformation of αTrp(E7) in both monomers and tetramers has an estimated KO2 value of ∼0.4 μm−1, which is similar to the KO2 values for the smaller Gly, Ala, and Leu(E7) mutants, and it exerts no steric resistance to ligand binding (ΔGTrp(E7)steric0 ≈ 0 kJ/mol, Table 6).
The inhibitory effect of the Phe(E7) and the closed Trp(E7) conformers occurs roughly to the same extent for both O2 and CO binding (Tables 1 and 2 and Fig. 9A). Decreases in KO2 and KCO for Phe(E7) mutants are caused by increased dissociation rate constants (kO2 and kCO, see Tables 1 and 2), suggesting that the negative steric effect is due to the direct hindrance of the bound ligand by the benzyl side chain. The low ligand affinities for equilibrium deoxyHb Trp(E7) conformers are due to very low kO2′ and kCO′ values. The latter case is an example of indirect steric inhibition of ligand binding due to the requirement for displacement of the bulky E7 side chain from the binding site.
In contrast to the HbA replacements, the Phe(E7) and Trp(E7) mutations in Mb cause little or no hindrance (i.e. small or negative ΔG(E7)steric values for the Mb mutants in Table 6). These results suggest that the Mb active site can either accommodate both the aromatic side chains and a bound ligand or, more likely, that these large side chains are prevented from entering the active site and directly hindering bound ligands.
E7 Gate Appears to be the Pathway for Ligand Entry into HbA
With one exception (the transient, open αTrp(E7) conformer), there are dramatic decreases in the bimolecular rates of O2, CO, and NO binding to the subunits of Hb with increasing size of the E7 side chain (Tables 1–3). These results suggest that ligands enter and exit through a channel gated by the distal histidine. We used overall CO association rate constants and the fraction of geminate CO recombination to estimate bimolecular rate constants for ligand entry into isolated HbA subunits and then measured association rate constants for NO binding to both monomers and tetramers to verify these estimates of kentry′ experimentally (Table 3). The dependence of kNO′ on the size of the E7 side chain in monomeric α and β subunits and sperm whale Mb is shown in Fig. 10.
FIGURE 10.

Dependence of rate constant for NO association on E7 mutations in monomeric α subunits, β subunits, and Mb. Native HbA contains His at the E7 position. Only the slow phase values for kNO′ for αTrp(E7) was used because it represents NO binding to the closed, physiologically relevant equilibrium state of the mutant. Data for sperm whale Mb mutants were taken from Ref. 17, and kNO′ for HbA mutants were taken from Table 3.
The Gly and Ala(E7) mutations open up both HbA subunits and Mb, causing bimolecular rate constants on the order of 200 μm−1 s−1, which is close to the diffusion limit (32, 38, 51, 61). The Trp(E7) mutations markedly decrease kNO′ to values ≤6 μm−1 s−1, effectively blocking the E7 channel, and there is a roughly monotonic decrease in the rate of NO binding with increasing size of the E7 side chain for other mutants. Scott et al. (17) carried out a much more extensive mutagenesis mapping study of Mb using 90 mutants at 27 different positions, and their results confirmed quantitatively the E7 gate mechanism for ligand entry into Mb, which was originally developed using just E7 mutations (60). By analogy with the more extensive results for Mb, it seems clear that the E7 channel is also the major route for ligand entry into both subunits of HbA.
The most striking difference between the α and β subunits is the appearance of a rapidly reacting, transient intermediate after photolysis of Trp(E7) αCO subunits. Movement of the indole side chain to its equilibrium unliganded conformation in α subunits appears to be relatively slow (∼104 s−1) compared with bimolecular ligand binding at high CO or O2 concentrations. The small amplitude of the fast phase after complete photolysis of Trp(E7) βCO subunits suggests more rapid side chain relaxation. The cause of the slow relaxation in α subunits appears to be a narrower channel opening, due in part to the large His(CE3) side chain in α subunits (Fig. 8). In β subunits, the channel is larger due to a smaller Ser side chain at the CD3 position, which presumably facilitates inward rotation of the E7 side chain after ligands leave the active site.
As is the case for the Mb mutant (17), the low rates of ligand binding to the equilibrium forms of the Trp(E7) deoxyHb subunits do not rule out alternative trajectories for ligand entry that have been identified by molecular dynamics simulations (62, 63). However, the 10–30-fold decreases in kentry′ and kNO′ due to replacement of His(E7) with Trp (Table 3) imply that the alternative pathways may account for only 3–10% of the binding events in the native Hb subunits.
The larger opening in β subunits may also contribute to the 2-fold higher bimolecular rate constants for O2 and NO binding to native or wild-type β subunits, particularly in tetrameric hemoglobin where protein fluctuations are dampened by the quaternary structure (see supplemental Table 1S). The CD3 amino acid in Mb is Arg and the rate of entry into Mb does increase up ∼2-fold when this residue is decreased in size (17). However, the differences in rate constants between the native α and β subunits are small compared with the effects of the Gly and Trp(E7) mutations, which cause ∼3–5-fold increases and 15–80-fold decreases, respectively, in the rates of ligand entry into the equilibrium R state forms of deoxygenated HbA (Fig. 10).
Conclusions
Our new results for E7 mutants of HbA demonstrate unambiguously that the distal histidine stabilizes bound O2 to roughly the same extent (∼−5.6 kJ/mol) in both the α and β subunits of R state HbA, in agreement with recent high resolution NMR and crystal structures of oxyHbA (25, 26), as well as theoretical calculations of the energy of interaction between His(E7) and O2 (64). The strength of this net, favorable electrostatic interaction in HbA, appears to be roughly half that observed for the interaction of His(E7) with O2 in mammalian myoglobin, where the net electrostatic stabilization is ∼−10 kJ/mol. In both HbA subunits and Mb, ligand discrimination occurs by preferential electrostatic stabilization of bound O2 rather than steric hindrance of CO. When steric hindrance occurs due to the large aromatic rings of Phe(E7) and Trp(E7), the affinities of both ligands decrease to roughly the same extent in both HbA subunits, and the M value remains constant (Fig. 9).
The bimolecular rate constants for ligand binding to α and β subunits of HbA decrease markedly with increasing size of the E7 side chain. By analogy to Mb, these results suggest that diatomic ligands enter and exit native HbA through a channel created by outward motion of the distal histidine. Thus, the basic stereochemical mechanisms governing the rates and affinities of ligand binding to R state HbA are identical to those that occur in Mb. There are subtle differences between the ligand binding properties of the α and β subunits that appear to be due to the size of the E7 channel opening, which is smaller in α subunits because of His at the CE3 position compared with Ser in β subunits, and the lack of ordered water in the distal pocket of deoxygenated native β subunit.
Supplementary Material
Acknowledgments
We acknowledge Erin Weber and Dr. Yi Dou for constructing and expressing the first αLeu(E7)/βWT and αWT/βLeu(E7) mutant hybrid Hb tetramers and conducting the preliminary ligand binding kinetic measurements (supplemental Table 1S), Dr. Jayashree Soman and Mallory Salter for making suggestions to improve the manuscript, and Anastasiya Birukova for helping to prepare some of the recombinant Hb samples.
This work was supported, in whole or in part, by National Institutes of Health Grants GM035649 and HL047020. This work was also supported by Grant C0612 from The Robert A. Welch Foundation (to J. S. O.), a Welch Foundation predoctoral fellowship (to I. B.), and Predoctoral Training Fellowship Grant GM 80820 from the Houston Area Molecular Biophysics (to R. L. S.).

The on-line version of this article (available at http://www.jbc.org) contains supplemental material A–F, Table 1S, Fig. 1S, and additional references.
The helical nomenclature refers to the position of the amino acid along each helix of the globin fold. The helices are designated A–H starting from the N terminus of each subunit, and the positions are numbered from the N- to C-terminal amino acids of each helix. For example, His(E7) refers to the histidine at the seventh position along the E-helix, which in the α and β subunits are His-58 and His-63, respectively.
- HbA
- adult human hemoglobin
- WT
- wild type
- FTIR
- Fourier-transform infrared spectroscopy.
REFERENCES
- 1.Perutz M. F. (1970) Nature 228, 726–739 [DOI] [PubMed] [Google Scholar]
- 2.Pauling L. (1964) Nature 203, 182–18314207238 [Google Scholar]
- 3.Perutz M. F., Mathews F. S. (1966) J. Mol. Biol. 21, 199–202 [DOI] [PubMed] [Google Scholar]
- 4.Jameson G. B., Molinaro F. S., Ibers J. A., Collman J. P., Brauman J. I., Rose E., Suslick K. S. (1980) J. Am. Chem. Soc. 102, 3224–3237 [Google Scholar]
- 5.Slebodnick C., Ibers J. A. (1997) J. Biol. Inorg. Chem. 2, 521–525 [Google Scholar]
- 6.Traylor T. G., Deardurff L. A., Coletta M., Ascenzi P., Antonini E., Brunori M. (1983) J. Biol. Chem. 258, 12147–12148 [PubMed] [Google Scholar]
- 7.Springer B. A., Egeberg K. D., Sligar S. G., Rohlfs R. J., Mathews A. J., Olson J. S. (1989) J. Biol. Chem. 264, 3057–3060 [PubMed] [Google Scholar]
- 8.Springer B. A., Sligar S. G., Olson J. S., Phillips G. N., Jr. (1994) Chem. Rev. 94, 699–714 [Google Scholar]
- 9.Momenteau M., Reed C. A. (1994) Chem. Rev. 94, 659–698 [Google Scholar]
- 10.Olson J. S., Mathews A. J., Rohlfs R. J., Springer B. A., Egeberg K. D., Sligar S. G., Tame J., Renaud J. P., Nagai K. (1988) Nature 336, 265–266 [DOI] [PubMed] [Google Scholar]
- 11.Mathews A. J., Rohlfs R. J., Olson J. S., Tame J., Renaud J. P., Nagai K. (1989) J. Biol. Chem. 264, 16573–16583 [PubMed] [Google Scholar]
- 12.Shaanan B. (1983) J. Mol. Biol. 171, 31–59 [DOI] [PubMed] [Google Scholar]
- 13.Olson J. S., Phillips G. N. (1997) J. Biol. Inorg. Chem. 2, 544–552 [Google Scholar]
- 14.Phillips G. N., Jr., Teodoro M., Li T., Smith B., Gilson M. M., Olson J. S. (1999) J. Phys. Chem. B 103, 8817–8829 [Google Scholar]
- 15.Spiro T. G., Kozlowski P. M. (2001) Acc. Chem. Res. 34, 137–144 [DOI] [PubMed] [Google Scholar]
- 16.Park E. S., Boxer S. G. (2002) J. Phys. Chem. B 106, 5800–5806 [Google Scholar]
- 17.Scott E. E., Gibson Q. H., Olson J. S. (2001) J. Biol. Chem. 276, 5177–5188 [DOI] [PubMed] [Google Scholar]
- 18.Olson J. S., Soman J., Phillips G. N., Jr. (2007) IUBMB Life 59, 552–562 [DOI] [PubMed] [Google Scholar]
- 19.Tian W. D., Sage J. T., Champion P. M. (1993) J. Mol. Biol. 233, 155–166 [DOI] [PubMed] [Google Scholar]
- 20.Tian W. D., Sage J. T., Champion P. M., Chien E., Sligar S. G. (1996) Biochemistry 35, 3487–3502 [DOI] [PubMed] [Google Scholar]
- 21.Morikis D., Champion P. M., Springer B. A., Sligar S. G. (1989) Biochemistry 28, 4791–4800 [DOI] [PubMed] [Google Scholar]
- 22.Yang F., Phillips G. N., Jr. (1996) J. Mol. Biol. 256, 762–774 [DOI] [PubMed] [Google Scholar]
- 23.Mathews A. J., Olson J. S. (1994) Methods Enzymol. 232, 363–386 [DOI] [PubMed] [Google Scholar]
- 24.Unzai S., Eich R., Shibayama N., Olson J. S., Morimoto H. (1998) J. Biol. Chem. 273, 23150–23159 [DOI] [PubMed] [Google Scholar]
- 25.Lukin J. A., Simplaceanu V., Zou M., Ho N. T., Ho C. (2000) Proc. Natl. Acad. Sci. U.S.A. 97, 10354–10358 [DOI] [PMC free article] [PubMed] [Google Scholar]
- 26.Park S. Y., Yokoyama T., Shibayama N., Shiro Y., Tame J. R. (2006) J. Mol. Biol. 360, 690–701 [DOI] [PubMed] [Google Scholar]
- 27.Olson J. S., Rohlfs R. J., Gibson Q. H. (1987) J. Biol. Chem. 262, 12930–12938 [PubMed] [Google Scholar]
- 28.Looker D., Mathews A. J., Neway J. O., Stetler G. L. (1994) Methods Enzymol. 231, 364–374 [DOI] [PubMed] [Google Scholar]
- 29.Shen T. J., Ho N. T., Simplaceanu V., Zou M., Green B. N., Tam M. F., Ho C. (1993) Proc. Natl. Acad. Sci. U.S.A. 90, 8108–8112 [DOI] [PMC free article] [PubMed] [Google Scholar]
- 30.Shen T. J., Ho N. T., Zou M., Sun D. P., Cottam P. F., Simplaceanu V., Tam M. F., Bell D. A., Jr., Ho C. (1997) Protein Eng. 10, 1085–1097 [DOI] [PubMed] [Google Scholar]
- 31.Parkhurst K. M., Parkhurst L. J. (1992) Int. J. Biochem. 24, 993–998 [DOI] [PubMed] [Google Scholar]
- 32.Salter M. D., Nienhaus K., Nienhaus G. U., Dewilde S., Moens L., Pesce A., Nardini M., Bolognesi M., Olson J. S. (2008) J. Biol. Chem. 283, 35689–35702 [DOI] [PMC free article] [PubMed] [Google Scholar]
- 33.Olson J. S., Foley E. W., Maillett D. H., Paster E. V. (2003) Methods Mol. Med. 82, 65–91 [DOI] [PubMed] [Google Scholar]
- 34.Mathews A. J., Olson J. S., Renaud J. P., Tame J., Nagai K. (1991) J. Biol. Chem. 266, 21631–21639 [PubMed] [Google Scholar]
- 35.Cassoly R., Gibson Q. (1975) J. Mol. Biol. 91, 301–313 [DOI] [PubMed] [Google Scholar]
- 36.Olson J. S., Phillips G. N., Jr. (1996) J. Biol. Chem. 271, 17596. [PubMed] [Google Scholar]
- 37.Maillett D. H., Simplaceanu V., Shen T. J., Ho N. T., Olson J. S., Ho C. (2008) Biochemistry 47, 10551–10563 [DOI] [PMC free article] [PubMed] [Google Scholar]
- 38.Smagghe B. J., Hoy J. A., Percifield R., Kundu S., Hargrove M. S., Sarath G., Hilbert J. L., Watts R. A., Dennis E. S., Peacock W. J., Dewilde S., Moens L., Blouin G. C., Olson J. S., Appleby C. A. (2009) Biopolymers 91, 1083–1096 [DOI] [PubMed] [Google Scholar]
- 39.Trent J. T., 3rd, Hvitved A. N., Hargrove M. S. (2001) Biochemistry 40, 6155–6163 [DOI] [PubMed] [Google Scholar]
- 40.Trent J. T., 3rd, Watts R. A., Hargrove M. S. (2001) J. Biol. Chem. 276, 30106–30110 [DOI] [PubMed] [Google Scholar]
- 41.Hvitved A. N., Trent J. T., 3rd, Premer S. A., Hargrove M. S. (2001) J. Biol. Chem. 276, 34714–34721 [DOI] [PubMed] [Google Scholar]
- 42.Ikeda-Saito M., Dou Y., Yonetani T., Olson J. S., Li T., Regan R., Gibson Q. H. (1993) J. Biol. Chem. 268, 6855–6857 [PubMed] [Google Scholar]
- 43.Gibson Q. H., Olson J. S., McKinnie R. E., Rohlfs R. J. (1986) J. Biol. Chem. 261, 10228–10239 [PubMed] [Google Scholar]
- 44.Franzen S. (2002) J. Am. Chem. Soc. 124, 13271–13281 [DOI] [PubMed] [Google Scholar]
- 45.Carver T. E., Rohlfs R. J., Olson J. S., Gibson Q. H., Blackmore R. S., Springer B. A., Sligar S. G. (1990) J. Biol. Chem. 265, 20007–20020 [PubMed] [Google Scholar]
- 46.Quillin M. L., Arduini R. M., Olson J. S., Phillips G. N., Jr. (1993) J. Mol. Biol. 234, 140–155 [DOI] [PubMed] [Google Scholar]
- 47.Jongeward K. A., Magde D., Taube D. J., Marsters J. C., Traylor T. G., Sharma V. S. (1988) J. Am. Chem. Soc. 110, 380–387 [Google Scholar]
- 48.Carlson M. L., Regan R., Elber R., Li H., Phillips G. N., Jr., Olson J. S., Gibson Q. H. (1994) Biochemistry 33, 10597–10606 [DOI] [PubMed] [Google Scholar]
- 49.Nienhaus K., Olson J. S., Franzen S., Nienhaus G. U. (2005) J. Am. Chem. Soc. 127, 40–41 [DOI] [PubMed] [Google Scholar]
- 50.McKinnie R. E., Olson J. S. (1981) J. Biol. Chem. 256, 8928–8932 [PubMed] [Google Scholar]
- 51.Olson J. S., McKinnie R. E., Mims M. P., White D. K. (1983) J. Am. Chem. Soc. 105, 1522–1527 [Google Scholar]
- 52.Hargrove M. S., Barry J. K., Brucker E. A., Berry M. B., Phillips G. N., Jr., Olson J. S., Arredondo-Peter R., Dean J. M., Klucas R. V., Sarath G. (1997) J. Mol. Biol. 266, 1032–1042 [DOI] [PubMed] [Google Scholar]
- 53.Friedman J. M., Scott T. W., Fisanick G. J., Simon S. R., Findsen E. W., Ondrias M. R., Macdonald V. W. (1985) Science 229, 187–190 [DOI] [PubMed] [Google Scholar]
- 54.Li T., Quillin M. L., Phillips G. N., Jr., Olson J. S. (1994) Biochemistry 33, 1433–1446 [DOI] [PubMed] [Google Scholar]
- 55.Ray G. B., Li X. Y., Ibers J. A., Sessler J. L., Spiro T. G. (1994) J. Am. Chem. Soc. 116, 162–176 [Google Scholar]
- 56.Park E. S., Andrews S. S., Hu R. B., Boxer S. G. (1999) J. Phys. Chem. B 103, 9813–9817 [Google Scholar]
- 57.Unno M., Christian J. F., Olson J. S., Sage J. T., Champion P. M. (1998) J. Am. Chem. Soc. 120, 2670–2671 [Google Scholar]
- 58.Lin S. H., Yu N. T., Tame J., Shih D., Renaud J. P., Pagnier J., Nagai K. (1990) Biochemistry 29, 5562–5566 [DOI] [PubMed] [Google Scholar]
- 59.Vojtechovský J., Chu K., Berendzen J., Sweet R. M., Schlichting I. (1999) Biophys. J. 77, 2153–2174 [DOI] [PMC free article] [PubMed] [Google Scholar]
- 60.Rohlfs R. J., Mathews A. J., Carver T. E., Olson J. S., Springer B. A., Egeberg K. D., Sligar S. G. (1990) J. Biol. Chem. 265, 3168–3176 [PubMed] [Google Scholar]
- 61.Thorsteinsson M. V., Bevan D. R., Potts M., Dou Y., Eich R. F., Hargrove M. S., Gibson Q. H., Olson J. S. (1999) Biochemistry 38, 2117–2126 [DOI] [PubMed] [Google Scholar]
- 62.Cohen J., Arkhipov A., Braun R., Schulten K. (2006) Biophys. J. 91, 1844–1857 [DOI] [PMC free article] [PubMed] [Google Scholar]
- 63.Elber R., Gibson Q. H. (2008) J. Phys. Chem. B 112, 6147–6154 [DOI] [PubMed] [Google Scholar]
- 64.Scherlis D. A., Estrin D. A. (2001) J. Am. Chem. Soc. 123, 8436–8437 [DOI] [PubMed] [Google Scholar]
Associated Data
This section collects any data citations, data availability statements, or supplementary materials included in this article.